HSBC's Aggressive US Stocks Overweight Strategy Faces Sustainability Challenges
Unlock More Features
Login to access AI-powered analysis, deep research reports and more advanced features

About us: Ginlix AI is the AI Investment Copilot powered by real data, bridging advanced AI with professional financial databases to provide verifiable, truth-based answers. Please use the chat box below to ask any financial question.
Related Stocks
Based on my analysis, HSBC strategist Max Kettner and his team’s “aggressive overweight” strategy on US stocks indeed faces certain challenges, and market risks are accumulating. Here is a detailed analysis:
According to the latest reports, HSBC strategists such as Max Kettner still maintain an “aggressive risk appetite” stance, with a near-maximum overweight on US stocks [1][2]. Their logic is based on:
- Mixed but overall positive economic data: US economic data shows a recovery trend, and investor confidence is strong [1]
- Inflation and yields remain manageable: As long as inflation is neither too cold nor too hot, and bond yields stay away from worrying levels for risk assets, the market will remain stable [2]
- Key risk events in December have passed: Market sentiment has improved significantly, and stocks are near record highs [1]
However, Kettner himself also admitted that “the team’s confidence and positions are slowly approaching the overbought zone” [2], indicating that they have realized the potential risks.
Based on my technical analysis of SPY (S&P 500 ETF) and QQQ (Nasdaq 100 ETF) [0]:
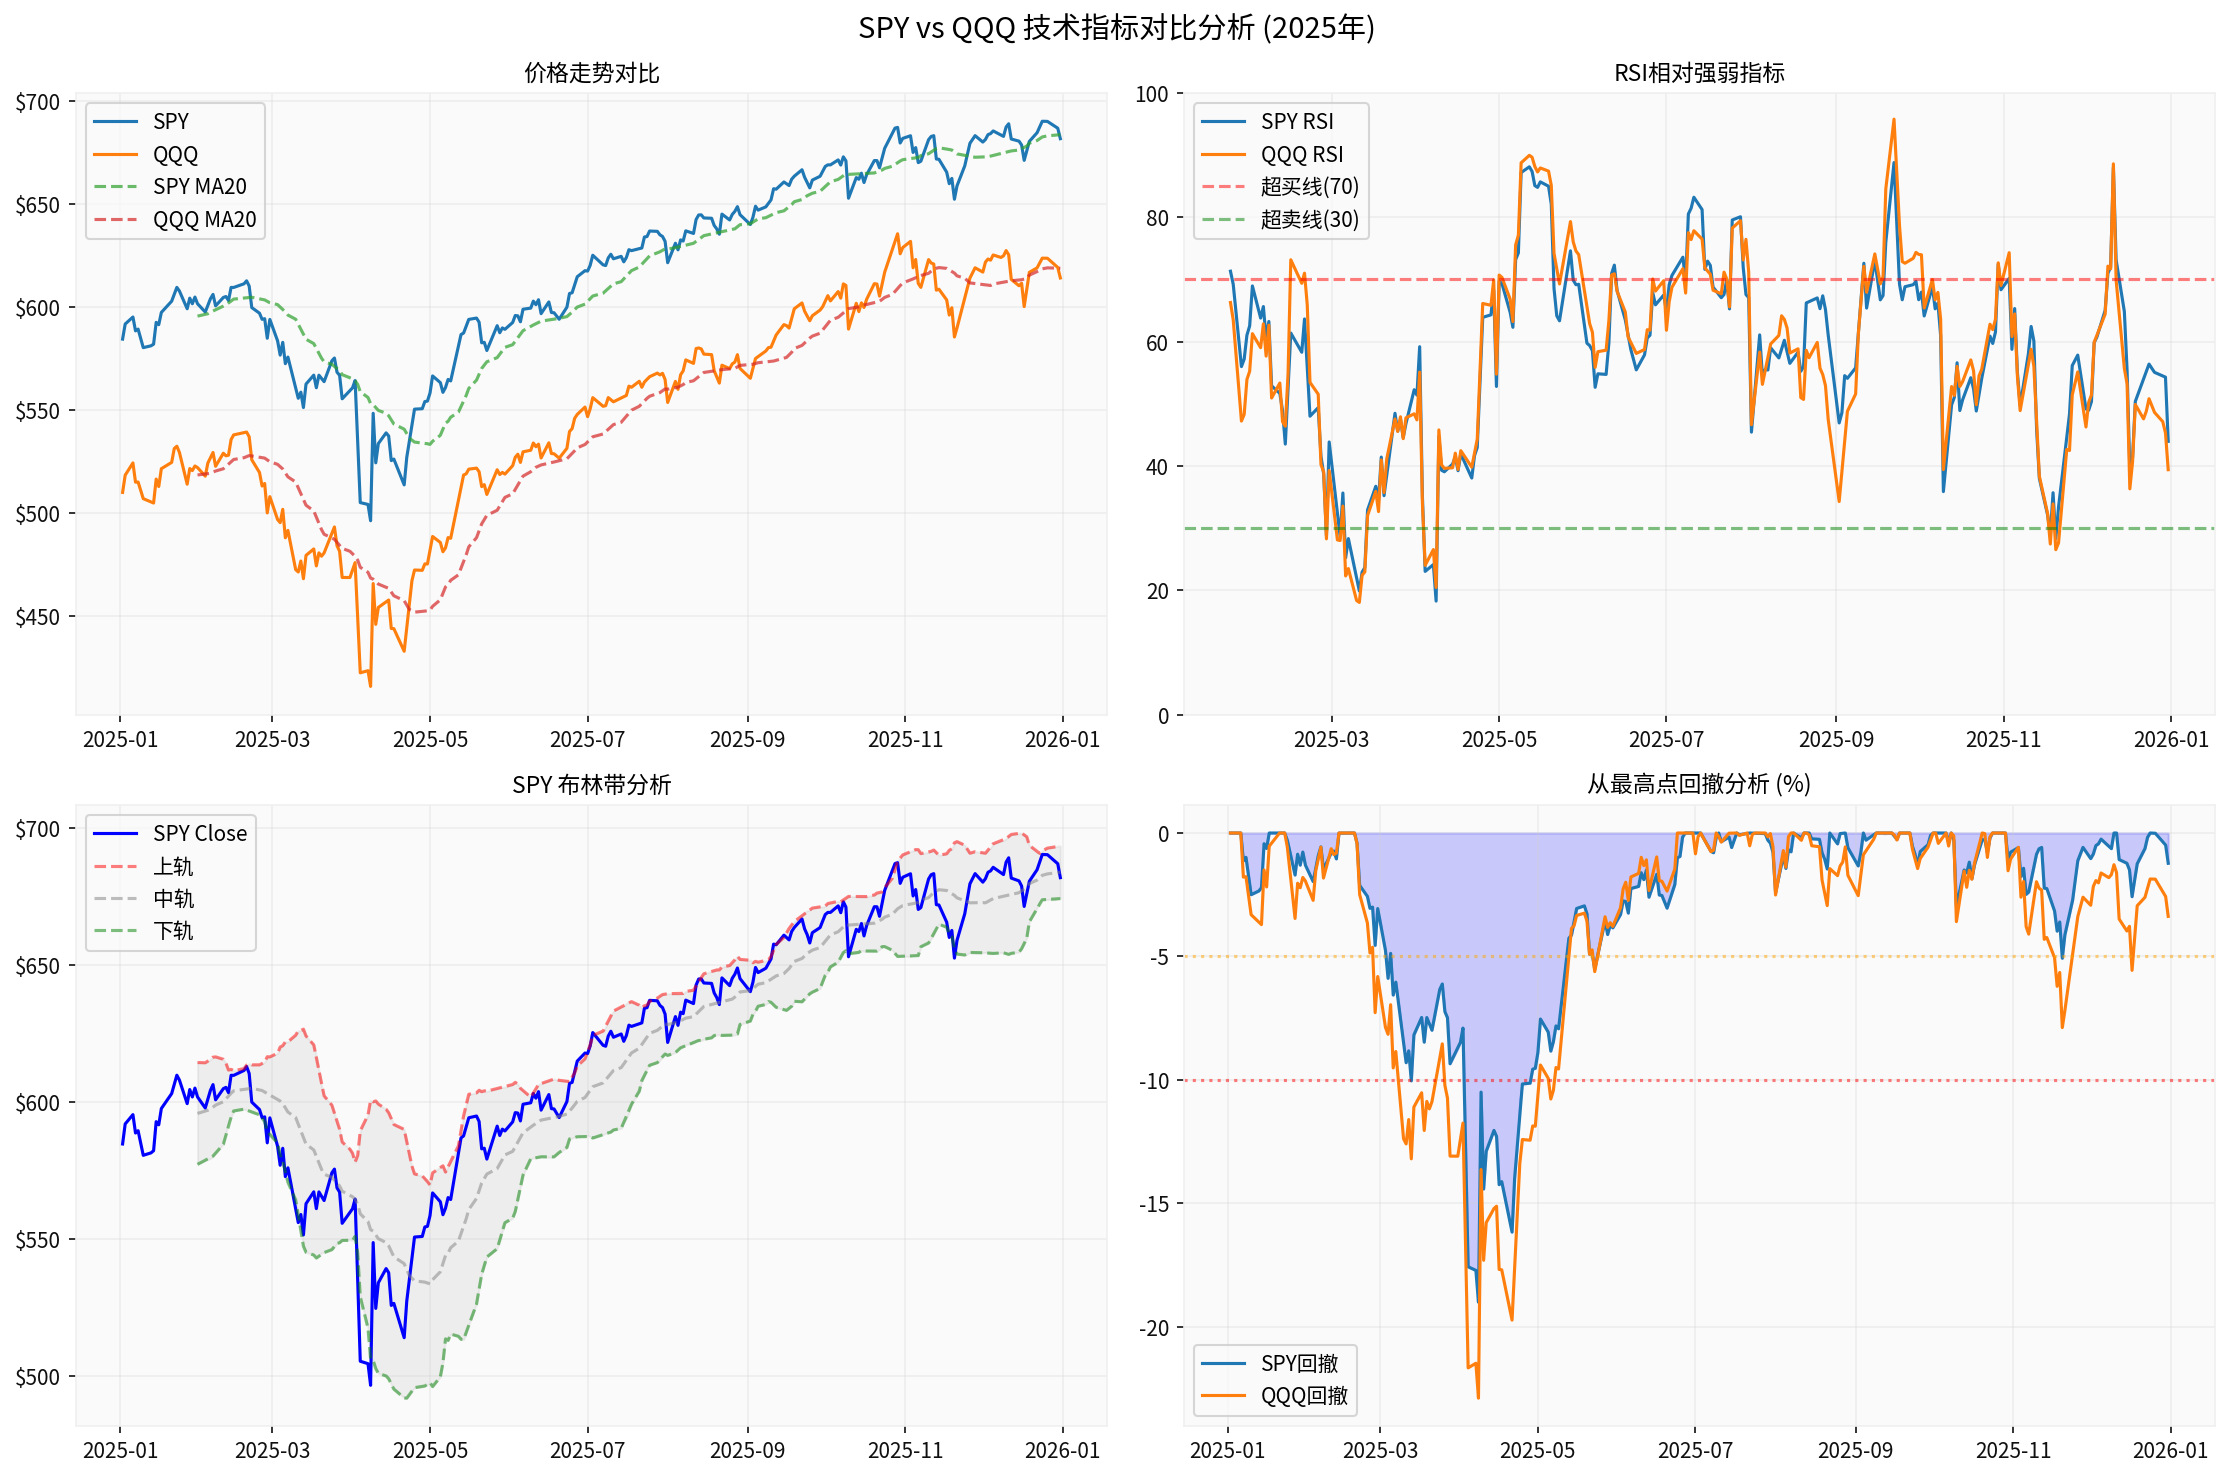
- RSI indicator remains in normal range: SPY’s RSI is 43.96, QQQ’s is 39.40, neither has entered the overbought zone above 70 [0]
- Price position: SPY is at 39.8% of the Bollinger Band (below the middle band), QQQ at 33.2%, indicating a recent pullback [0]
- Year-to-date performance: SPY is up 16.64% YTD, QQQ up 20.40% YTD; the gains are substantial but not extreme [0]
- Current VIX is 14.95, in the “extreme greed/complacency” range (usually VIX <15 falls into this category)
- VIX has plummeted 42.63% in the past 29 trading days, from 27.84 to 14.90 [0]
- This means the market is underpricing risk, and investors may be underestimating potential volatility
According to web search results, current US stock valuations are at historical highs [3]:
- Buffett Indicator(Wilshire 5000 / US GDP) is approximately221.4%, the highest level since 1970 [3]
- The S&P 500 has risen nearly 17% YTD, and the market is extremely optimistic about the profit potential of AI companies [3]
- The price-to-earnings ratio of the top 10 components of the S&P 500 is 26.4x, while the rest are 15.6x, both above historical averages [3]
- ✓ VIX is too low (14.95), obvious market complacency
- ✓ Price is close to historical highs (only -1.23% from the high)
- ✓ The proportion of up days in the second half of 2025 reached 56.2%, slightly higher than the historical average
- The maximum YTD drawdown is -19.00% (SPY) and -22.88% (QQQ)
- Currently only -1.23% from the YTD high, in a vulnerable phase
- Technical trends show SPY is in a “SIDEWAYS” (sideways consolidation) state, lacking a clear direction [0]
According to the latest sector performance data (2025-12-31) [0]:
- Leading sectors: Industrials (+2.34%), Financials (+2.23%), Cyclical Consumer (+1.78%)
- Lagging sectors: Utilities (-3.20%), Energy (-2.64%), Technology (-0.31%)
- Fed policy environment: As long as inflation remains moderate and yields do not get out of control, risk assets still have support [2]
- Economic resilience: Although US economic data is mixed, it is overall positive for stocks [1]
- Sustained AI theme: 2026 will be the “report card period” for AI, with S&P 500 EPS expected to grow by 12-15% [3]
- Overvaluation: Buffett Indicator at 221.4% is at an extreme historical high [3]
- Market complacency: VIX below15 indicates investors’ insufficient vigilance against risks [0]
- Crowded positions: HSBC strategists themselves admitted that “positions are approaching the overbought zone” [2]
- Historical pattern: After three consecutive years of strong stock market gains, the risk of correction in the fourth year increases
Based on the above analysis, I believe:
-
HSBC’s aggressive overweight strategy can still be maintained in the short term, but close attention needs to be paid to:
- Whether VIX rebounds above 20
- Whether the S&P500 breaks through 7000 points or falls below6800 points
- Whether inflation and yields rise unexpectedly
-
Risk management recommendations:
- Appropriately reduce US stock positions and increase defensive asset allocation
- Focus on sector rotation opportunities and overweight value sectors such as financials and industrials
- Consider using hedging tools like VIX to protect against downside risks
-
Key observation indicators:
- VIX rebounds above 20: May signal the return of volatility
- S&P500 is more than -5% from the high: Confirm trend reversal
- Technology sector continues to underperform: Signals market style shift
HSBC strategists’ strategy of near-maximum overweight on US stocks
It is recommended that investors gradually increase defensive allocations while maintaining exposure to US stocks, and closely monitor changes in the above risk indicators.
[1] 汇丰策略师:对美股接近最大程度超配 - 新浪财经 (https://finance.sina.com.cn/stock/usstock/c/2026-01-05/doc-inhfhici2050974.shtml)
[2] 股市风向标| 汇丰策略师对美股接近最大程度超配 - 搜狐 (https://m.sohu.com/a/972810340_122132398)
[3] 别只看Fed脸色!华尔街改押「川普帐户」美股千亿被动买盘正在路上 - Yahoo财经 (https://hk.finance.yahoo.com/news/)
[4] What to expect from stocks in 2026 - AOL.com (https://www.aol.com/finance/expect-stocks-2026-050200765.html)
[0] Gilin API Data
Insights are generated using AI models and historical data for informational purposes only. They do not constitute investment advice or recommendations. Past performance is not indicative of future results.
About us: Ginlix AI is the AI Investment Copilot powered by real data, bridging advanced AI with professional financial databases to provide verifiable, truth-based answers. Please use the chat box below to ask any financial question.