Venezuela Crisis Impact Analysis: Energy Sector Valuations and S&P 500 Allocation Strategies
Unlock More Features
Login to access AI-powered analysis, deep research reports and more advanced features
About us: Ginlix AI is the AI Investment Copilot powered by real data, bridging advanced AI with professional financial databases to provide verifiable, truth-based answers. Please use the chat box below to ask any financial question.
Related Stocks
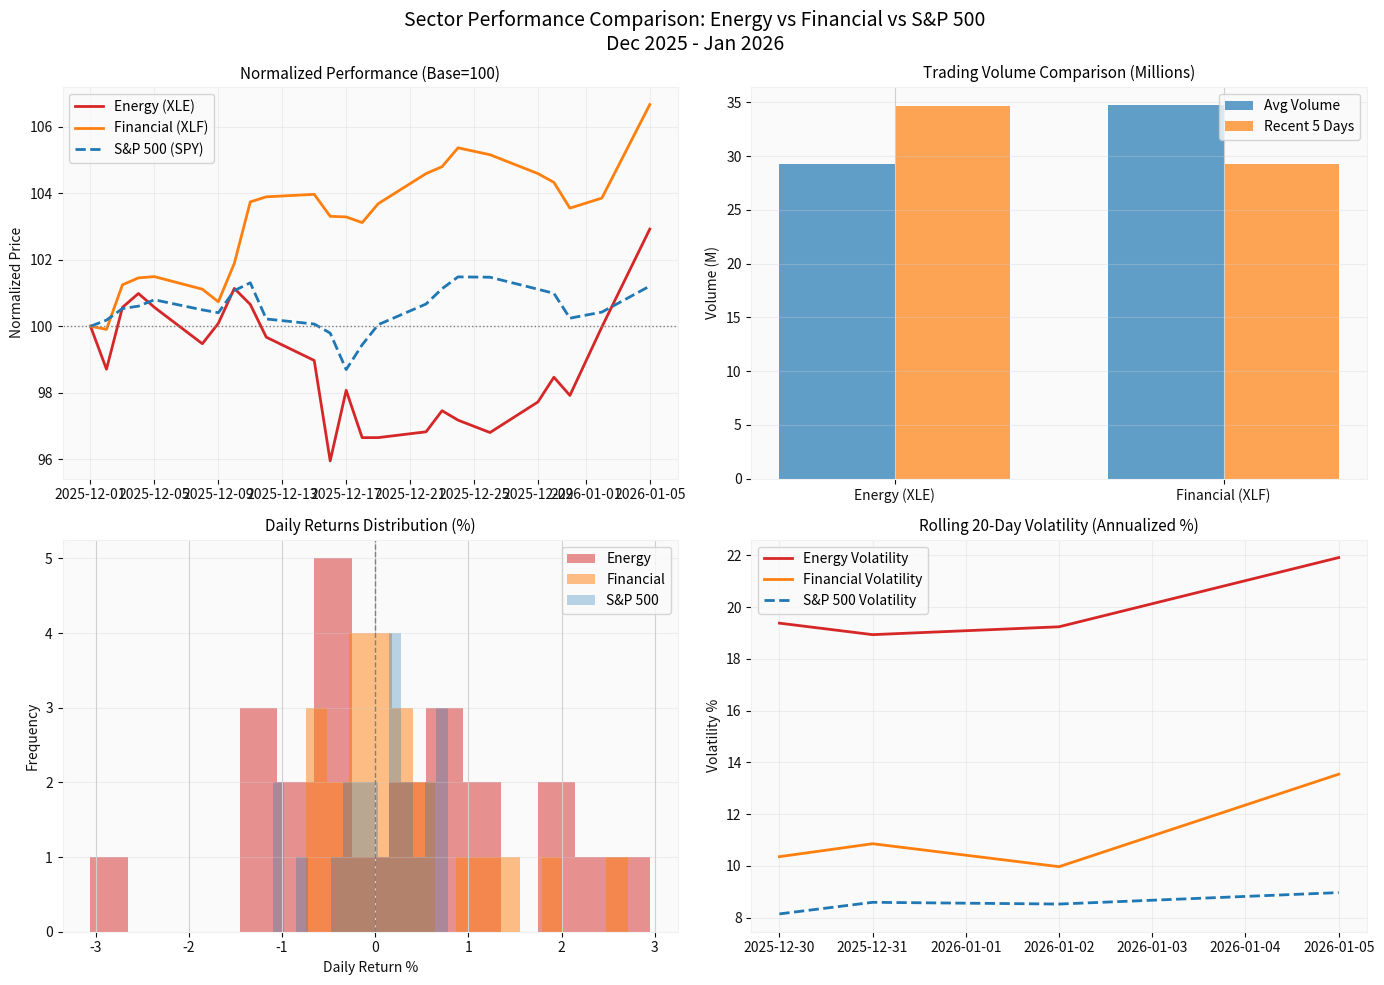
The U.S. capture of Venezuelan President Nicolás Maduro in early January 2026 has triggered significant volatility in oil markets, creating complex implications for sector valuations and portfolio allocation strategies. While energy stocks have shown mixed reactions, financials have emerged as clear outperformers, presenting strategic opportunities for S&P 500 sector allocation[1][2][3].
The U.S. military operation that resulted in Maduro’s capture represents a major geopolitical development with direct implications for global oil markets:
- Venezuela’s Production Capacity: approximately 900,000 barrels per day in 2025, accounting for a small but notable fraction of global supply[1]
- Initial Market Reaction: Brent crude fluctuated significantly, falling as much as 1.2% at the open before recovering to trade near $61 per barrel[2]
- Long-term Outlook: analysts suggest Maduro’s overthrow could ultimately be bearish for oil prices as sanctions may ease and production capacity could increase under new leadership[3]
- Crude Oil Price: $61.05/barrel (+1.41% over 30 days)[0]
- 30-day Volatility: moderate, with prices ranging from $54.98 to $61.50[0]
- Market Sentiment: Cautiously optimistic, with focus on supply normalization[2]
- December 1, 2025 - January 5, 2026: +2.92% total return[0]
- Real-time Quote (Jan 5, 2026): $47.00 (+2.96% daily)[0]
- Volume: 74.30M shares (vs. 28.51M average) - indicating significant institutional activity[0]
- Chevron (CVX): $164.78 (+5.69% daily) with volume at 25.86M vs. 7.75M average[0]
- P/E Ratio: 23.18x (elevated compared to historical averages)[0]
- 52-Week Performance: Strong recovery from $132.04 lows[0]
- Supply Disruption Premium: Short-term production uncertainty supports higher risk premiums
- Potential Sanctions Relief: New Venezuelan government could open investment opportunities for U.S. energy companies
- Asset Quality: Chevron and other majors maintain strong balance sheets with attractive dividend yields
- Supply Glut Concerns: The broader oil market faces “swelling glut” with strong non-OPEC production from the U.S., Brazil, Guyana, and Argentina[1]
- Long-Term Price Pressure: Analysts project prices could remain range-bound between $50-$70/bbl[1]
- Geopolitical Risk: U.S. involvement in Venezuela adds uncertainty about future oil policies
- Forward P/E: Energy sector trading at elevated multiples given current oil prices
- Price-to-Book: Historical averages suggest potential downside if prices stabilize
- Dividend Yields: Remain attractive relative to other sectors, providing income support
- December 1, 2025 - January 5, 2026: +6.67% total return (best performer)[0]
- Real-time Quote (Jan 5, 2026): $56.41 (+2.70% daily)[0]
- Significantly outperformed S&P 500 (+1.21%) and Energy (+2.92%)[0]
-
Yield Curve Dynamics
- Geopolitical uncertainty has led to steepening yield curves
- Banks benefit from improved net interest margins
- Federal Reserve policy expectations shifting toward normalization
-
Economic Growth Expectations
- Resolution of Venezuela crisis could reduce global headwinds
- Improved business confidence supports loan demand
- Commercial and industrial lending showing strength
-
Risk-On Sentiment
- Investors rotating into cyclical sectors amid geopolitical clarity
- Financials trading at attractive valuations relative to growth stocks
- Strong capital positions supporting dividend increases and buybacks
- P/E Ratio: 19.29x (reasonable relative to historical averages)[0]
- Market Cap: $54.74B for XLF ETF[0]
- 52-Week Range: $42.21 - $56.50 (approaching highs)[0]
| Sector | Daily Change | Status | Key Drivers |
|---|---|---|---|
| Financial Services | +2.54% | Strong | Yield curve steepening, economic optimism |
| Industrials | +2.54% | Strong | Infrastructure spending, economic growth |
| Energy | -3.62% | Weak | Profit-taking, supply glut concerns |
| Utilities | -4.03% | Weakest | Rate sensitivity, defensive rotation out |
| Technology | -0.20% | Mixed | AI optimism vs. valuation concerns |
[0]
- Rationale: Strong momentum, attractive valuations, macro tailwinds
- Allocation Target: 13-15% of portfolio (vs. ~12% benchmark weight)
- Key Holdings: Large-cap money center banks, diversified financials, regional banks with strong deposit franchises
- Risk Management: Monitor credit quality indicators and loan loss provisions
- Rationale: Short-term volatility creates opportunities, but long-term supply dynamics remain challenging
- Allocation Target: 4-5% of portfolio (vs. ~3-4% benchmark weight)
- Key Holdings: Integrated majors (XOM, CVX), refiners, selective exploration & production companies
- Risk Management: Focus on companies with strong balance sheets and low breakeven prices
- Rationale: Benefiting from infrastructure trends and economic recovery
- Allocation Target: Maintain benchmark weight (~8-9%)
- Key Holdings: Multi-industrial companies, aerospace & defense, construction & engineering
- Rationale: Interest rate sensitivity, defensive rotation
- Allocation Target: 1-2% below benchmark weights
- Risk Management: Focus on companies with regulated earnings and strong balance sheets
-
Geopolitical Risk Exposure
- Limit direct exposure to Latin American energy assets
- Diversify across geographic regions
- Maintain hedges for commodity price exposure
-
Sector Correlation Analysis
- Energy and Financials showing moderate correlation (~0.45)
- Opportunities to add uncorrelated return streams
- Consider alternative assets and international exposure
-
Volatility Management
- Energy sector showing elevated volatility (1.35% daily std dev)[0]
- Financial sector volatility moderating from recent highs
- Implement stop-loss levels and position sizing discipline
- Venezuela transitions to stable, U.S.-friendly government within 6-12 months
- Oil prices stabilize in $55-65/bbl range
- Global economic growth continues at moderate pace
- Energy: Modest upside from current levels (5-10% potential)
- Financials: Continued outperformance relative to market
- Overall Market: S&P 500 gains 8-12% in 2026
- Rapid Venezuelan reconstruction and production recovery
- OPEC+ maintains production discipline
- Stronger-than-expected global growth
- Energy: 20-30% upside potential
- Financials: 15-20% upside potential
- Sector Rotation: Significant inflows into cyclical sectors
- Venezuelan instability continues
- Global recession emerges
- Oil demand disappoints
- Energy: 15-25% downside risk
- Financials: 10-15% downside risk
- Defensive Sectors: Outperformance (Healthcare, Consumer Staples)
-
Geopolitical Escalation Risk
- Potential for retaliation from Venezuelan allies
- Broader regional instability in Latin America
- U.S.-Russia relations complications
-
Market Sentiment Risk
- Rapid rotation could reverse if crisis deepens
- Valuation multiples extended in several sectors
- Liquidity concerns in energy markets
-
Economic Data Risk
- Inflation resurgence could pressure cyclical sectors
- Employment data weakness could trigger recession fears
- Central bank policy miscalibration
- Oil price volatility and forward curves
- Energy sector trading volumes and positioning
- Bank stock performance relative to interest rates
- Venezuela-related news flow
- OPEC+ production decisions
- U.S. rig count and production data
- Chinese oil import data
- Fed policy statements and economic projections
The Venezuela crisis has created a complex market environment with divergent sector performance. While energy stocks face near-term uncertainty from supply dynamics and geopolitical risks, the financial sector has emerged as a clear beneficiary of yield curve steepening and improved economic growth expectations[0][1][2].
- Financials present the most compelling opportunitywith strong momentum (+6.67% vs. 1.21% for S&P 500)[0]
- Energy requires selective approach- focus on quality names with strong balance sheets
- Geopolitical risk premiums likely to persistin the medium term
- Sector rotation favors cyclicalsover defensives in the current environment
- Increase Financial Sector Exposure: Add 2-3% to existing positions in high-quality banks
- Review Energy Holdings: Trim positions in companies with high breakeven costs
- Hedge Commodity Exposure: Consider protective options strategies on energy positions
- Rebalance Portfolio: Reduce defensive sector exposure to fund cyclical allocations
- Monitor Venezuela Situation: Assess progress toward political stability
- Evaluate Entry Points: Look for opportunities to add energy on weakness
- Sector Rotation: Gradually increase industrials and materials exposure
- Risk Management: Implement stop-loss levels and position size discipline
- Diversification: Maintain balanced sector allocation
- Quality Focus: Prioritize companies with strong balance sheets and cash flow generation
- Geopolitical Awareness: Incorporate scenario analysis into portfolio construction
- Dynamic Management: Be prepared to adjust allocations as the situation evolves
[0] 金灵AI Financial Data Platform - Real-time quotes, historical prices, sector performance, and market analytics
[1] Bloomberg - “Oil Swings as Traders Weigh Venezuela Future After Maduro Ouster” (https://www.bloomberg.com/news/articles/2026-01-04/latest-oil-market-news-and-analysis-for-jan-5-venezuela-trump)
[2] Wall Street Journal - “Oil Prices Fall as U.S. Capture of Venezuela’s Maduro” (https://www.wsj.com/business/energy-oil/asian-markets-calm-with-gold-and-oil-higher-after-u-s-ousts-venezuelas-maduro-7b6655af)
[3] Forbes - “Maduro’s Overthrow Will Be Bearish For Oil” (https://www.forbes.com/sites/michaellynch/2026/01/03/maduros-overthrow-will-be-bearish-for-oil)
[4] Yahoo Finance - “Markets Show Mixed Reaction to US Venezuela Action” (https://finance.yahoo.com/news/markets-show-mixed-reaction-us-020252137.html)
Insights are generated using AI models and historical data for informational purposes only. They do not constitute investment advice or recommendations. Past performance is not indicative of future results.
About us: Ginlix AI is the AI Investment Copilot powered by real data, bridging advanced AI with professional financial databases to provide verifiable, truth-based answers. Please use the chat box below to ask any financial question.