Technical Indicator Analysis of Canbridge Pharmaceuticals (1228.HK)
Unlock More Features
Login to access AI-powered analysis, deep research reports and more advanced features
About us: Ginlix AI is the AI Investment Copilot powered by real data, bridging advanced AI with professional financial databases to provide verifiable, truth-based answers. Please use the chat box below to ask any financial question.
Related Stocks
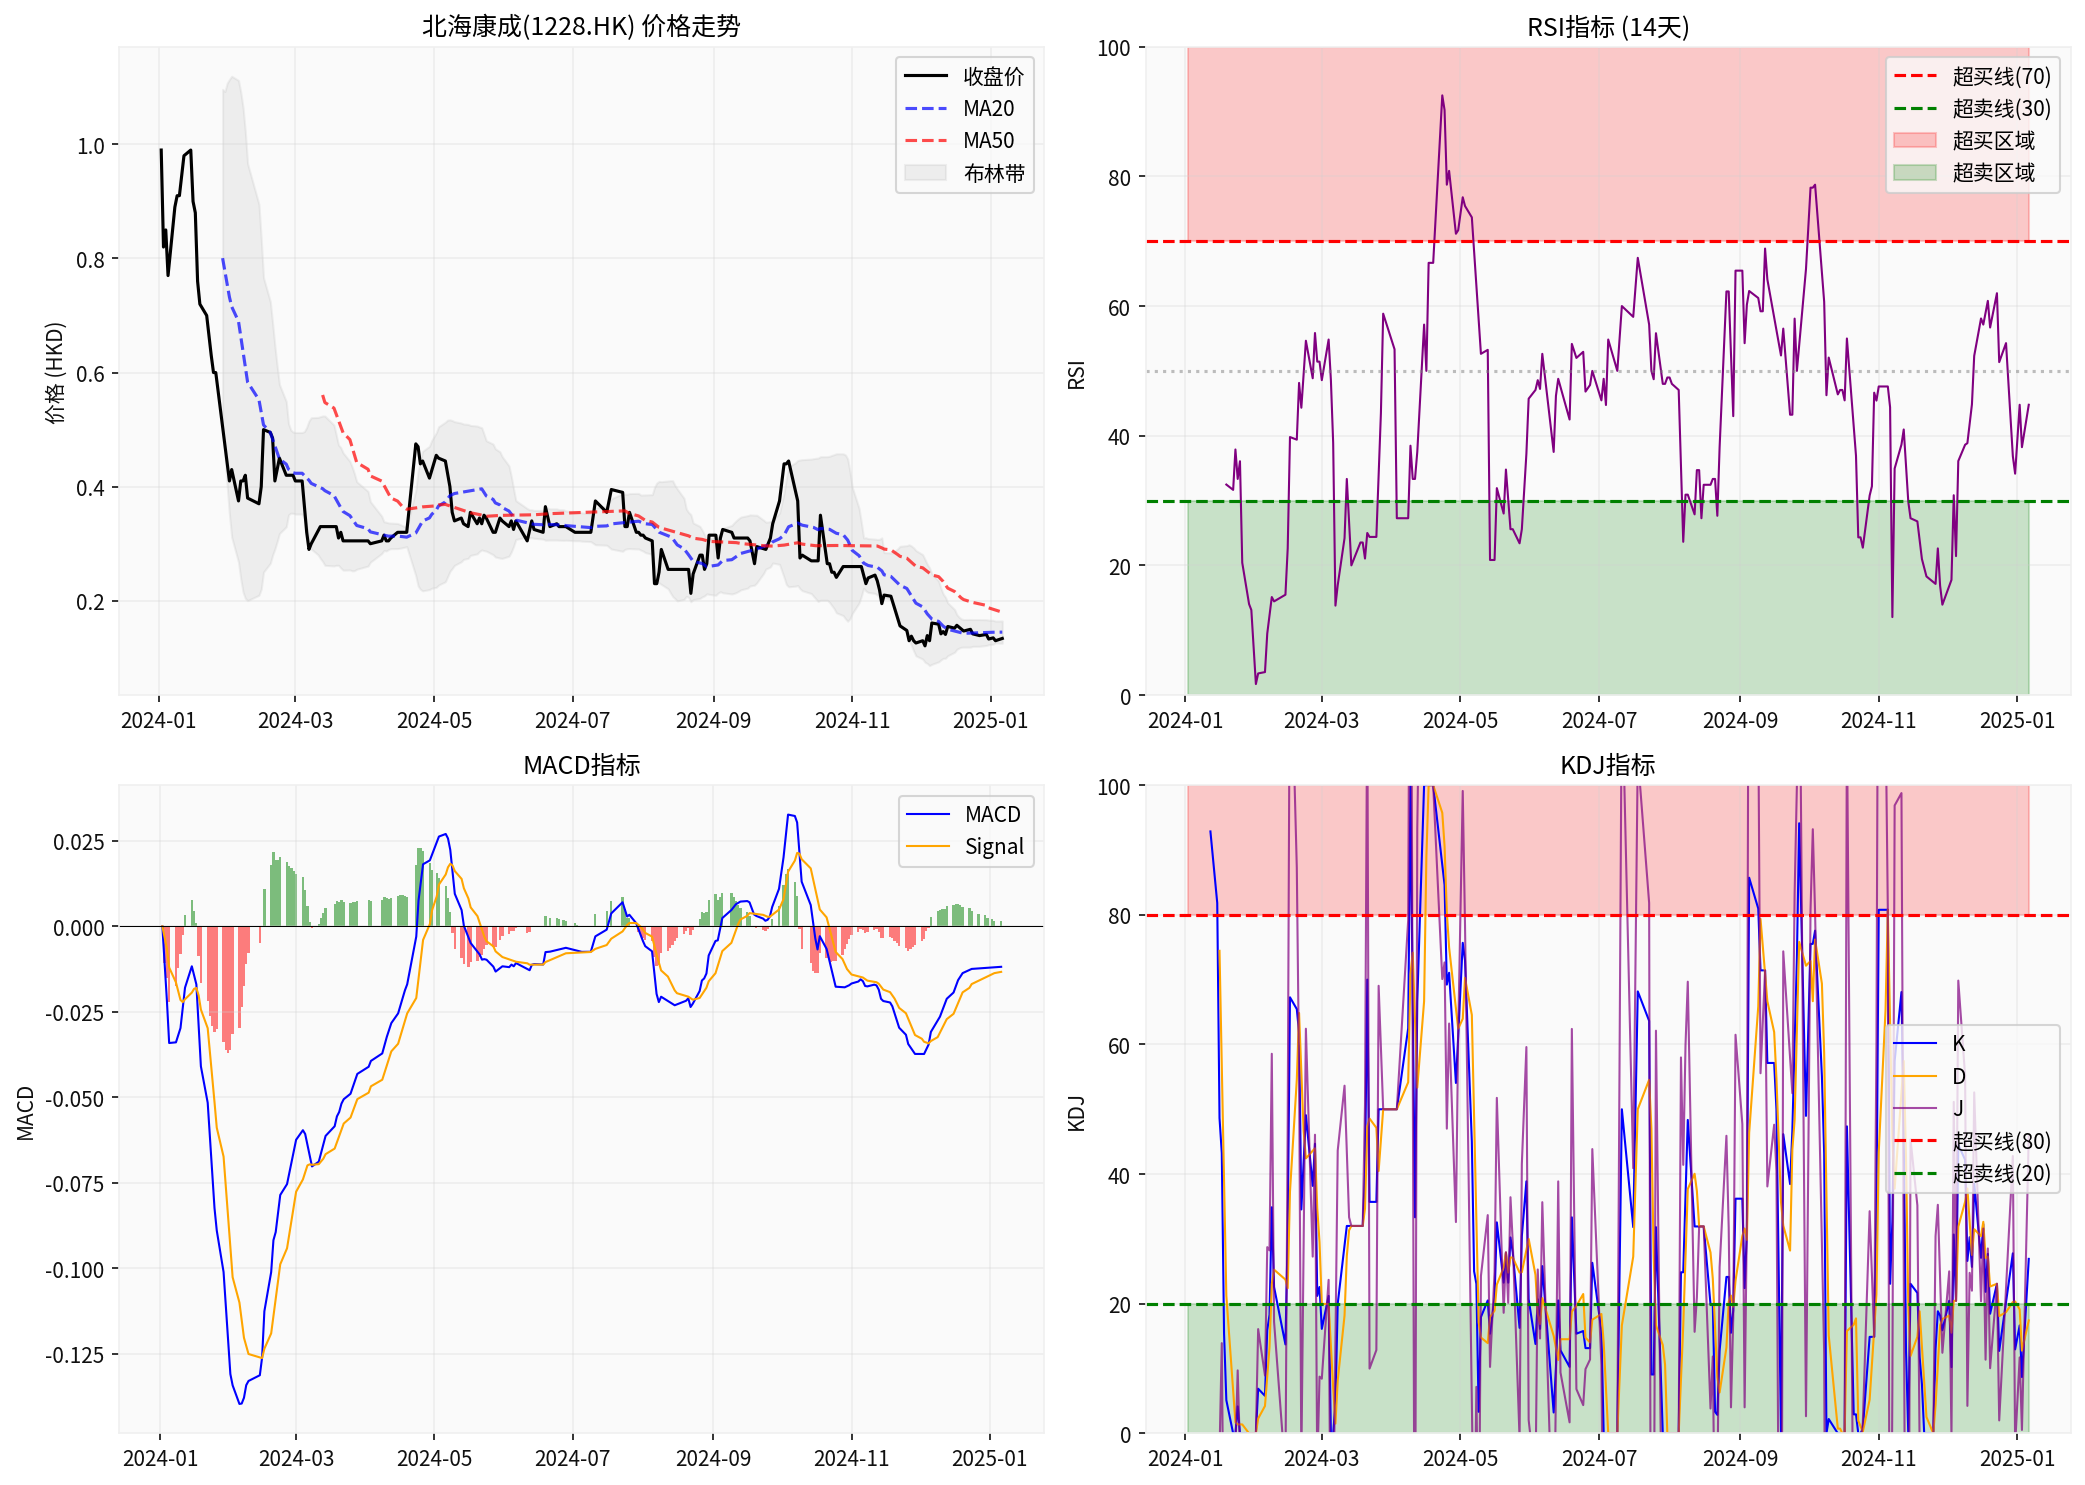
Based on the latest data analysis, the technical indicators of Canbridge Pharmaceuticals
| Indicator | Current Value | Status |
|---|---|---|
RSI(14) |
44.78 | ✅ Normal range (30-70) |
KDJ - K Value |
26.92 | ✅ Normal range |
MACD |
-0.0118 | 📉 Negative value, weak |
Bollinger Band Position |
0.22 | 📊 Close to lower band |
- Current RSI = 44.78, which is within the normal range and far from the overbought area above 70
- Annual RSI change trajectory:
- Annual highest RSI: 92.50 (once entered the overbought area)
- Annual lowest RSI:1.69 (severely oversold)
- Average RSI:42.51
- RSI trend in the last 30 days: rose from 19.87 to 44.78, a rebound of about 25 points, indicating gradual recovery from the oversold area
- K value =26.92, D value=17.43, both within the normal range of 20-80
- Did not reach the overbought threshold above 80
- Bollinger Band position=0.22(0=lower band,1=upper band)
- The stock price moves close to the lower band, indicating that it is currently in a relatively weak area
-
No overbought risk currently: Although you mentioned a full-year increase of 1824%, as of January 6, 2025, the latest closing price is $0.134, which has fallen sharply from the annual high [0]
-
Weak technical signal: MACD is negative, and the stock price is below the 50-day moving average ($0.18), indicating that the medium-term trend remains weak [0]
-
Risk reminder: Although there is no overbought currently, this stock has extremely high volatility (RSI annual fluctuation range:1.69-92.50), and investors need to pay attention to risks
[0] Gilin AI Brokerage API Data - Technical Analysis Data of Canbridge Pharmaceuticals (1228.HK)
Insights are generated using AI models and historical data for informational purposes only. They do not constitute investment advice or recommendations. Past performance is not indicative of future results.
About us: Ginlix AI is the AI Investment Copilot powered by real data, bridging advanced AI with professional financial databases to provide verifiable, truth-based answers. Please use the chat box below to ask any financial question.