Evaluation of the Sustainability of Hong Kong Tech Stock Rally and Investment Analysis of Kuaishou and Bilibili
Unlock More Features
Login to access AI-powered analysis, deep research reports and more advanced features
About us: Ginlix AI is the AI Investment Copilot powered by real data, bridging advanced AI with professional financial databases to provide verifiable, truth-based answers. Please use the chat box below to ask any financial question.
Related Stocks
Based on brokerage API data and professional analysis, we now provide you with an evaluation of the sustainability of the Hong Kong tech stock rally and an analysis of investment opportunities and risks for Kuaishou and Bilibili (using the unified closing price as of 2025-01-05: Kuaishou 1024.HK closed at $40.80, Bilibili 9626.HK closed at $134.40).
According to the latest market data:
- Hang Seng Index (^HSI): In the past 30 trading days (2025-11-21 to 2026-01-05), it rose from $25,460.42 to $26,347.25, with an increase of +3.48% [0]
- Volatility (daily return standard deviation):1.01%
- Technical Pattern: The index runs above the 20-day moving average ($25,749.57), indicating a short-term bullish structure, but there is resistance near $26,445.50 [0]
- Leading Sectors: Utilities (+2.08%), Energy (+1.99%), Basic Materials (+0.68%) [0]
- Tech-related: Communication Services (-1.67%), Tech Sector (-1.02%), relatively weak performance [0]
- Note: Although the index is up overall, the tech sector performed under pressure intraday, but some individual stocks (such as Kuaishou and Bilibili) have recently shown rebound signals.
According to web search and brokerage API data:
- From 2024 to early 2025, southbound funds’ net inflow into Hong Kong stocks increased significantly, with a clear rebound in net inflow in 2024 and 2025 [1]
- A relatively high single-day net purchase occurred in mid-December 2024, and the cumulative net inflow in January 2025 was large, indicating that mainland funds’ willingness to allocate to Hong Kong stocks has increased [1]
- Key Allocation Directions: New economy sectors (internet, consumer tech, platform economy, etc.) [1]
Southbound funds tend to:
- Companies with relatively reasonable valuation and improving profitability
- New economy leaders with long-term growth potential
- Platform enterprises benefiting from domestic policy support
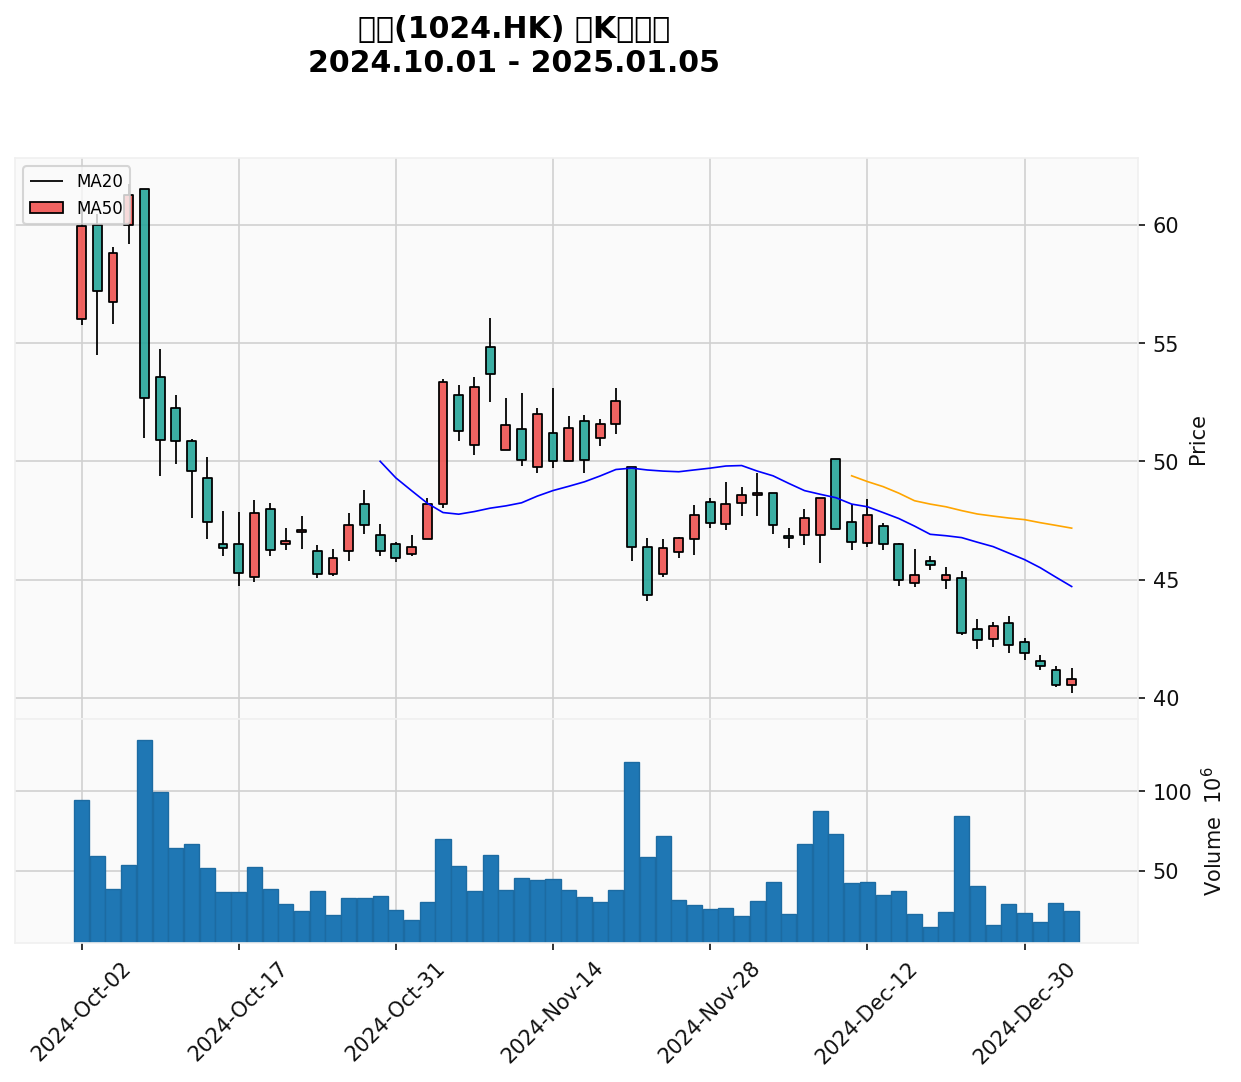
- Current Price: $40.80 (2025-01-05 close) [0]
- 52-week Range: $38.15 - $92.60 [0]
- Market Cap: $314.64B [0]
- P/E (TTM):18.00x [0]
- Intraday Gain (intraday): +11.09% [0] (Note: This is intraday performance; the closing price of $40.80 does not reflect this gain)
- Annual and Periodic Performance: Year-to-date +11.09%;52-week +82.63%;3-month -17.02% [0]
- Trading Volume:135.10M vs average30.12M, significantly higher [0]
- ROE:25.40% (significantly better than most internet content targets) [0]
- Net Profit Margin:12.53% [0]
- Cash Flow Status: Financial analysis shows “medium risk” [0]
- Latest Quarter (Q3 FY2025): EPS $1.11 vs expected $1.20 (miss -7.50%); Revenue $42.46B vs expected $38.55B (beat +10.12%) [0]
- RSI (14): Approximately 23.64 (in oversold zone) [0]
- MACD: Approximately -1.99 (bearish), histogram approximately -0.35 [0]
- Moving Average: MA20 $44.71, MA50 $47.18, current price is below both moving averages, indicating it is still in the recovery process [0]
- Professional Technical Conclusion: Overall sideways/no clear trend, trading range roughly references [$39.98, $44.71] [0]
- Opportunities: Relatively reasonable valuation (~18x P/E), excellent ROE, continuous optimization of content ecology; strong recovery momentum after oversold
- Risks: Short-term technical weakness (below moving average, negative MACD), need to break MA20/MA50 to confirm trend reversal to bullish; sustainability of profitability is related to macro consumption recovery rhythm
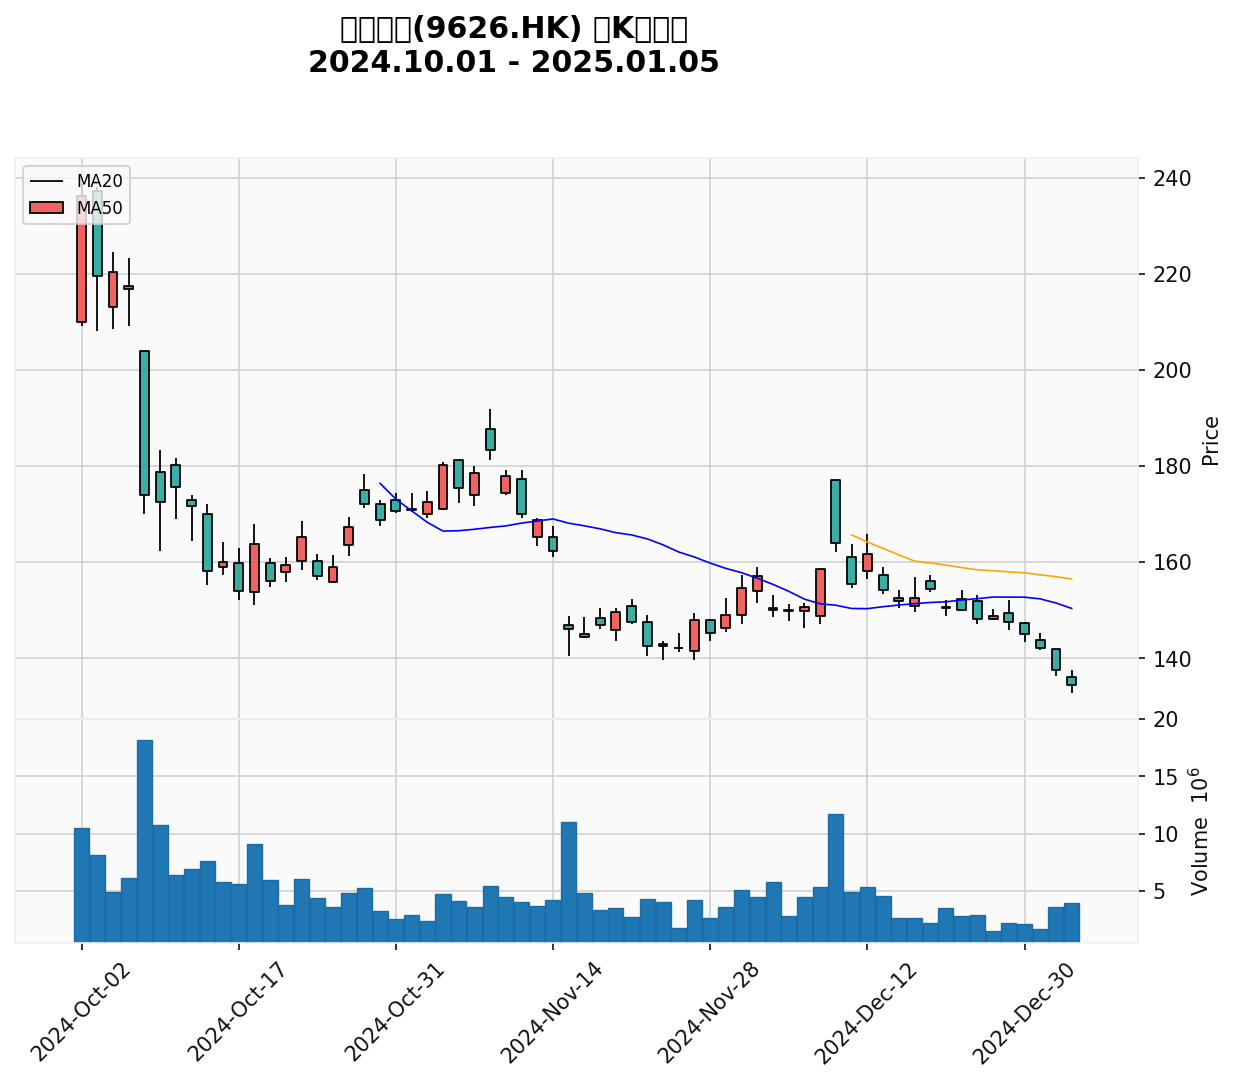
- Current Price: $134.40 (2025-01-05 close) [0]
-52-week Range: $113.60 - $249.60 [0] - Market Cap: $87.77B [0]
- P/E (TTM):104.90x (high valuation) [0]
- Intraday Gain (intraday): +5.06% [0] (Note: This is intraday performance; the closing price of $134.40 does not reflect this gain)
- Annual and Periodic Performance: Year-to-date +5.06%;52-week +57.86%;3-month -7.25% [0]
- Trading Volume:6.03M vs average4.41M, moderately higher [0]
- ROE:5.35% (low, insufficient profit elasticity) [0]
- Net Profit Margin:2.59% [0]
- Cash Flow Status: Financial analysis shows “low risk” [0]
- Latest Quarter (Q3 FY2025): EPS $1.13 vs expected $1.60 (miss -29.38%); Revenue $8.40B vs expected $8.34B (slight beat +0.66%) [0]
- Analyst Rating:50% Buy/50% Hold, consensus is “Buy” [0]
- RSI (14): Approximately23.48 (in oversold zone) [0]
- MACD: Approximately-5.04 (bearish), histogram approximately-1.27 [0]
- Moving Average: MA20 $150.34, MA50 $156.46, current price is below both moving averages, indicating recovery pressure [0]
- Professional Technical Conclusion: In a downward trend (to be confirmed), if it fails to recover the resistance near $177.10, the next target is $126.03, with support at $132.70 [0]
- Opportunities: Strong user stickiness and community moat, still room for medium-to-long-term content monetization and commercialization; repair trading opportunities exist in oversold zone
- Risks: High valuation (~105x P/E) requires higher profits; weak profitability needs to be verified by financial reports; technical pressure, need to break through key moving averages with volume to confirm trend reversal
| Indicator | Kuaishou (1024.HK) | Bilibili (9626.HK) |
|---|---|---|
| Current Price (2025-01-05 Close) | $40.80 | $134.40 |
| Market Cap | $314.64B | $87.77B |
| P/E (TTM) | 18.00x | 104.90x |
| ROE | 25.40% | 5.35% |
| Technical Signal (Daily Line) | Oversold zone, below moving average, short-term bearish | Oversold zone, downward trend, below moving average |
| Earnings Expectation (Latest Quarter) | EPS miss, revenue beat | Significant EPS miss, slight revenue beat |
| Risk Level (Financial Analysis) | Medium risk | Low risk |
- Continuous inflow of southbound funds, preference for new economy sectors [1]
- Valuation attractiveness emerges: Kuaishou’s P/E ~18x, lower than most comparable platform stocks
- Repair demand after oversold: Both stocks have RSI around 23.6, in oversold zone, there is a technical rebound window
- Stable policy environment: Platform economy and content supervision framework are gradually clear
- Uncertainty about the Federal Reserve’s interest rate path still exists, affecting Hong Kong stock valuation
- Profit improvement of some targets still needs verification (Bilibili’s EPS missed significantly)
- Technical aspects have not entered a strong bullish structure (prices are still below MA20/MA50)
- Sector divergence: Tech sector’s intraday performance lags behind the index
The rebound structure is more inclined to “repair and divergence”:
- Short-term (1-3 months): Oversold repair may continue, but the intensity depends on profit verification and fund cooperation; Kuaishou has more repair elasticity due to valuation and profit quality
- Medium-term (3-12 months): Targets with improving profitability, reasonable valuation, and stable cash flow are more favored by funds, and the rebound continuity is stronger
- Kuaishou (1024.HK): Medium risk, reasonable valuation, high profit quality. Suitable for investors who are optimistic about platform economy repair and user monetization efficiency improvement. It is recommended to pay attention to MA20/MA50 breakthrough and profit sustainability.
- Bilibili (9626.HK): Low financial risk, but high valuation and weak profitability. It is recommended to pay attention to commercialization acceleration and profit inflection point verification; technically, it needs to stand above MA20 before increasing position weight.
- Conservative: Focus on buying points after breaking MA20 and pulling back without breaking, combined with financial reports to confirm profit improvement
- Aggressive: Can layout repair opportunities in batches in the oversold zone, but need strict stop loss, and increase positions after breaking through important moving averages with volume
- Macro: Interest rate path, geopolitics, regulatory policies
- Industry: Increased competition, commercialization progress not meeting expectations
- Technical: Currently below moving average, short-term repair strength and continuity need volume cooperation
The Hong Kong tech stock rally is expected to continue, but divergence will increase: valuation and profit quality are key screening dimensions. Kuaishou becomes a more attractive repair target with reasonable valuation and excellent ROE; Bilibili has high ecological barriers but high valuation and unproven profitability, more suitable for waiting for profit inflection point and technical strength signal.
[0] Gilin API Data (stock price, financial indicators, technical analysis, market index, southbound funds and charts)
[1] Web search and public market data (southbound fund inflow and Hong Kong market liquidity)
Insights are generated using AI models and historical data for informational purposes only. They do not constitute investment advice or recommendations. Past performance is not indicative of future results.
About us: Ginlix AI is the AI Investment Copilot powered by real data, bridging advanced AI with professional financial databases to provide verifiable, truth-based answers. Please use the chat box below to ask any financial question.