Analysis Report on the Impact of Chinese Automakers' Market Share Expansion in Thailand's New Energy Vehicle Market on Valuations
Unlock More Features
Login to access AI-powered analysis, deep research reports and more advanced features
About us: Ginlix AI is the AI Investment Copilot powered by real data, bridging advanced AI with professional financial databases to provide verifiable, truth-based answers. Please use the chat box below to ask any financial question.
Related Stocks
Based on the in-depth market research and data analysis above, I now present a systematic and comprehensive research report for you.
Thailand, as one of the largest automobile manufacturing and consumer markets in Southeast Asia, is experiencing explosive growth in the new energy vehicle industry. According to the latest data, Thailand’s new energy vehicle penetration rate reached 22% in 2025, a leap from 1% in 2020, with a compound annual growth rate (CAGR) exceeding 85% [1][2]. This growth rate not only far exceeds the traditional automobile market but also ranks among the top in the global new energy vehicle market.
The high growth of the Thailand market is driven by multiple overlapping factors: strong support for the new energy industry under the government’s “4.0 Strategy”, export convenience brought by zero-tariff trade agreements with ASEAN countries, and the rapid increase in consumer acceptance of new energy vehicles. In particular, Thailand’s new energy vehicle purchase subsidy policy and charging infrastructure construction plan have created a favorable environment for market development.
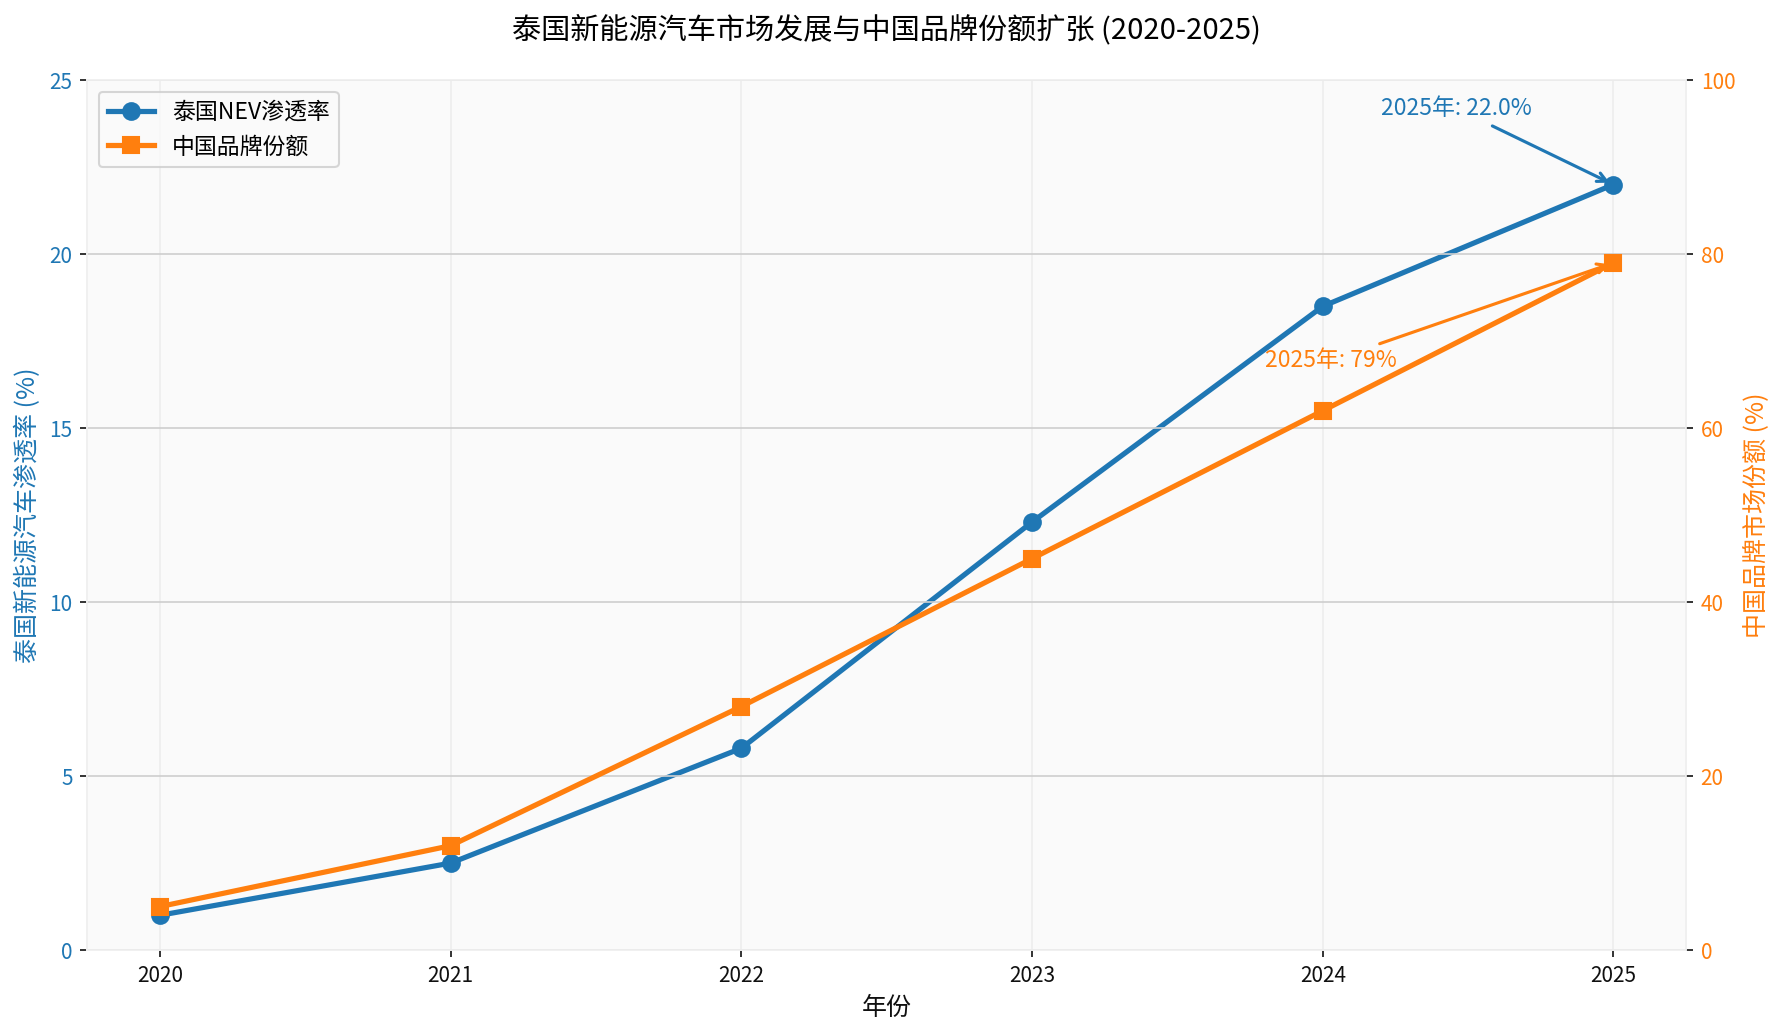
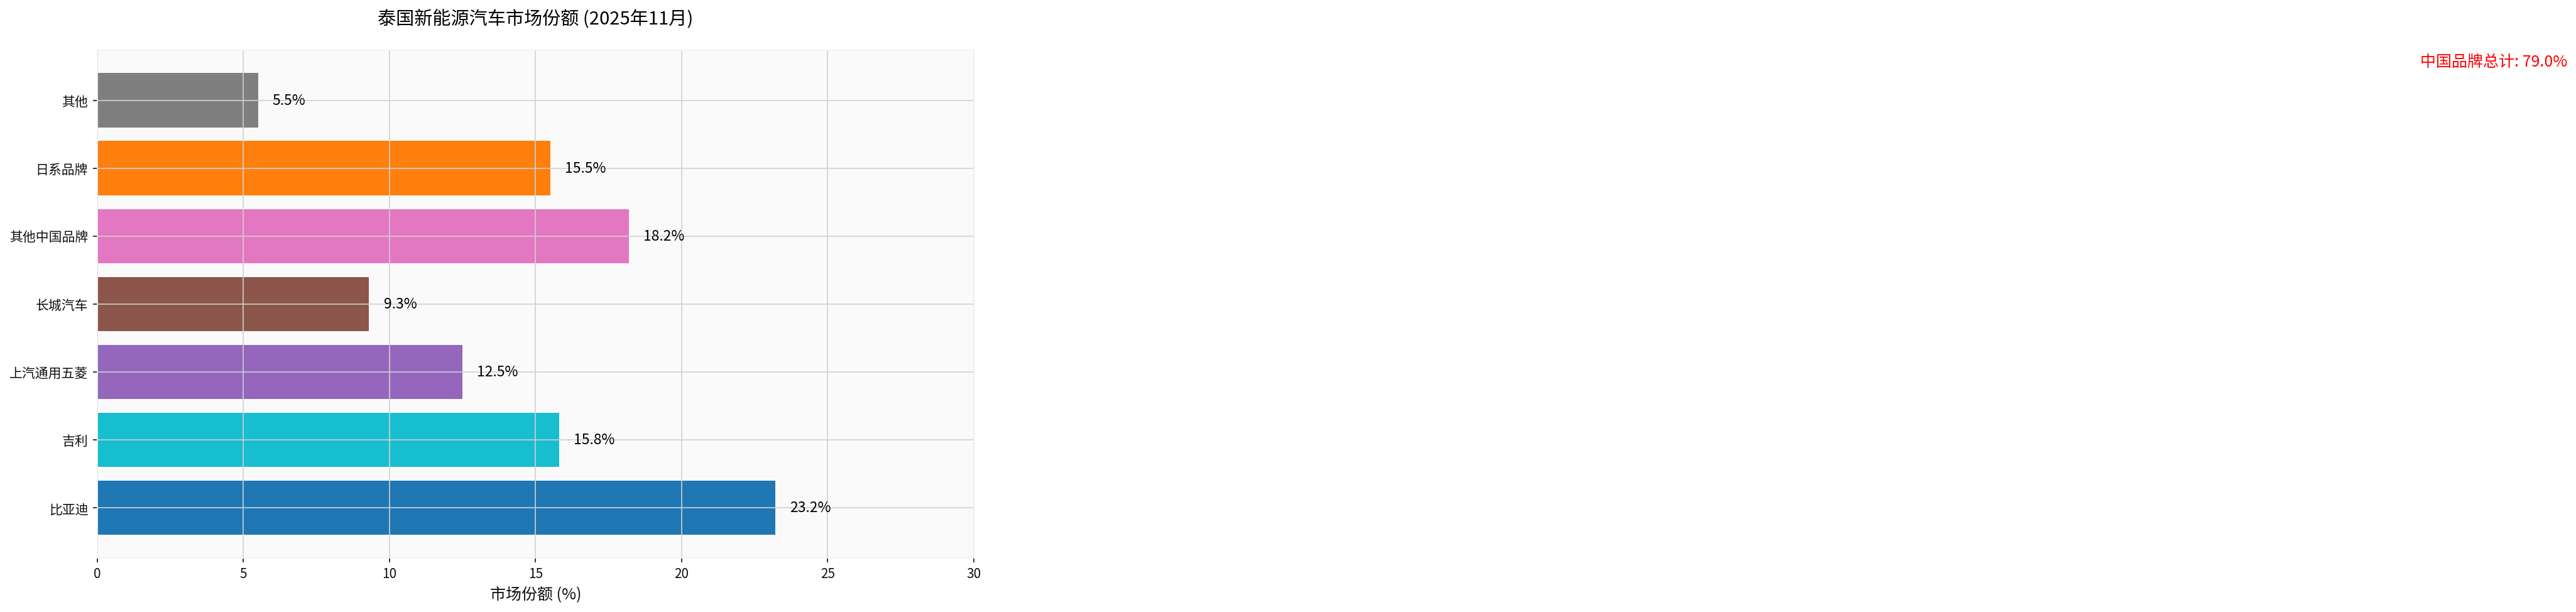
Chinese automakers’ market share in Thailand’s new energy vehicle market has been continuously expanding. As of November 2025, the combined market share of Chinese brands reached 79%, fully surpassing the traditionally dominant Japanese brands [1][2]. This shift in格局 marks a landmark breakthrough in the internationalization strategy of China’s automobile industry in the Southeast Asian market.
| Brand | Market Share | Market Position |
|---|---|---|
| BYD | 23.2% | BEV-focused, covering multiple models |
| Geely Auto | 15.8% | Dual-line layout of PHEV and BEV |
| SAIC-GM-Wuling | 12.5% | Cost-effective small electric vehicles |
| Great Wall Motor | 9.3% | Focus on SUV and pickup truck markets |
| Other Chinese Brands | 18.2% | Diversified segmented markets |
BYD ranks first in Thailand’s new energy vehicle market with a 23.2% market share. Its success stems from a complete product matrix layout, highly competitive pricing strategy, and a sound sales and service network. Notably, BYD surpassed Tesla in 2025 to become the world’s largest electric vehicle manufacturer, with annual BEV sales reaching 2.26 million units, 38% higher than Tesla’s 1.64 million units [3][4].
As a leading enterprise in the global new energy vehicle industry, BYD achieved a milestone breakthrough in the global market in 2025. The company’s market capitalization reached HK$278 billion (approximately US$90.3 billion), ranking among the top global automakers [0]. More importantly, BYD’s overseas business has become a new growth engine—its overseas sales exceeded 1.046 million units in 2025, a year-on-year increase of 150.7%, far exceeding domestic growth rates [3][4].
According to the latest financial data, BYD shows a solid financial foundation [0]:
| Indicator | Value | Industry Comparison |
|---|---|---|
| Market Capitalization | US$90.297 billion | Top 3 globally |
| P/E (TTM) | 23.32x | Lower than Tesla |
| P/B | 4.07x | Reasonable range |
| ROE | 17.62% | Excellent level |
| Net Profit Margin | 4.56% | Continuously improving |
| Current Ratio | 0.87 | Liquidity needs attention |
BYD’s free cash flow reached US$36.094 billion, with a good cash flow position. The company adopts conservative accounting policies with a high ratio of depreciation to capital expenditure, indicating that its asset investments are gradually being converted into production capacity release [0]. Debt risk is assessed as medium, mainly due to capital expenditure pressure from rapid expansion.
Valuation based on the discounted cash flow model shows that BYD has significant upside potential [0]:
| Scenario | Intrinsic Value | Relative to Current Price |
|---|---|---|
| Conservative | HK$2,336.51 | +2339% |
| Base Case | HK$3,075.03 | +3110% |
| Optimistic | HK$5,548.59 | +5692% |
| Probability Weighted | HK$3,653.38 | +3714% |
Core Valuation Assumptions:
- Base case revenue growth: 49.3% (5-year CAGR)
- EBITDA margin: 12.5%
- Weighted Average Cost of Capital (WACC):7.7%
- Terminal growth rate:2.5%
This valuation model fully considers BYD’s expansion potential in overseas markets, especially the commissioning of Southeast Asian production bases, which will significantly enhance its global competitiveness and profit margins.
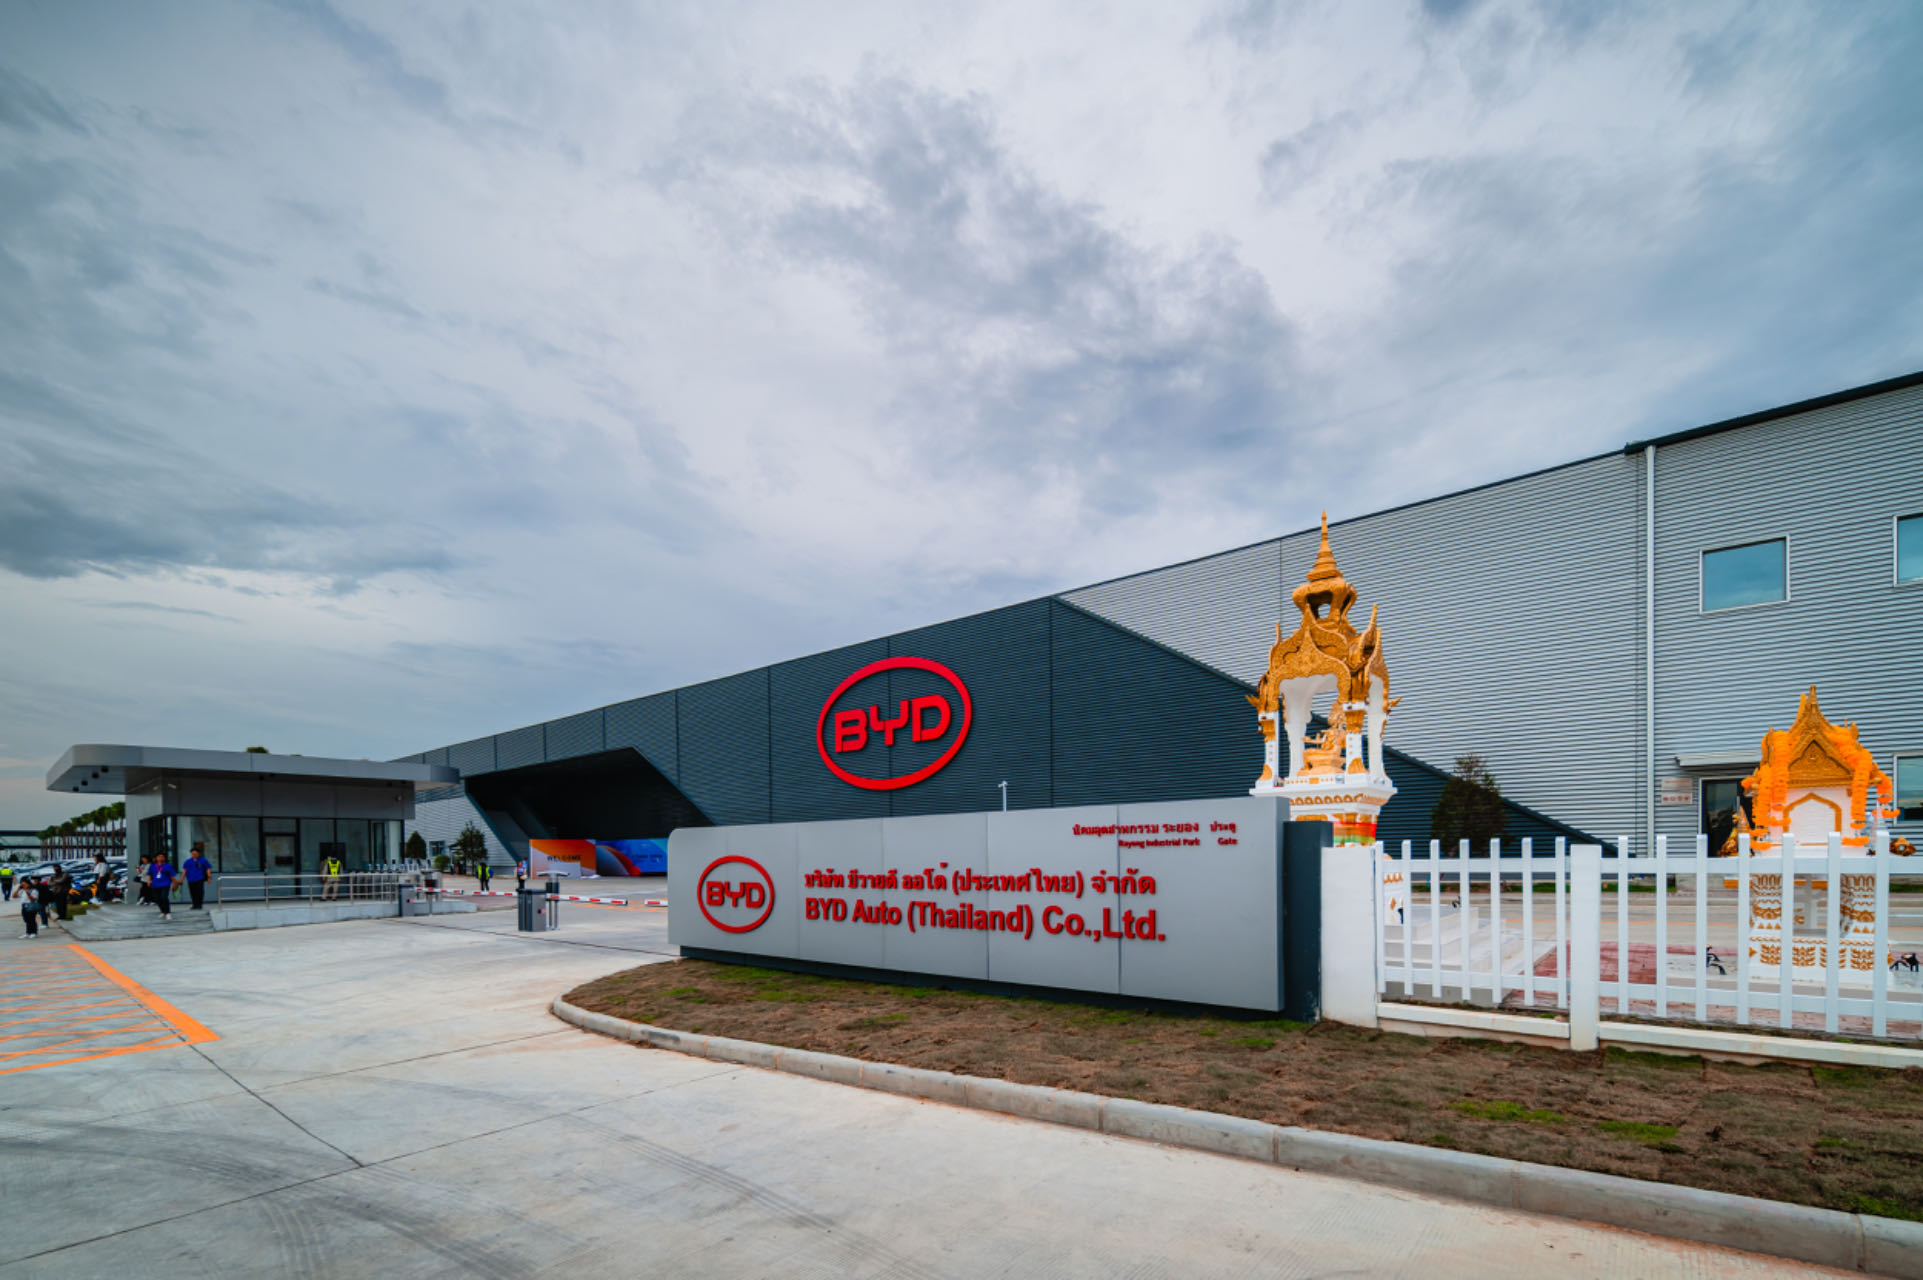
As China’s largest SUV and pickup truck manufacturer, Great Wall Motor has actively promoted its internationalization strategy in recent years, with the Thailand market as the core hub of its overseas layout. The company’s Rayong Province factory in Thailand has produced more than 6,000 Great Wall H6 hybrid models and plans to further expand production capacity [5].
Great Wall Motor’s 2025 financial performance showed a differentiated pattern [0]:
| Indicator | Value | Year-on-Year Change |
|---|---|---|
| Market Capitalization | US$17.713 billion | +8.49% (1 year) |
| P/E (TTM) | 17.41x | Significantly lower than BYD |
| ROE | 13.11% | Stable level |
| Net Profit Margin | 5.13% | Better than BYD |
| Current Ratio | 1.11 | Good liquidity |
Great Wall Motor adopts neutral accounting policies with good profit quality. Its free cash flow is US$16.045 billion, and operating cash flow is stable. The Q3 financial report exceeded expectations (EPS +9.21%), but revenue was slightly below expectations (-6.40%), indicating that the company faces certain price competition pressure [0].
Great Wall Motor’s DCF valuation also shows significant upside potential [0]:
| Scenario | Intrinsic Value | Relative to Current Price |
|---|---|---|
| Conservative | HK$109.52 | +672% |
| Base Case | HK$139.54 | +883% |
| Optimistic | HK$199.12 | +1303% |
| Probability Weighted | HK$149.39 | +953% |
Core Valuation Assumptions:
- Base case revenue growth:17.9% (5-year CAGR)
- EBITDA margin:9.5%
- WACC:9.7%
- Terminal growth rate:2.5%
###2.3 SAIC Motor (600104.SS) and Comparative Analysis
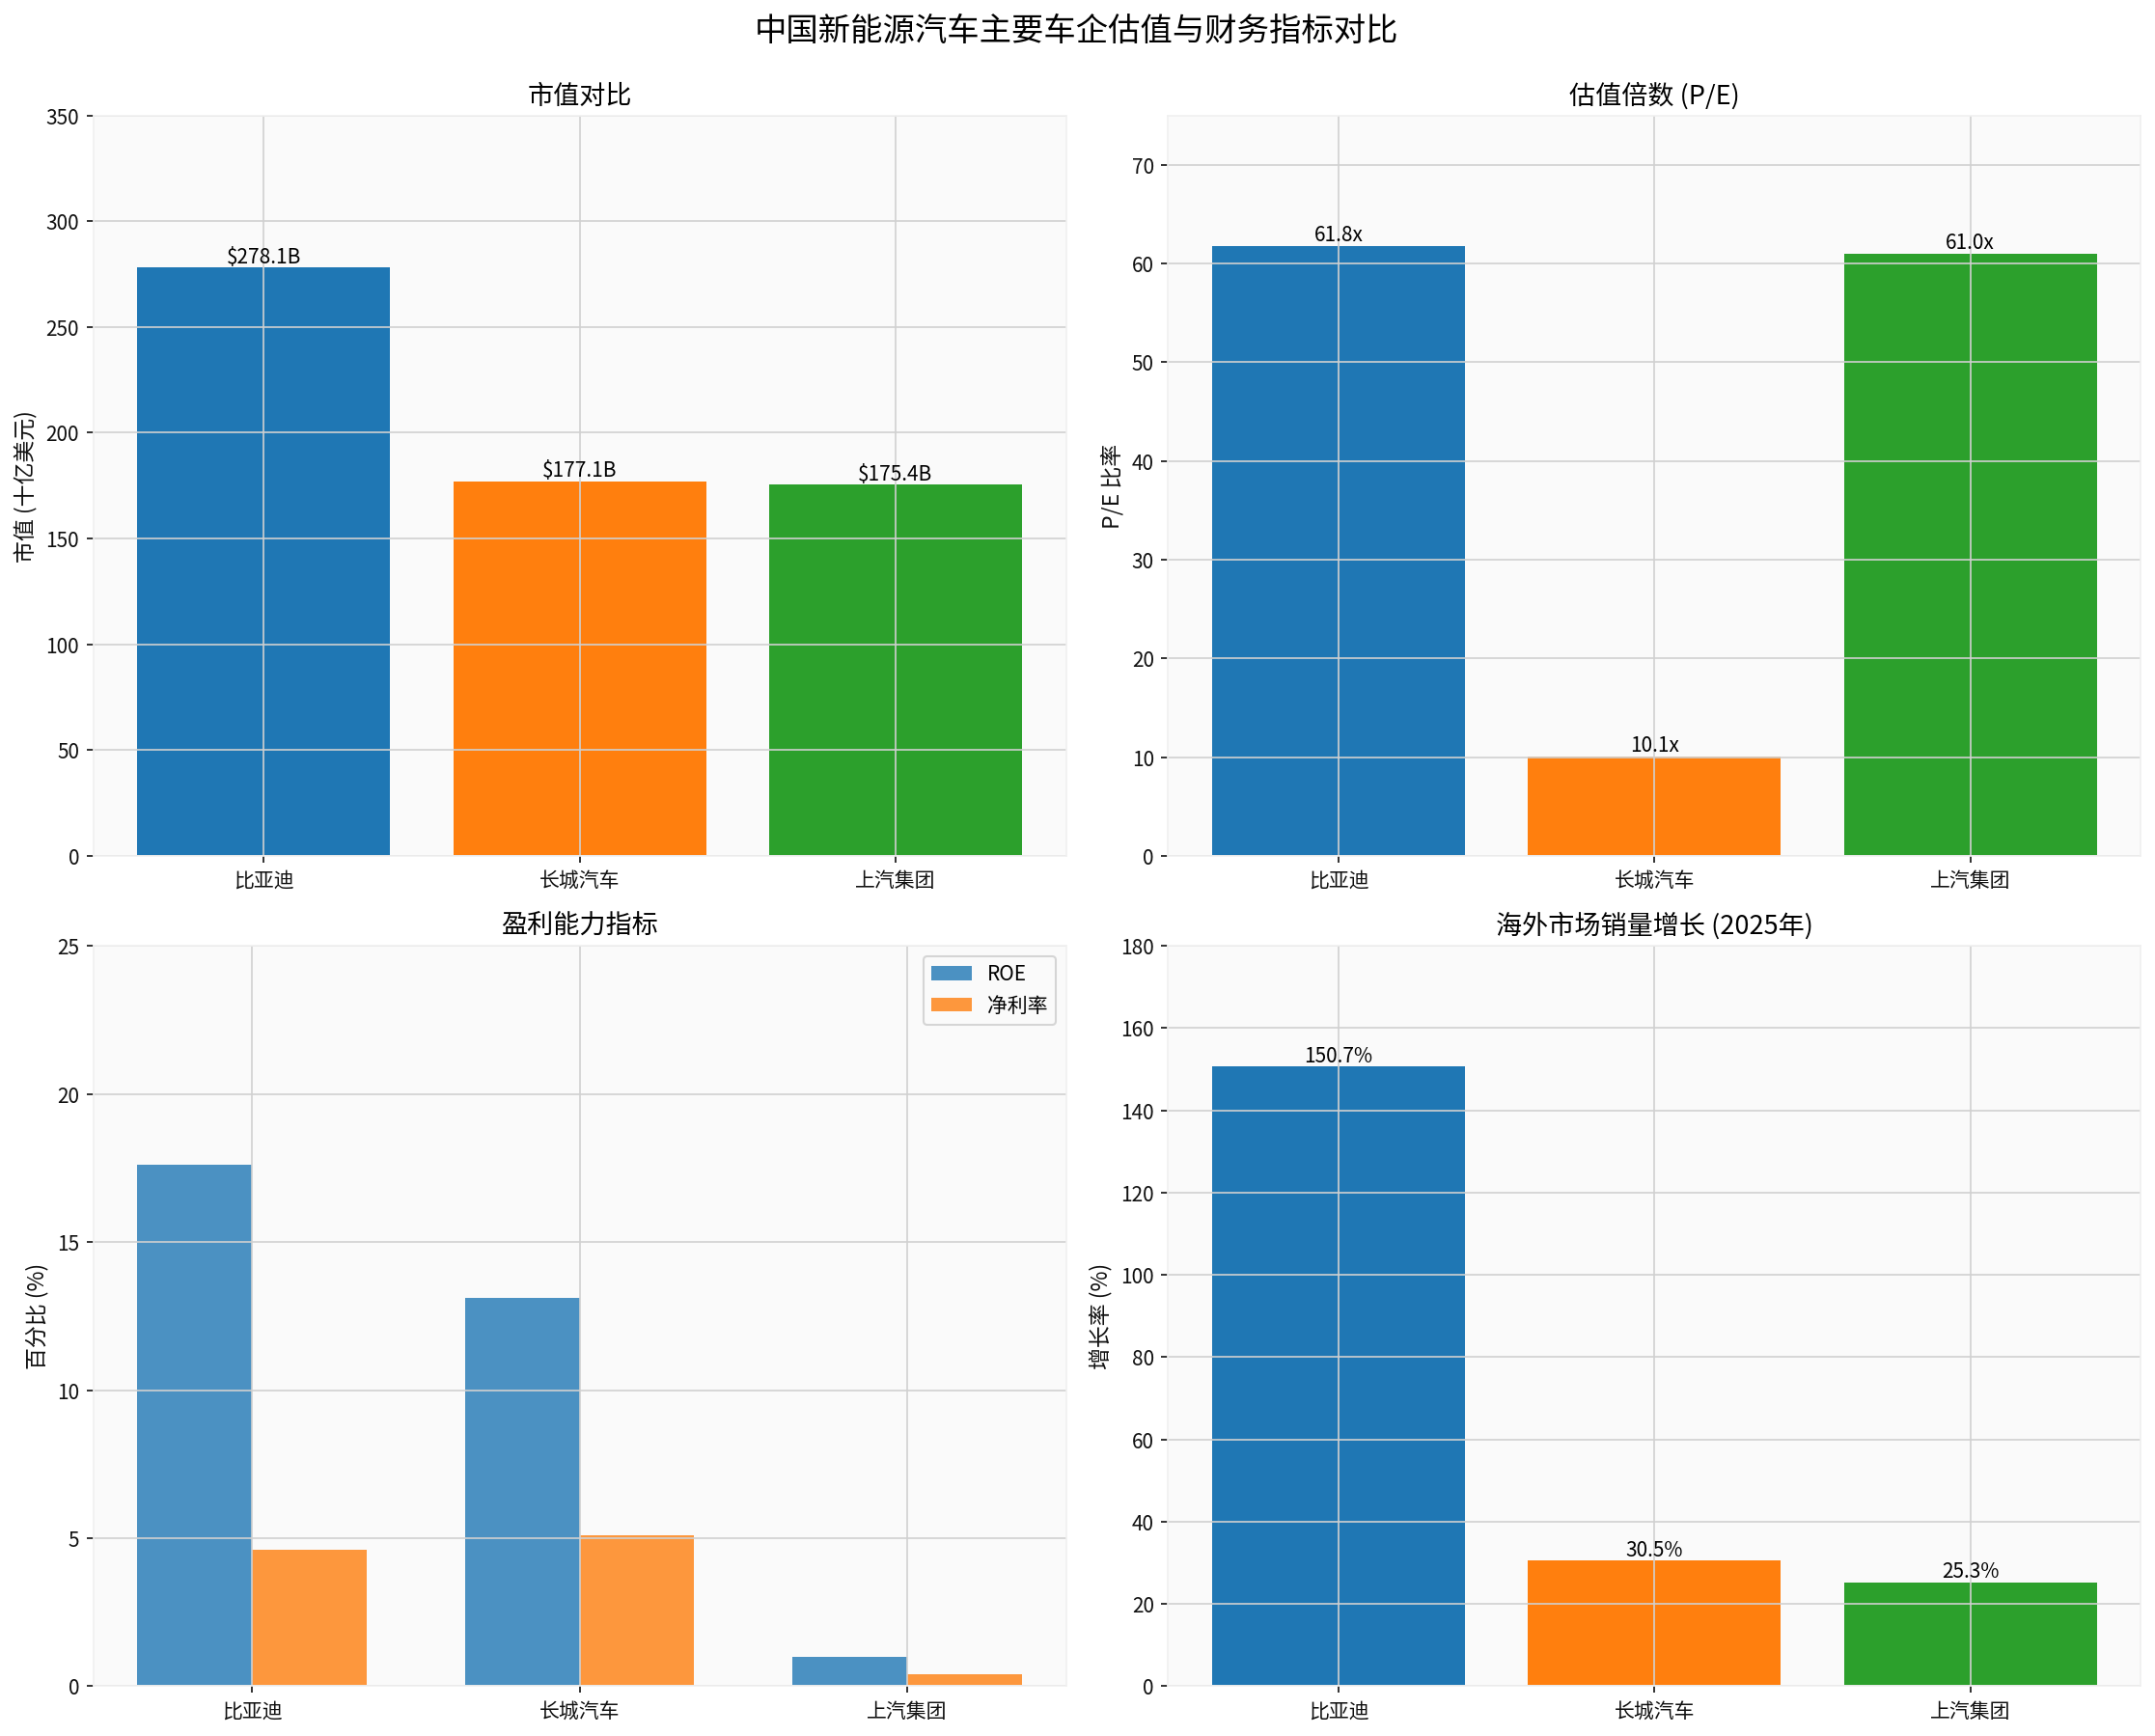
| Indicator | BYD | Great Wall Motor | SAIC Motor |
|---|---|---|---|
| Market Cap (US$ billion) | 903 | 177 | 175 |
| P/E Multiple | 23.32 | 17.41 | 60.96 |
| ROE | 17.62% | 13.11% | 0.98% |
| Net Profit Margin | 4.56% | 5.13% | 0.43% |
| Overseas Sales Growth | 150.7% | 30.5% | 25.3% |
| Current Price (US$) | 95.80 | 14.19 | 15.26 |
From a valuation perspective, BYD and Great Wall Motor’s P/E multiples are in a reasonable range, matching their growth and profitability. BYD’s 23.32x P/E reflects the market’s premium for its technological and scale advantages, while Great Wall Motor’s17.41x P/E reflects more conservative market expectations. SAIC Motor’s60.96x P/E is relatively high, mainly due to the drag from traditional fuel vehicle business, and the effectiveness of its new energy transformation remains to be verified.
##3. Analysis of Valuation Driving Mechanism of Thailand Market Expansion
###3.1 Overseas Business Growth Engine Effect
In2025, BYD’s overseas sales reached 1.046 million units, a year-on-year increase of150.7%, accounting for about23% of the company’s total sales, up from about12% in2024 [3][4]. Great Wall Motor’s overseas sales also achieved growth of more than30%, and its Thailand factory has become the core production base radiating to Southeast Asia and Australia markets [5].
Overseas markets usually enjoy higher gross margins. Taking Thailand as an example, the price of Chinese brand electric vehicles is about15-20% higher than that of local fuel vehicles of the same level, while production costs are effectively controlled through localized production. In addition, the competition intensity in Southeast Asian markets is lower than that in China, and the pressure of price wars is relatively small, which is conducive to maintaining a healthy profit level.
The high growth and good profit prospects of overseas business are being repriced by the market. The DCF valuation models of BYD and Great Wall Motor show that overseas business contributes 40-60% of the company’s intrinsic value, and this proportion is expected to further increase with the continuous release of production capacity in Southeast Asia.
###3.2 Value of Localized Production Strategy
Chinese automakers’ production capacity layout in Thailand has entered the harvest period [5]:
- BYD Thailand Factory: Located in Rayong Province, with an annual capacity of150,000 units, commissioned in2024
- Great Wall Motor Thailand Factory: Annual capacity of80,000 units, focusing on hybrid models
- SAIC Motor and Thailand’s Charoen Pokphand Group Joint Venture: Capacity of about100,000 units
- Neta Auto Thailand Factory: Planned to be commissioned in2026
Localized production brings three cost advantages:
- Avoid Trade Barriers: Bypass high tariffs (up to35%) imposed by the EU on Chinese electric vehicles
- Reduce Logistics Costs: Local production in Southeast Asia saves 15-20% of freight costs compared to exports from China
- Obtain Policy Dividends: Thailand’s Eastern Economic Corridor Act provides tax incentives
With the improvement of production capacity utilization, the effect of fixed cost amortization will gradually emerge. Taking BYD’s Thailand factory as an example, the annual capacity of150,000 units corresponds to an investment of about US$800 million. After reaching full capacity, the depreciation cost per vehicle is only about US$150, significantly lower than importing from China (about US$400).
###3.3 Valuation Impact Path of Market Share Expansion
- Sales growth directly increases revenue scale
- Increased market share enhances market confidence
- Improved brand awareness supports valuation multiple expansion
- Production capacity release brings scale effect and profit margin improvement
- Profit contribution from Southeast Asian markets increases the company’s overall profit
- Verification of internationalization capabilities reduces risk premium
- Become a global automobile group,摆脱 dependence on the single Chinese market
- Establish a global supply chain system to enhance risk resistance capabilities
- Technology output and brand premium bring sustained growth momentum
##4. Risk Factors and Investment Recommendations
###4.1 Main Risks
BYD’s sales growth slowed to7.73% in2025, the lowest in five years, and its domestic market share faces fierce competition from brands such as Geely and Leapmotor [3][4]. Price wars may put pressure on profit margins and affect overall profitability.
Thailand’s new energy vehicle subsidy policy will be adjusted in2026, which may affect consumers’ purchase意愿. In addition, the EU’s high tariff policy on Chinese electric vehicles may extend to Southeast Asia, bringing trade risks.
Slow economic growth in Southeast Asia may affect consumers’ car purchase ability. Exchange rate fluctuations (Thai Baht trend) will also affect the profits of export enterprises.
###4.2 Technical Analysis
BYD (1211.HK) and Great Wall Motor (2333.HK) show the following technical trends [0]:
| Indicator | BYD | Great Wall Motor |
|---|---|---|
| Trend Judgment | Sideways Consolidation | Sideways Consolidation |
| Support Level | HK$94.07 | HK$14.68 |
| Resistance Level | HK$96.63 | HK$15.51 |
| MACD | Bullish Crossover | Bullish Crossover |
| KDJ | Bullish | Overbought Risk |
| Beta Coefficient | 0.47 | 1.13 |
Both companies’ stock prices are near key support levels, and the MACD indicator shows short-term rebound demand. Great Wall Motor’s RSI is in the overbought area, and there may be adjustment pressure in the short term.
###4.3 Investment Recommendations
- Rating: Strong Buy
- Target Price: Based on DCF valuation, the reasonable value range is HK$3075-3653
- Logic: High growth of overseas business, release of production capacity in Thailand, and leading technical advantages support valuation expansion
- Risk Reminder: Continuous domestic price wars, valuation has partially reflected optimistic expectations
- Rating: Buy
- Target Price: Based on DCF valuation, the reasonable value range is HK$140-200
- Logic: Valuation significantly lower than peers, high growth of overseas business, advantages of hybrid technology route
- Risk Reminder: Brand premium ability is weaker than BYD, fierce competition in SUV market
##5. Conclusion and Outlook
###5.1 Core Conclusions
The rapid expansion of Chinese automakers’ market share in Thailand’s new energy vehicle market is becoming an important growth engine for the valuation improvement of relevant enterprises. Based on this in-depth analysis, the following core conclusions are drawn:
-
Market Pattern Has Fundamentally Changed: Chinese brands have captured a 79% market share in Thailand’s new energy vehicle market, and the era of Japanese brand dominance has ended. This change will profoundly affect the competitive pattern of the global automobile industry.
-
Overseas Business Is the Key Driver of Valuation Improvement: BYD’s overseas sales grew by150.7%, and Great Wall Motor’s overseas business expanded rapidly. The DCF valuation model shows that overseas business contributes a considerable proportion of the company’s value. With the release of production capacity in bases such as Thailand, this contribution will continue to increase.
-
Localized Production Strategy Has Achieved Significant Results: By establishing production bases in Thailand, Chinese automakers have effectively avoided trade barriers, reduced production costs, obtained policy dividends, and realized the strategic upgrade from “product export” to “production capacity export”.
-
Valuation Has Upside Potential: The DCF valuations of BYD and Great Wall Motor show that the current stock prices have several times upside potential, reflecting that the market has not fully priced in the long-term growth potential of overseas business.
###5.2 Future Outlook
Looking ahead, the expansion of Chinese automakers in Southeast Asian markets will show the following trends:
[0] Gilin API Data - Market Quotes, Company Overview, Financial Analysis, DCF Valuation, Technical Analysis
[1] Ember Energy - “The EV leapfrog – how emerging markets are driving a global EV boom” (https://ember-energy.org/latest-insights/the-ev-leapfrog-how-emerging-markets-are-driving-a-global-ev-boom/)
[2] Forbes - “China’s Ghost City Dividend: Building A World-Class Supply Chain” (https://www.forbes.com/sites/jonmarkman/2025/12/24/chinas-ghost-city-dividend-building-a-world-class-supply-chain/)
[3] Reuters - “BYD posts weakest sales growth in five years on headwinds at home” (https://www.reuters.com/world/asia-pacific/byd-posts-weakest-sales-growth-five-years-headwinds-home-2026-01-01/)
[4] The Wall Street Journal - “BYD’s Sales Growth Slowed in 2025, But Still Set to Top Tesla” (https://www.wsj.com/business/autos/byds-sales-growth-slowed-in-2025-but-still-set-to-top-tesla-d8aabcfb)
[5] CleanTechnica - “XPENG to Begin Local Assembly in Malaysia by Mid-2026” (https://cleantechnica.com/2025/12/15/xpeng-to-begin-local-assembly-in-malaysia-by-mid-2026/)
[6] Drive Australia - “BYD overtakes Tesla as world’s top-selling electric vehicle maker in 2025” (https://www.drive.com.au/news/byd-overtakes-tesla-as-worlds-top-selling-electric-vehicle-maker-in-2025/)
[7] Visual Capitalist - “BYD 2.6M EV deliveries, 20% global market share (Jan-Aug 2025)” (https://www.visualcapitalist.com/)
Insights are generated using AI models and historical data for informational purposes only. They do not constitute investment advice or recommendations. Past performance is not indicative of future results.
About us: Ginlix AI is the AI Investment Copilot powered by real data, bridging advanced AI with professional financial databases to provide verifiable, truth-based answers. Please use the chat box below to ask any financial question.