Yutong Bus (600066.SS) In-depth Investment Value Analysis Report
Unlock More Features
Login to access AI-powered analysis, deep research reports and more advanced features
About us: Ginlix AI is the AI Investment Copilot powered by real data, bridging advanced AI with professional financial databases to provide verifiable, truth-based answers. Please use the chat box below to ask any financial question.
Related Stocks
As a leading enterprise in China’s bus industry, Yutong Bus achieved consecutive sales growth in 2025, with cumulative sales of 49,518 units, an increase of 5.54% year-on-year [0]. Based on multi-dimensional analysis, we believe the company’s
| Indicator | 2025 Data | YoY Change | Industry Position |
|---|---|---|---|
| December Monthly Sales | 8,664 units | +2.89% | Industry No.1 |
| Cumulative Sales | 49,518 units | +5.54% | Ranked first in medium and large bus sales |
| Cumulative Production | 49,356 units | +4.89% | High production-sales matching degree |
According to data from the China Bus Statistics Information Network, the total sales of medium and large buses in the industry in the first half of 2025 were 50,775 units, an increase of 2.05% compared with the same period in 2024, while Yutong Bus sold 21,321 units in the same period, an increase of 3.73% year-on-year,
According to industry data, the export volume of medium and large buses in the industry increased by 16.51% year-on-year in 2025, and is expected to continue growing in the second half of the year [1]. Yutong Bus has significant advantages in overseas layout:
- Global Coverage: Products have been exported to more than 100 countries and regions, with cumulative exports exceeding 110,000 units [2]
- Localized Production: Conduct localized cooperation through KD assembly methods in more than ten countries and regions including Kazakhstan, Pakistan, Ethiopia, and Malaysia, realizing the business model upgrade from “product output” to “technology output and brand authorization” [1]
- High-end Market Breakthrough: Continuously penetrate high-end markets such as Europe and the Americas, with cumulative exports of more than 8,000 new energy buses to nearly 60 countries or regions [1]
The global bus market is experiencing a critical period of transition from fuel to new energy. Driven by economic and technological factors and environmental protection policies, the demand for new energy buses in regions such as Europe, Latin America, and Southeast Asia is expected to continue growing [1]. Yutong Bus:
- Technology Leadership: Cumulative sales of new energy buses exceed 196,000 units, ranking first in the world [2]
- Complete Product Matrix: Layout of multiple technical routes such as pure electric, hydrogen fuel, and battery swapping modes
- High-end Breakthrough: Launched high-end products such as Tianyu S12, seizing the dual opportunities of consumption upgrade and technological iteration [3]
Yutong Bus has a market share of over 32% in China, firmly ranking as the industry leader [2]. With the increasing demand for quality upgrades in tourism and business travel, the company is expected to improve profitability through product structure optimization.
| Financial Indicator | Value | Industry Comparison |
|---|---|---|
| ROE (Return on Equity) | 36.74% | Significantly higher than industry average |
| Net Profit Margin | 12.60% | Industry-leading level |
| Operating Profit Margin | 14.03% | Excellent |
| P/E (TTM) | 14.92x | Reasonable valuation range |
The performance in the first three quarters of 2025 was outstanding: Q3 EPS was 0.61 USD, exceeding market expectations by 30.43% [0]. In the first half of 2025, it achieved operating income of 16.129 billion yuan and net profit attributable to shareholders of listed companies of 1.936 billion yuan, an increase of 15.64% year-on-year [1].
- Adequate Liquidity: Current ratio 1.58, quick ratio 1.24, good financial flexibility [0]
- Low Debt Risk: Financial analysis shows the company’s debt risk is classified as “low risk” [0]
- Ample Cash Flow: Latest free cash flow (FCF) is approximately 6.515 billion yuan [0]
| Valuation Scenario | Valuation Price | Relative to Current Price | Assumptions |
|---|---|---|---|
| Conservative Scenario | 37.01 yuan | +10.3% | Zero revenue growth |
| Neutral Scenario | 48.28 yuan | +43.9% | Revenue growth of 14.4% |
| Optimistic Scenario | 76.51 yuan | +128.1% | Revenue growth of 17.4% |
Probability Weighted |
53.93 yuan |
+60.8% |
Comprehensive scenario |
DCF valuation analysis shows that based on a weighted average cost of capital (WACC) of 9.0%, the company’s probability-weighted intrinsic value is 53.93 yuan, with approximately 60% upside compared to the current stock price [4].
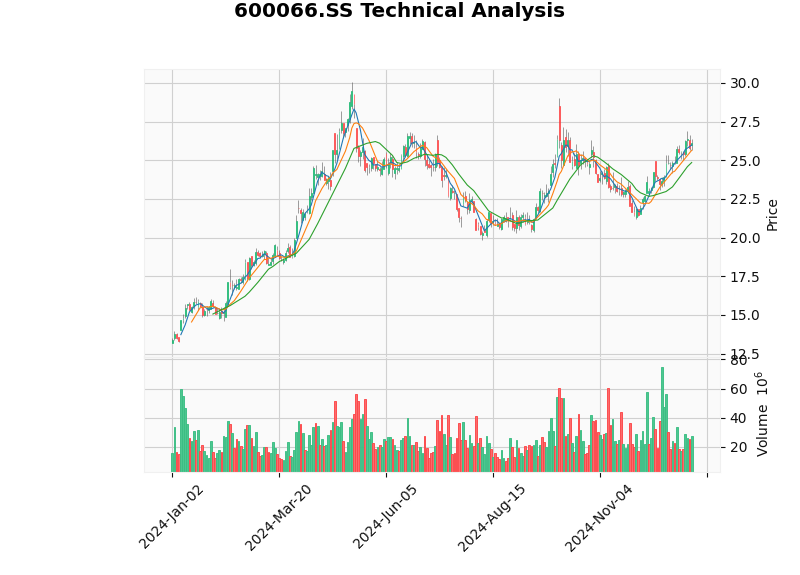
| Indicator | Status | Signal Significance |
|---|---|---|
| Price Position | Approximately 26 yuan, above the 50-day/200-day moving average | Medium-term trend is strong |
| Support Level | 24.85 yuan | Limited downside risk |
| Resistance Level | 26.53 yuan | Short-term pressure level |
| MACD | Bullish arrangement | Medium-term upward momentum continues |
| KDJ | K:71.8, D:76.7 | Short-term consolidation needed |
| Beta | 0.67 (relative to CSI 300) | Low beta characteristic, good anti-fall performance |
Technical analysis shows that the company’s stock price is currently in a
- Overseas Market Expansion: Export sales increased by 16.51% year-on-year, with demand in Europe, Latin America, and Southeast Asia continuing to release [1]
- New Energy Transition: Accelerated global electrification process, obvious technical leadership advantages of the company [2]
- High-end Product Breakthrough: High-end models such as Tianyu S12 enhance brand premium capacity [3]
- Intelligent Upgrade: L3/L4 autonomous driving technology reserves, wide application of intelligent connected technology [3]
- Service Sector Layout: Explore full-life-cycle services such as finance, leasing, operation and maintenance, and energy services [3]
| Risk Type | Specific Description | Risk Level |
|---|---|---|
| Macroeconomic Risk | Economic downturn affects passenger transport and tourism demand | Medium |
| Policy Risk | New energy subsidy withdrawal, trade barriers | Medium |
| Exchange Rate Risk | High proportion of export business, exchange rate fluctuations impact | Medium |
| Competition Risk | Domestic and foreign competitors accelerate catching up | Low |
| Raw Material Cost Risk | Cost fluctuations of core components such as batteries and chips | Low |
- High Growth Certainty: 5.54% sales growth in 2025, driven by dual engines of overseas market and new energy, growth momentum expected to continue
- Attractive Valuation: Current PE of 14.92x is in the historical reasonable range, DCF valuation shows 60% upside
- Solid Fundamentals: ROE of 36.74% indicates excellent profitability, ample cash flow, low debt risk
- Industry Leader Premium: Domestic market share over 32%, global share over 15%, obvious brand and technical advantages
| Item | Value |
|---|---|
| Short-term Target Price (3-6 months) | 28-30 yuan |
| Medium-term Target Price (6-12 months) | 35-40 yuan |
| Long-term Target Price (12+ months) | Above 50 yuan |
| Stop-loss Level | 22 yuan (about 15% decline from current price) |
- Position Building Range: 24-26 yuan (close to support level)
- Add Position Range: After breaking through the 26.53 yuan resistance level and retesting confirmation
- Holding Period: 6-12 months or more, enjoying dual benefits of valuation repair and performance growth
As a global bus industry leader, Yutong Bus has made significant progress in both new energy transition and overseas market expansion strategies. The company’s sales grew by 5.54% in 2025, significantly outpacing the industry average, export sales increased by 16.51% year-on-year, cumulative new energy bus sales ranked first in the world, and fundamentals are strong.
From the valuation perspective, the current PE of about 15x is in the historical reasonable range, and DCF valuation shows 60% upside. Technical analysis indicates that after short-term consolidation, it is expected to choose an upward breakthrough.
Considering the company’s industry position, growth certainty, and valuation attractiveness, we believe Yutong Bus has high medium-to-long-term investment value. It is recommended that investors布局逢低 in the range of 24-26 yuan to share the long-term dividends of the company’s new energy transition and globalization development.
[0] Gilin API - Yutong Bus Company Overview, Real-time Quotes and Financial Analysis Data (January 5, 2026)
[1] Yutong Bus Co., Ltd. 2025 Semi-Annual Report (https://stockmc.xueqiu.com/202508/600066_20250826_G8HM.pdf)
[2] Yutong Global Market Presence (https://en.yutong.com/about/about-yutong/, https://en.yutong.com/)
[3] Yutong Bus’s Production and Sales Reverse Growth, Can High-end Breakthrough Reshape the Industry? (https://www.news18a.com/news/storys_212659.html)
[4] Gilin API - DCF Valuation Analysis Report (January 5, 2026)
[5] Gilin API - Technical Analysis Report (January 5, 2026)
Insights are generated using AI models and historical data for informational purposes only. They do not constitute investment advice or recommendations. Past performance is not indicative of future results.
About us: Ginlix AI is the AI Investment Copilot powered by real data, bridging advanced AI with professional financial databases to provide verifiable, truth-based answers. Please use the chat box below to ask any financial question.