CATL's RMB 4.3 Billion Share Repurchase and Analysis of Valuation Bottom for A-Shares New Energy Sector
Unlock More Features
Login to access AI-powered analysis, deep research reports and more advanced features
About us: Ginlix AI is the AI Investment Copilot powered by real data, bridging advanced AI with professional financial databases to provide verifiable, truth-based answers. Please use the chat box below to ask any financial question.
Related Stocks
According to the latest announcement, CATL (300750.SZ) had repurchased approximately 15.99 million A-shares by December 31, 2025, accounting for 0.36% of the total share capital, with a total transaction amount of RMB 4.386 billion (excluding transaction fees) [1][2]. This repurchase was approved on April 7, 2025, with a repurchase plan of RMB 4-8 billion and a repurchase price range of RMB 231.50-317.63 per share [1].
- Current Stock Price: RMB 367.26, 52-week range: RMB 209.11—424.36 (approximately -13.4% from the year-to-date high) [0].
- Valuation Multiples:
- P/E (TTM): Approximately 26.1x (static basis)
- P/B (TTM): Approximately 5.31x
- EV/OCF (TTM): Approximately 13.45x [0]
- Annual Performance: 2025 full-year increase of approximately +37.9%, significantly outperforming the A-share market; however, it retreated from the high in the second half of the year [0].
- Technical Aspect: As of the end of 2025, it is in sideways consolidation with no obvious trend; short-term support/resistance is around RMB 362.7/379.4; KDJ indicates potential opportunities after oversold [0].
- Recent Performance: 2025 Q3 single-quarter EPS was approximately RMB 4.10, slightly exceeding expectations (+0.5%); revenue was approximately RMB 104.19 billion, slightly below expectations (-11.6%). Overall profit margin remains at a high industry level [0].
- Profitability: TTM net profit margin is approximately 16.5%, ROE is approximately 22.8%, reflecting high profit quality and shareholder return capacity [0].
- Cash Flow and Capital Expenditure: Over a 5-year period, the company maintains a conservative accounting approach with a high proportion of depreciation/capital expenditure and strong free cash flow generation capacity; the latest annual free cash flow is approximately RMB 65.8 billion [0].
- Debt Risk: Classified as “low risk” with a sound balance sheet structure [0].
- Conservative Scenario: Intrinsic value is approximately RMB 297.1 (vs current RMB 367.3, discount of approximately -19.1%). Assumptions: 0% revenue growth, EBITDA margin of approximately 17.3%, WACC of approximately 13.4% [0].
- Neutral Scenario: Intrinsic value is approximately RMB 3,218.2 (vs current RMB 367.3, significant premium). Assumptions: Revenue growth of approximately 63.8% (corresponding to 5-year historical average), EBITDA margin of approximately 18.2%, WACC of approximately 11.3% [0].
- Optimistic Scenario: Intrinsic value is approximately RMB 4,765.9 (vs current RMB 367.3, substantial premium). Assumptions: Revenue growth of approximately 66.8%, EBITDA margin of approximately 19.1%, WACC of approximately 10.4% [0].
- Note: The above scenarios are highly sensitive to long-term growth and discount rate assumptions; they should be understood as “reference values under given assumptions” rather than deterministic predictions. The current stock price is within the range of “conservative/neutral” assumptions, reflecting the market’s comprehensive expectations for growth, profit margins, and discount rates.
- CATL: Cumulative increase of approximately +38% in 2025, retreating from the high in the second half of the year with large annual fluctuations (annualized volatility of approximately 37%) [0].
- BYD: Full-year increase of approximately +3.6%, significantly underperforming CATL; current stock price is approximately -27.6% from the 52-week high, reflecting market分歧 on competitive landscape and profit realization [0].
- Ganfeng Lithium: Full-year increase of approximately +79.6%, performing strongly driven by upstream resource price and supply cycle expectations; however, volatility is high (annualized approximately 47%) with a maximum drawdown of approximately -24% [0].
| Company | P/E (TTM) | Distance from YTD High | Annualized Volatility |
|---|---|---|---|
| CATL (300750.SZ) | ~26x | -13.4% | ~37% |
| BYD (002594.SZ) | ~70x | -27.6% | ~33% |
| Ganfeng (002460.SZ) | Negative | -15.1% | ~47% |
- CATL’s valuation is in the middle of the sector, with industry leader premium, but the valuation repair space still depends on the realization of medium-to-long-term growth expectations.
- BYD’s P/E is significantly higher than CATL’s, reflecting the market’s higher expectations for its growth and NEV penetration rate, but it also means higher valuation vulnerability.
- Ganfeng Lithium is more affected by upstream price cycles, with higher profit elasticity and volatility.
- Management Confidence: Conducting a repurchase of approximately RMB 4 billion level after the stock price retreat reflects the management’s view that the current price does not fully reflect the company’s long-term value, or at least is attractive within the “repurchase price range” (RMB 231.5—317.6) [1][2].
- Financial Strength: Abundant free cash flow and low leverage allow the company to implement repurchases without increasing financial risks, which itself is an endorsement of “balance sheet quality” [0].
- Potential Support Role: Large-scale repurchases in history often provide certain support for stock prices in the medium-to-long term, but need to be judged comprehensively in combination with fundamental realization and market environment.
- Absolute Valuation Is Not Extremely Cheap: Compared with some deep value sectors, the current P/E (TTM) of around 26x belongs to the category of “growth stocks with performance support” rather than traditional deep value.
- Industry Competition and Capacity Cycle: The power battery industry has rapid capacity expansion, and price wars and cost competition will continue, suppressing medium-to-long-term profit margins. The share and pricing power of leaders are key variables in the process of industry concentration improvement.
- Technology and Policy Uncertainty: Solid-state batteries, new material iterations, and global trade/subsidy policy adjustments may change the competitive landscape and profit expectations.
- Repurchase Scale and Rhythm: Currently, approximately RMB 4.386 billion has been used (accounting for approximately 109.65% of the lower limit of the plan and 54.8% of the upper limit of the plan). Whether to continue increasing repurchases in the future depends on the company’s rhythm and market environment; it cannot be linearly extrapolated as unlimited support.
- Valuation Digestion and Performance Support: In 2025, NEV leaders’ profits generally maintained high growth, and valuations have been significantly digested compared to the previous bubble stage. CATL’s TTM P/E of around 26x corresponds to an ROE of over 20%, and the matching degree between valuation and profit has improved [0].
- Leaders Take the Lead in Repurchasing: Industry leaders repurchasing in a relatively reasonable valuation range has “price anchor” and signal significance. Historically, leader repurchases often precede the overall sector sentiment repair, but the leading range and sustainability vary by industry cycle.
- Marginal Stabilization of Upstream Prices: After large fluctuations in 2025, prices of upstream materials such as lithium carbonate showed signs of phased rebound in December, and some enterprises began to adjust prices to reflect marginal improvement in supply and demand, supporting sector expectations [3].
- Policy and Long-Term Trends: The continuous increase in NEV penetration rate, expansion of energy storage and emerging application scenarios are still the underlying drivers of medium-to-long-term industry growth, supporting the long-term competitiveness of leading enterprises.
- Valuation Differentiation and Structural Risks: Valuations of some midstream/upstream targets are still not low (e.g., BYD’s nearly 70x TTM P/E), and there are large market分歧 on growth and profit realization. The overall sector valuation “bottoming out” is a structural and gradual process rather than a one-size-fits-all time point.
- Downward Revision of Profit Growth Expectations: If global demand falls short of expectations, price wars intensify, or capacity utilization declines in future quarters, profit forecasts may be revised downward, and the valuation bottom may shift downward accordingly.
- Market Sentiment and Liquidity: Changes in A-share overall valuation and capital flow, macro policies, external environment, and risk appetite will amplify or compress valuation fluctuations periodically.
- Non-Linearity of Historical Experience: The large ups and downs of the sector from 2021 to 2023 indicate that “bearish” or “bullish” views on new energy require dynamic tracking of profits and industrial trends. During the industry capacity cycle and policy iteration stage, the valuation bottom is usually interval-based and structural.
- Positive Factors: Stable global power battery leader position, leading technology reserve and customer structure; strong cash flow and balance sheet quality; management repurchase expresses confidence; valuation has significantly retreated from historical highs.
- Risks to Watch: Industry price wars and profit margin pressure; overseas market and policy uncertainty; significant impact of changes in long-term growth and discount rate assumptions on valuation.
- Structural Opportunities: Leader concentration improvement, technology iteration, cost advantages, overseas expansion are medium-to-long-term alpha sources; however, prosperity varies significantly across different segments (materials, manufacturing, downstream applications).
- Beta Environment: Changes in macroeconomics and risk appetite, global industrial policies and trade environment will periodically amplify or compress valuation fluctuations.
- This report is based on available information and tool data for analysis and does not constitute any investment advice.
- Data and assumptions have limitations; please refer to the latest announcements and actual disclosures.
- The market has uncertainties; past performance does not indicate future results.
- CATL’s RMB 4.3 Billion Level Repurchaseconveys the management’s confidence in the company’s long-term value and has rationality at the financial and valuation levels, which has positive significance for stock prices and sector expectations, butdoes not constitute a deterministic judgment that “sector valuation has fully bottomed out”.
- The current valuation of CATL is in the central and reasonable range of “growth leader” (not an extreme value range); combined with industry competition and capacity cycle, its valuation repair is more likely to be structural and gradual.
- The “bottom” of the new energy sector is more reflected as a range of valuation differentiation and marginal improvement: the valuation of leading enterprises has more support, but the overall sector still needs to track variables such as profit realization, upstream price stabilization, and policy environment.
- Suggestions for Investors: Focus on the fundamental realization of leading enterprises and marginal changes in industry data, maintain a phased verification and risk hedging mindset, rather than simply regarding a single repurchase as a single signal of “full bottoming out”.
- Figure 1: 2025 NEV Leader Stock Performance Comparison
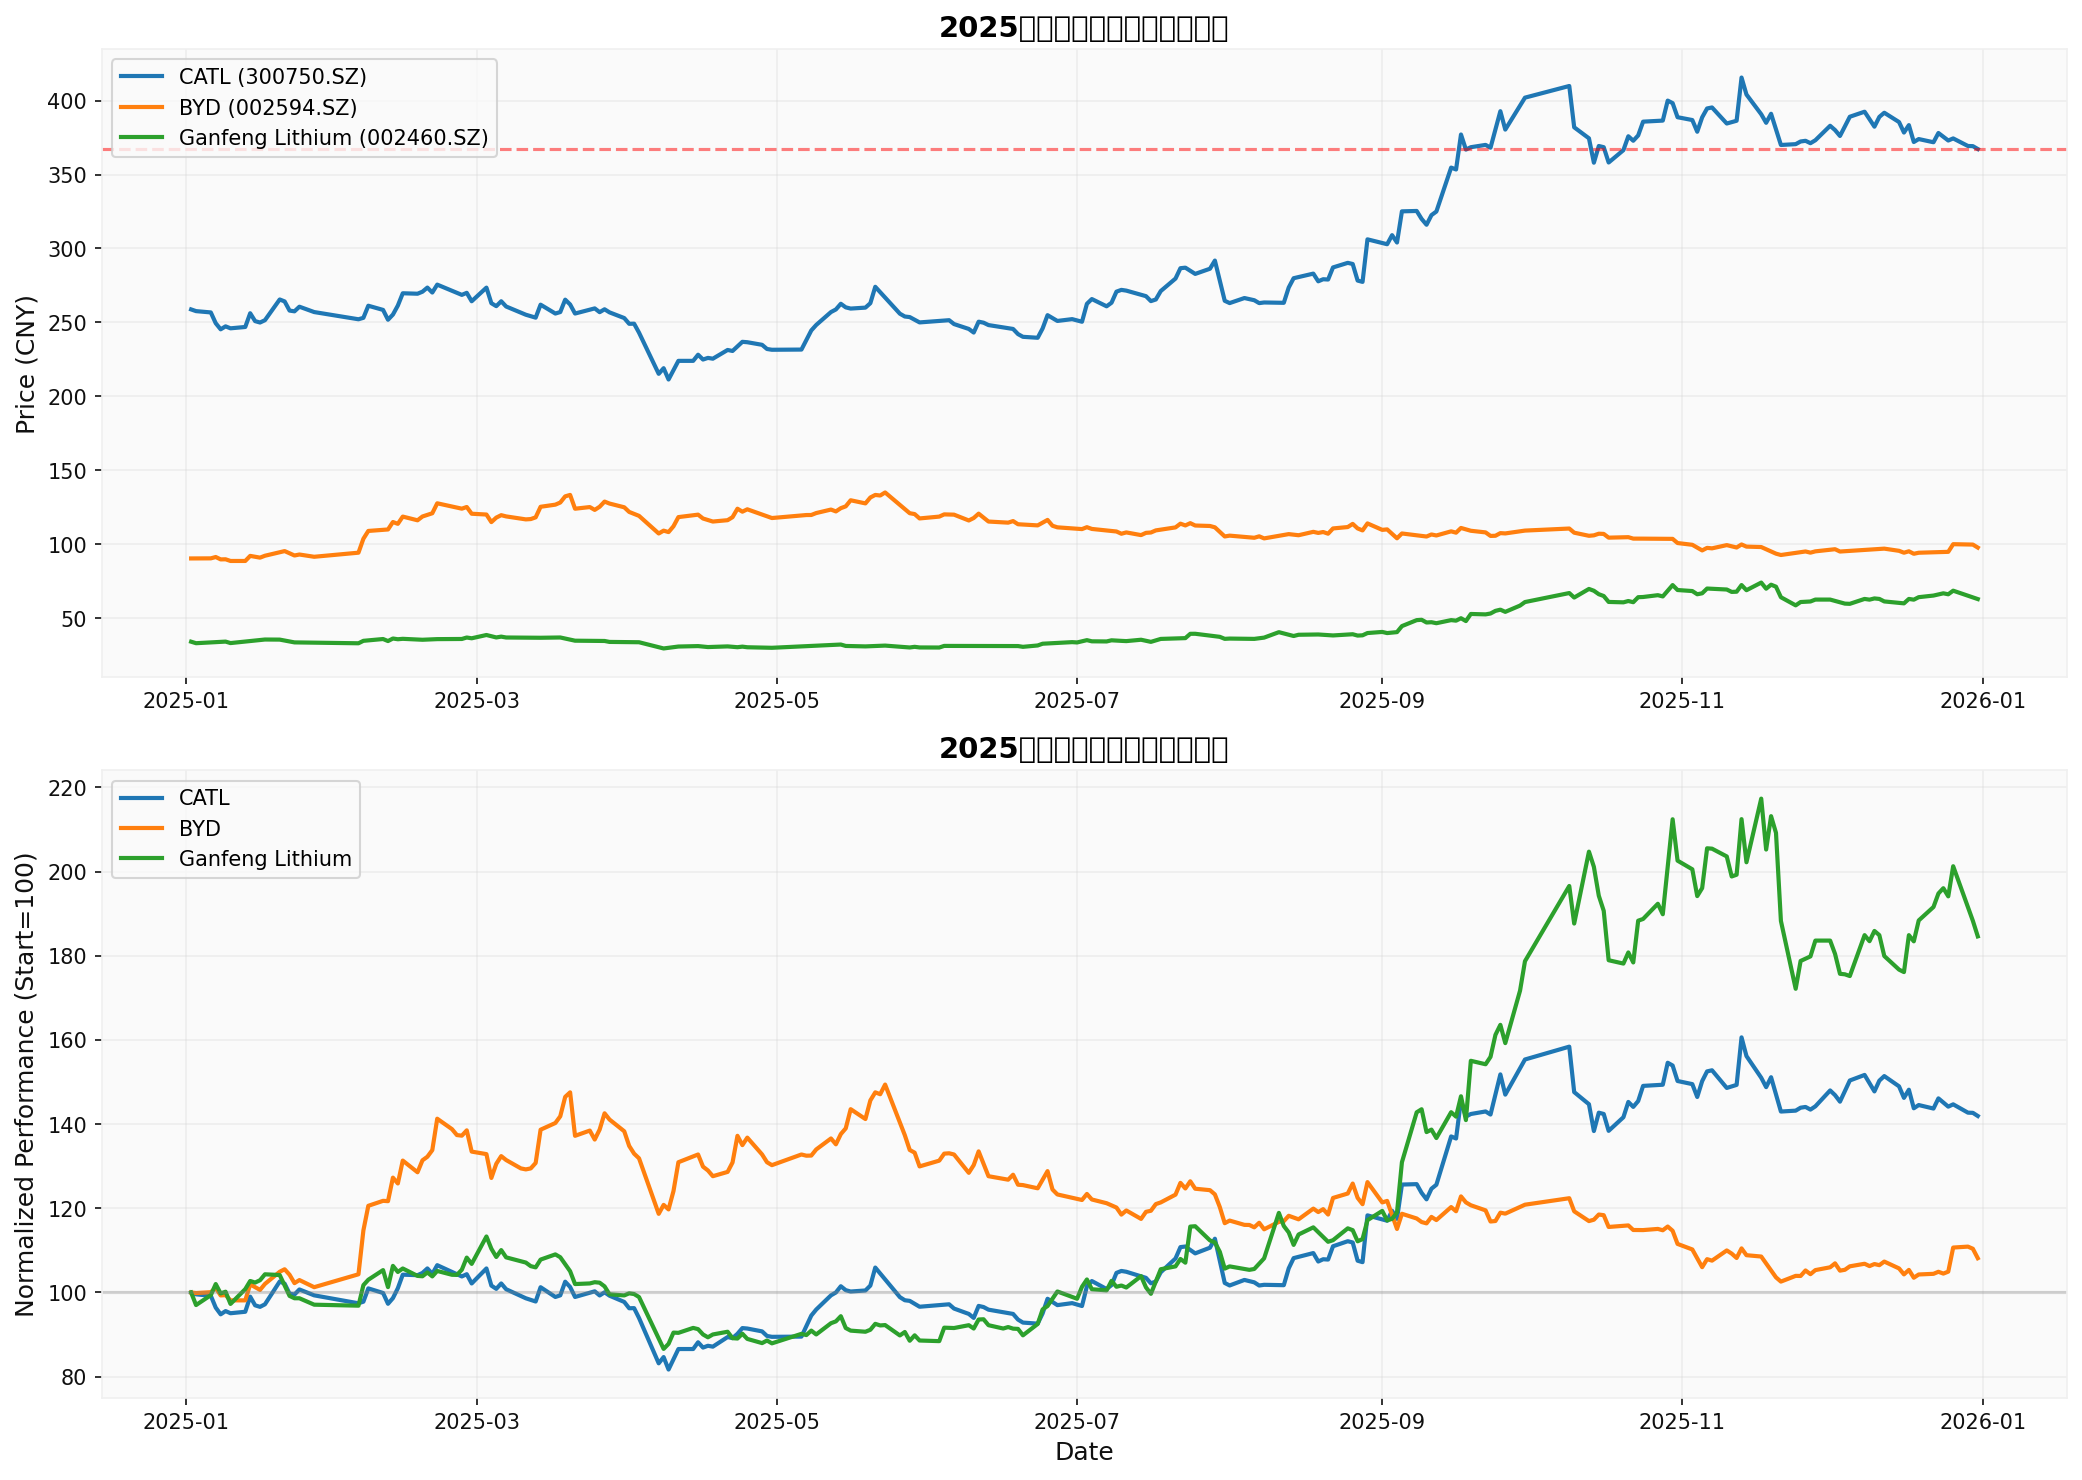
- Coverage Period: January 1 to December 31, 2025
- Normalization Benchmark: Take the closing price of each target on the first trading day of 2025 as 100
- Data Source: Brokerage API Tool
- Figure 2: CATL Technical Indicators (Price, MA, RSI, Trading Volume)
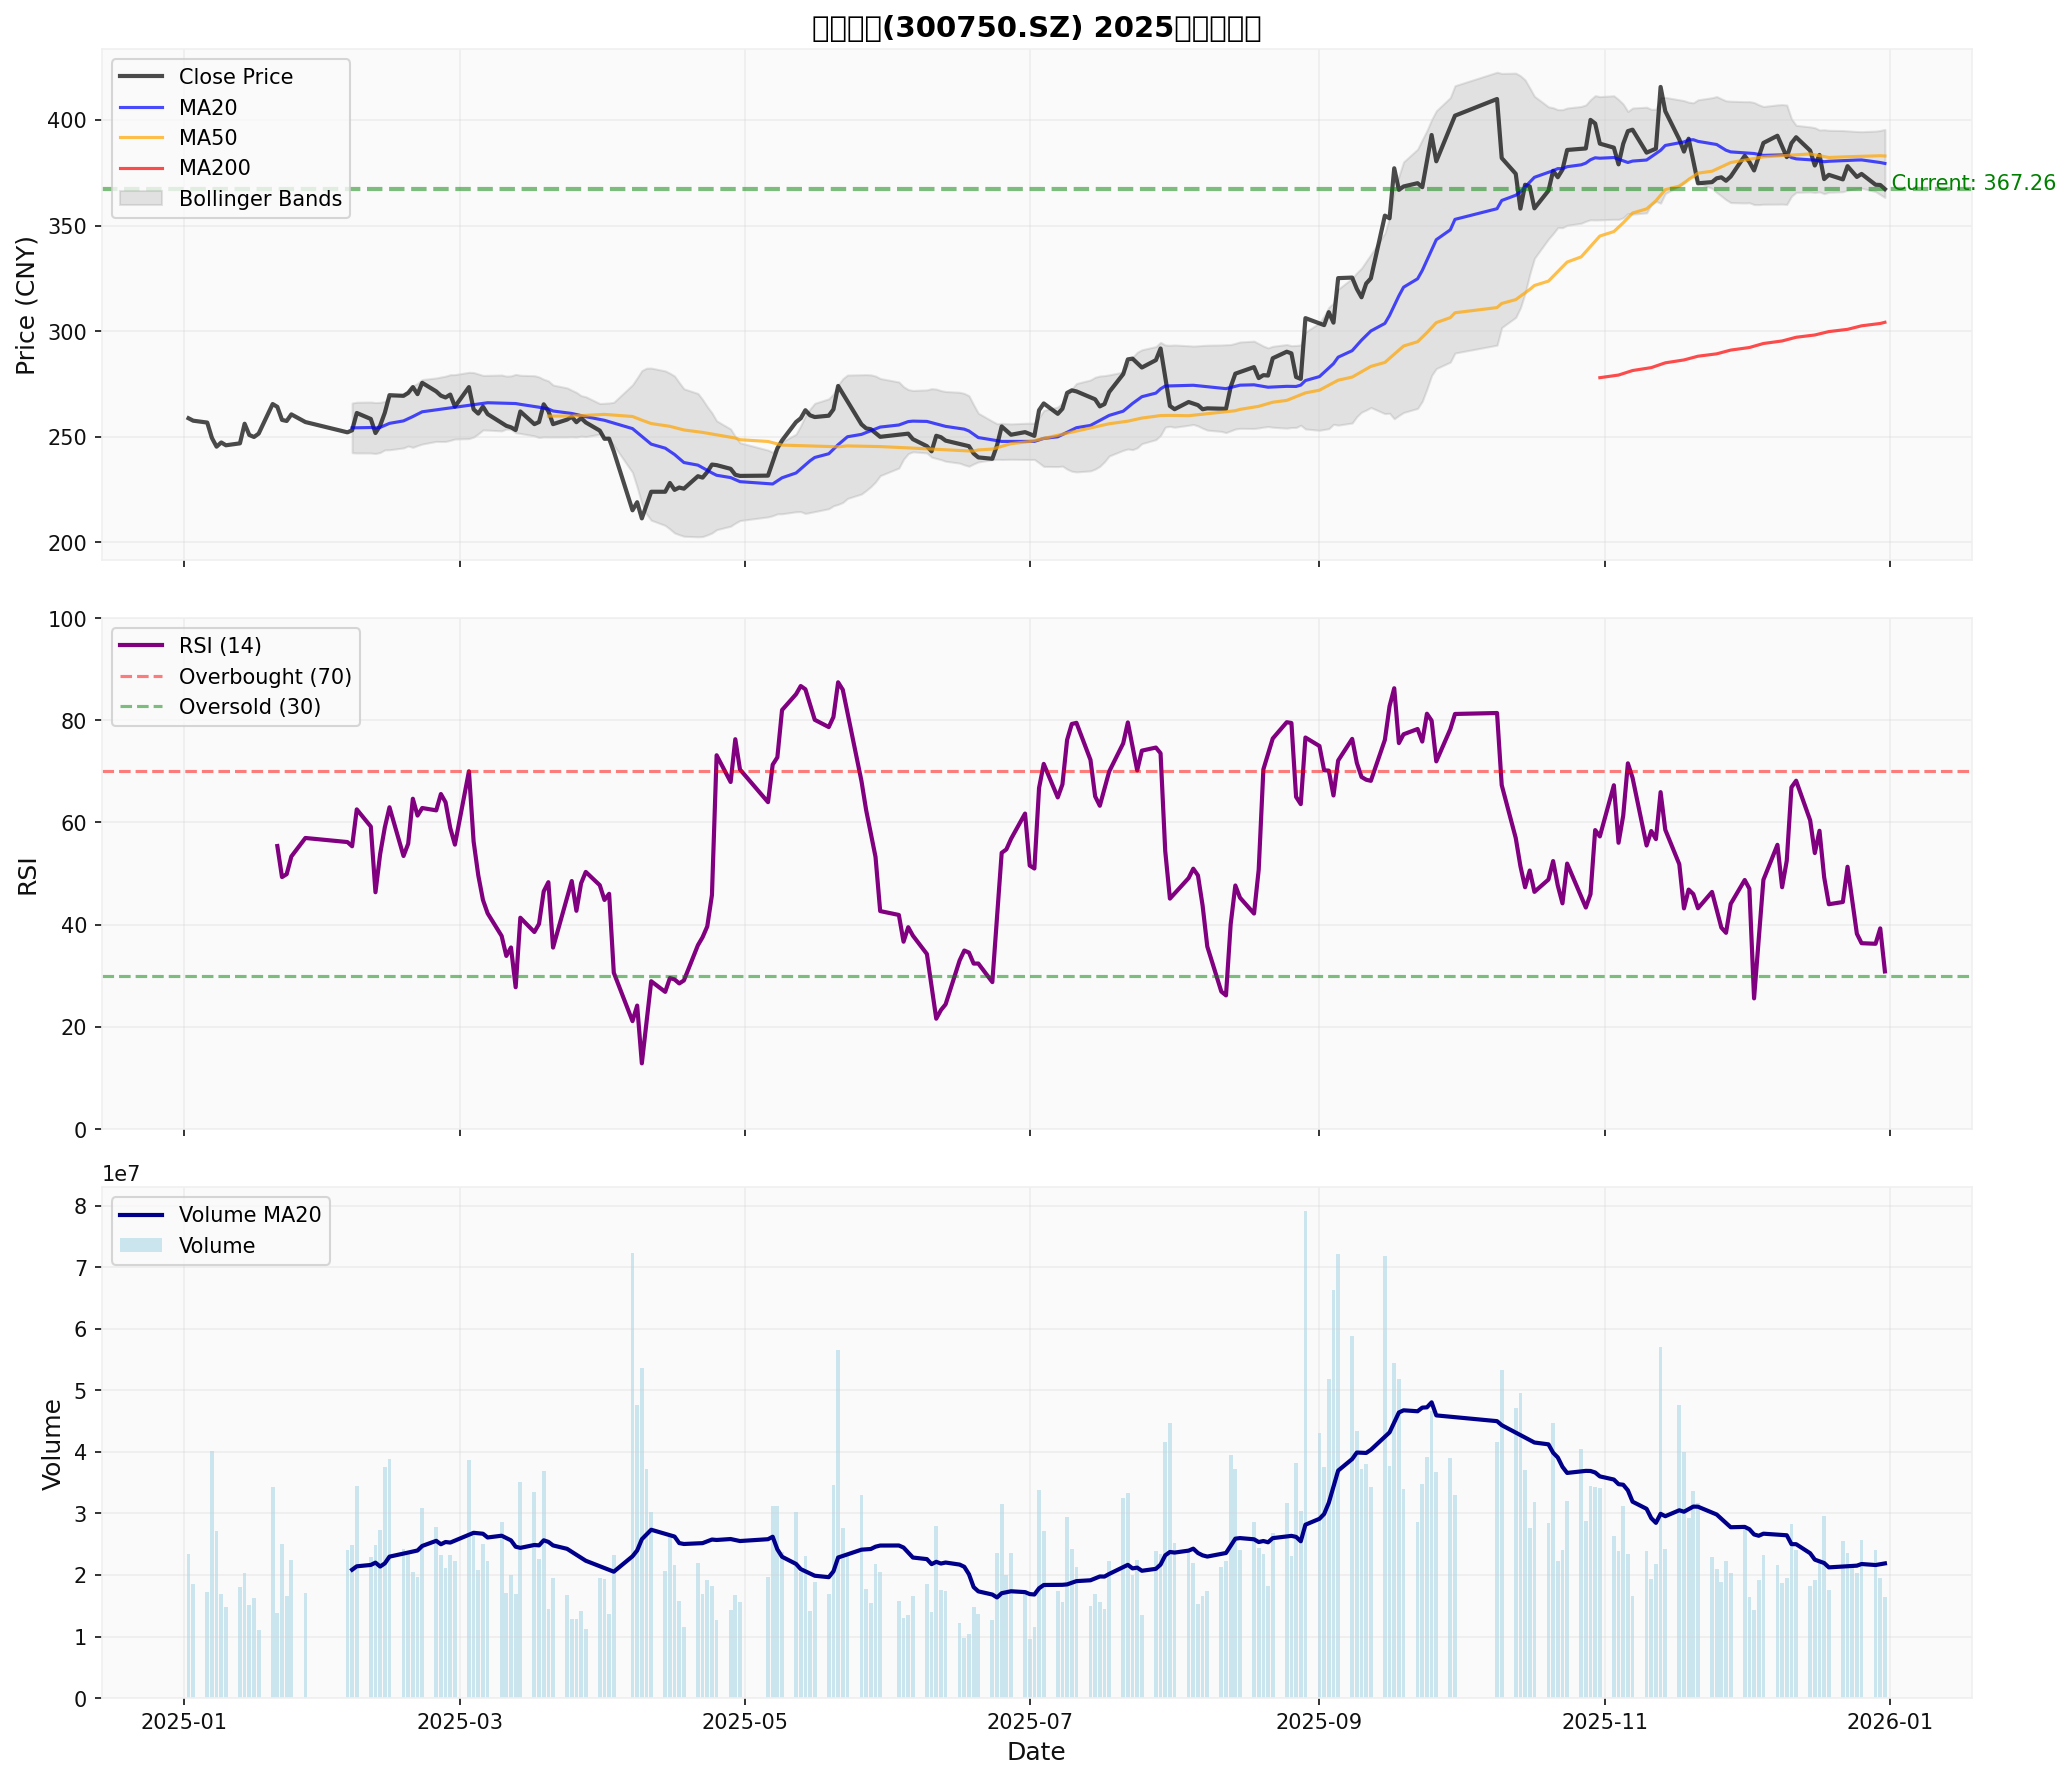
- Coverage Period: January 1 to December 31, 2025
- Key Indicators: Closing Price, MA20/50/200, RSI(14), Trading Volume and MA20
- Technical Status: Sideways consolidation at the end of 2025, RSI around 30.8 (close to oversold zone)
- Figure 3: Valuation Indicator Comparison of New Energy Leaders
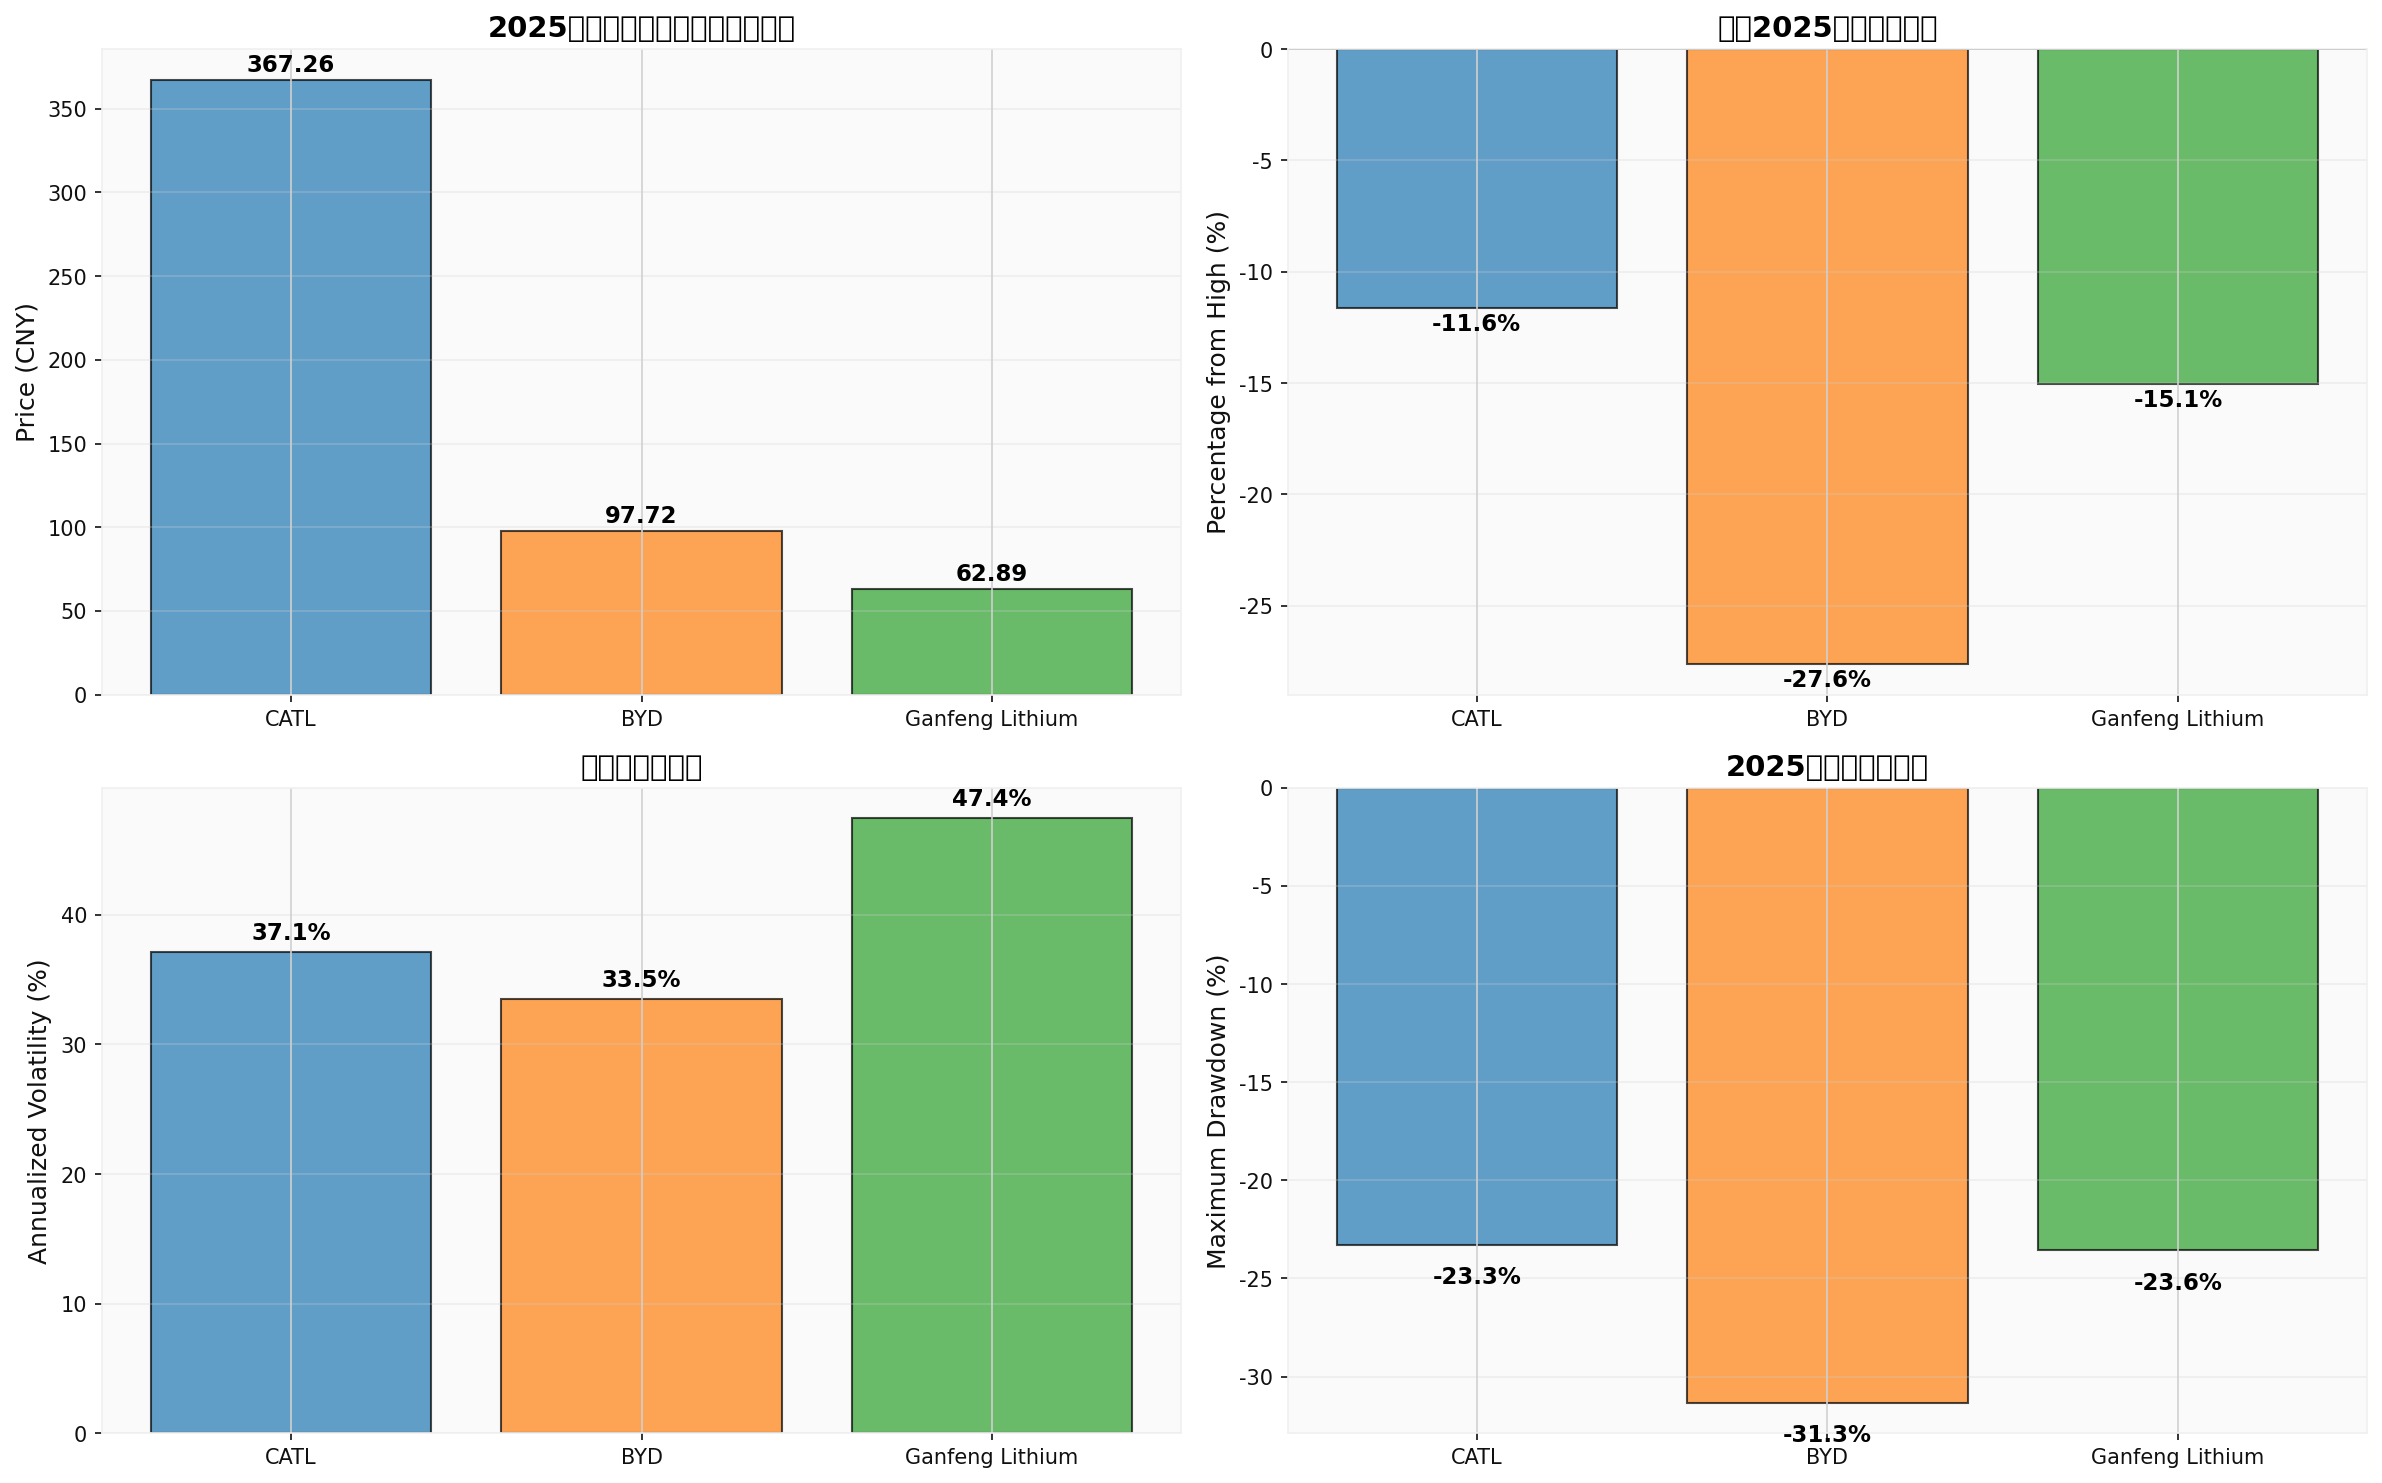
- Shows horizontal comparison of current stock price, percentage from 52-week high, annualized volatility, and maximum drawdown
- Data Source: Calculated based on daily market conditions (January 1 to December 31, 2025)
- [0] Gilin API Data
- [1] Sina Finance - 《CATL: Has Repurchased 15.9908 Million A-Shares, Total Capital Used Is RMB 4.386 Billion》 (January 4, 2026, Reprinted from Jiemian News) 链接
- [2] Securities Times Network - 《CATL: Cumulatively Repurchased 15.99 Million A-Shares, Total Transaction Amount Is RMB 4.386 Billion》 (January 4, 2026, Reprinted from People’s Finance News) 链接
- [3] Shanghai Securities News - 《Lithium Battery Volatility! Multiple Stocks Hit Daily Limit》 (December 26, 2025) 链接
- [4] CCB International Securities - 《Automotive – Power Batteries and NEVs | NEVs Continue to Boost Power Batteries in 2026》 (December 9, 2025) 链接 (Note: This research report mentions an “Outperform” rating for CATL and provides a systematic outlook on the power battery and NEV industry)
Insights are generated using AI models and historical data for informational purposes only. They do not constitute investment advice or recommendations. Past performance is not indicative of future results.
About us: Ginlix AI is the AI Investment Copilot powered by real data, bridging advanced AI with professional financial databases to provide verifiable, truth-based answers. Please use the chat box below to ask any financial question.