In-depth Analysis of the Reasons for the Divergence Between Cash Flow and Net Profit of Netac Intelligent
Unlock More Features
Login to access AI-powered analysis, deep research reports and more advanced features

About us: Ginlix AI is the AI Investment Copilot powered by real data, bridging advanced AI with professional financial databases to provide verifiable, truth-based answers. Please use the chat box below to ask any financial question.
Related Stocks
Based on the financial data of Netac Intelligent (300543.SZ) over the past five years (2020-2024), there is a significant divergence between the company’s cash flow and net profit, which has obvious cyclical characteristics and structural reasons.
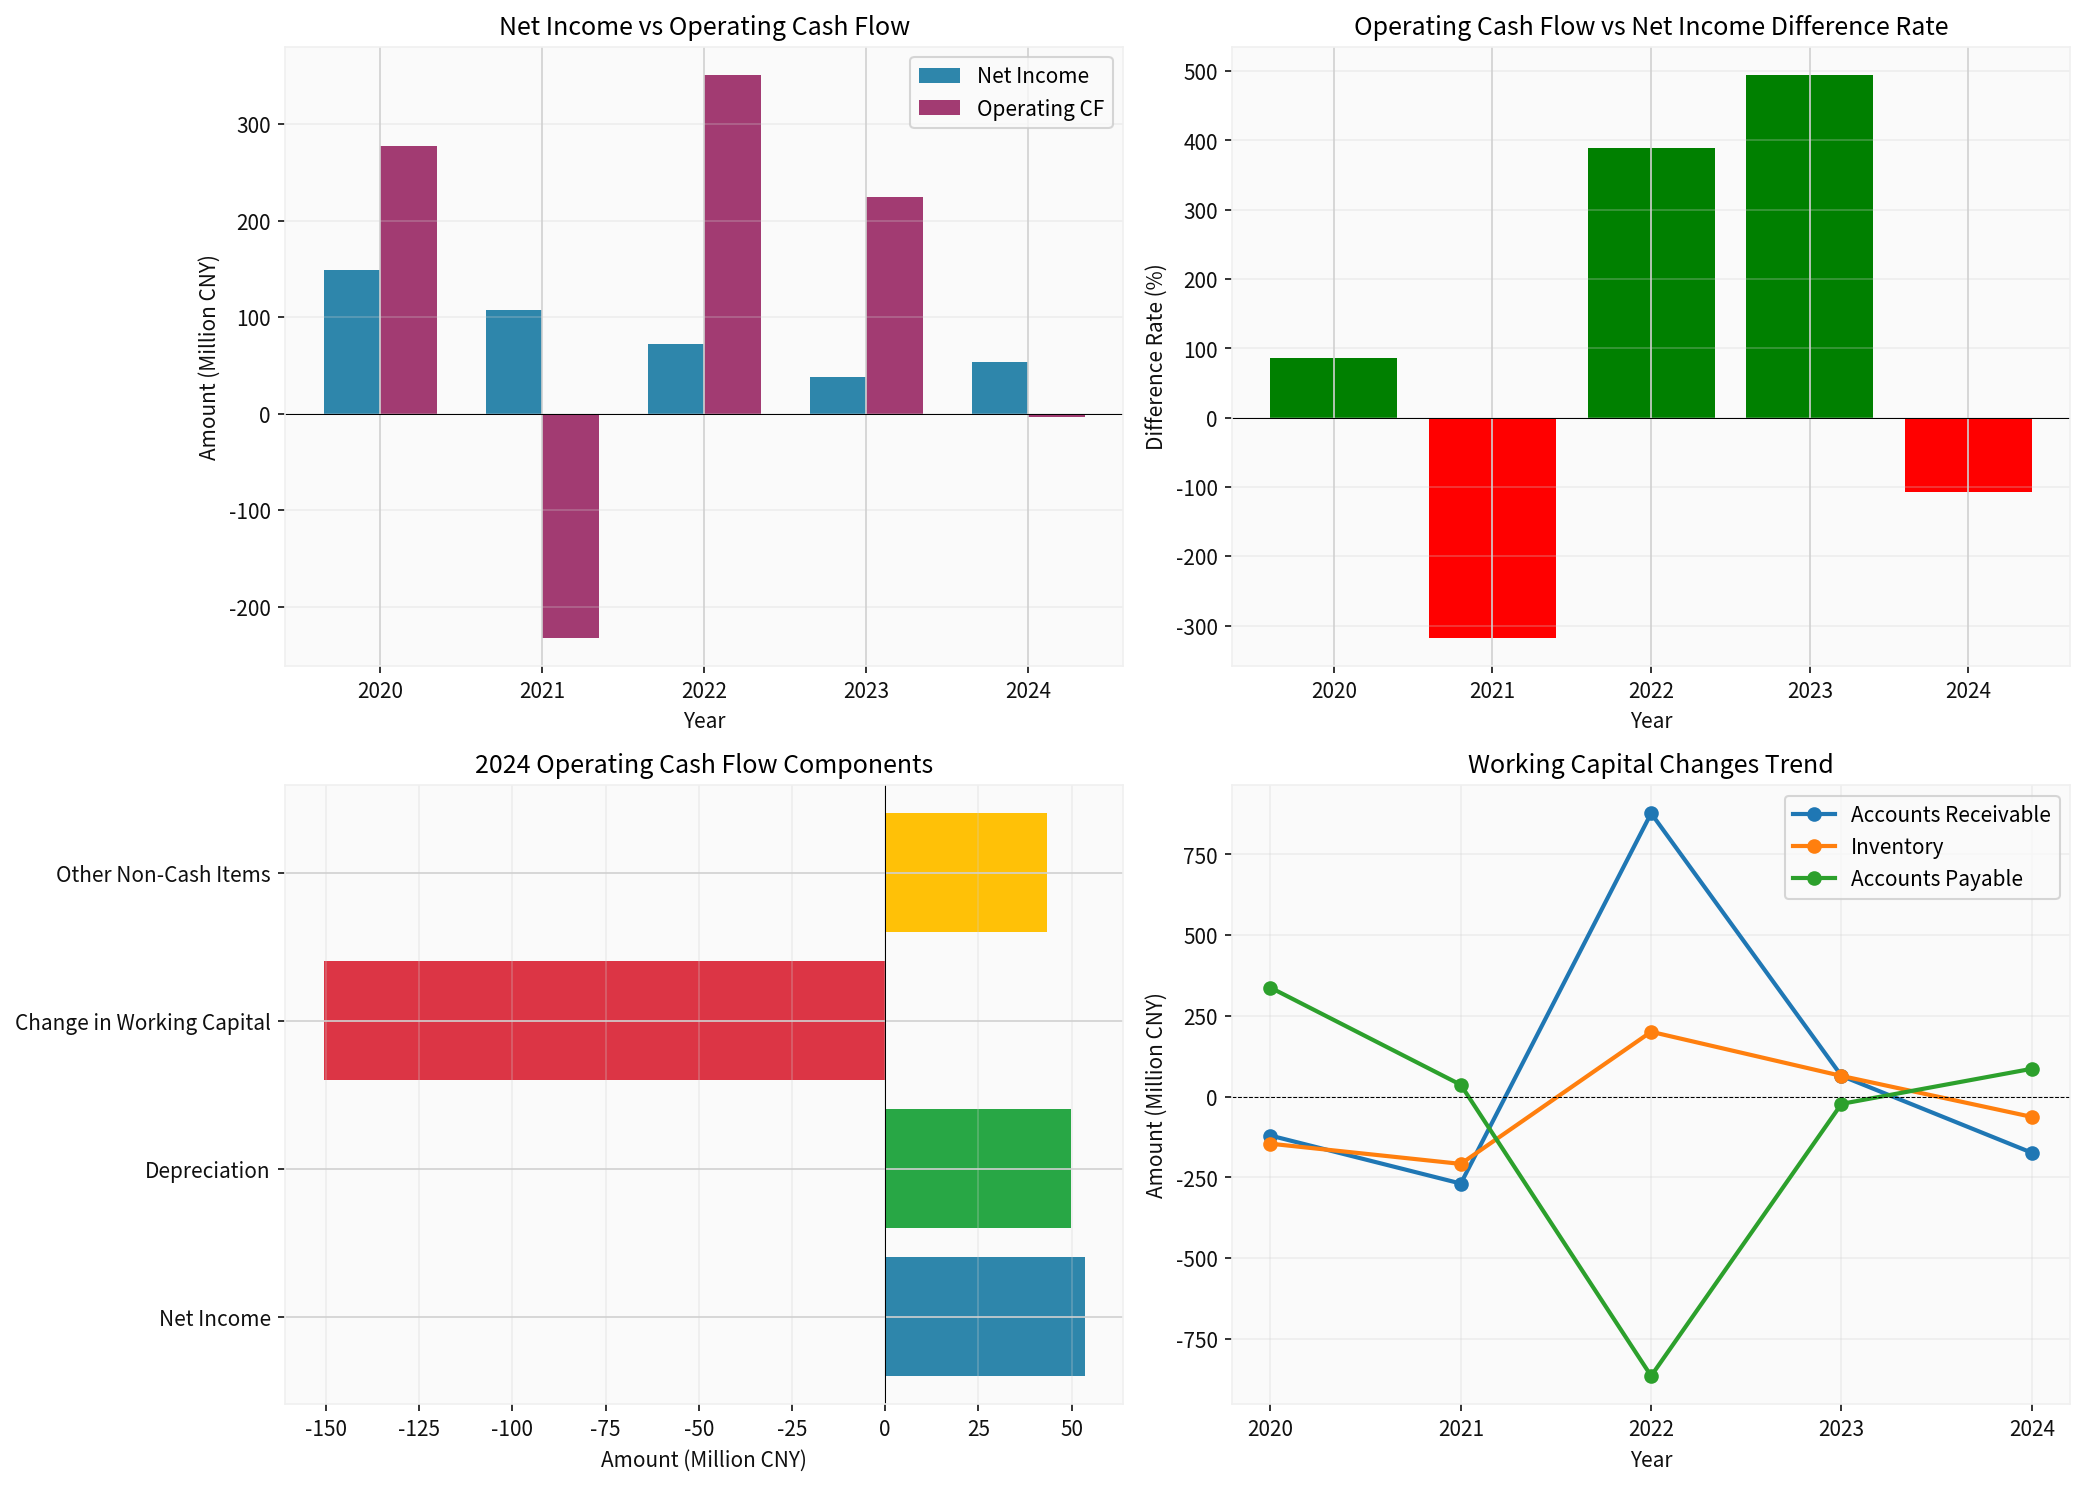
From the data, the fluctuation range of Netac Intelligent’s cash flow is much larger than that of net profit, and the relationship between the two is not stable [0]. In 2020 and 2022-2023, operating cash flow was significantly higher than net profit; while in 2021 and 2024, operating cash flow was negative, showing a large divergence from net profit. In 2024, the company’s net profit was 53.6 million yuan, but operating cash flow was only -3.87 million yuan, and free cash flow was even -173 million yuan, showing a serious cash consumption trend [0].
Changes in working capital are the core factor leading to the divergence between cash flow and net profit. In 2024, changes in working capital had a negative impact of -151 million yuan on operating cash flow, directly leading to a significant deterioration of operating cash flow, which should have been close to net profit [0]. Specifically:
-
Significant increase in accounts receivable: In 2024, accounts receivable increased by 174 million yuan, reflecting a decline in the company’s ability to collect payments and an extension of customer payment cycles. This usually means that the company has to provide more relaxed credit policies to customers to maintain revenue growth.
-
Serious inventory backlog: In 2024, inventory increased by 62.72 million yuan, a year-on-year increase of about 27%. Slower inventory turnover indicates that the company is facing product unsaleability issues or deviations in its prediction of market demand, with a large amount of funds occupied by inventory.
-
Increase in accounts payable: In the same year, accounts payable increased by 86.33 million yuan, which is a positive factor in the divergence. It indicates that the company extended the payment cycle to suppliers, temporarily alleviating cash flow pressure, but this is not a sustainable source of cash.
Depreciation and amortization are non-cash costs, amounting to 49.87 million yuan in 2024, which increase net profit but do not affect cash flow [0]. In addition, changes in deferred income tax assets also cause differences between accounting profit and cash flow. In 2021, the net deferred income tax liability was -4.32 million yuan, reflecting the timing difference between tax accounting treatment and actual cash payment.
Another important reason for the continuous pressure on free cash flow is high capital expenditures. In 2024, capital expenditures reached 170 million yuan, mainly used for the purchase of fixed assets and equipment investment [0]. Although these expenditures are recorded in asset accounts in accounting and gradually affect profits through depreciation, the actual cash expenditures are concentrated in the current period, resulting in a timing mismatch between capital expenditures and profit contributions.
As an electrical equipment manufacturer, Netac Intelligent’s downstream customers are mainly power and new energy enterprises, which have obvious investment cycle characteristics. When downstream customers’ capital expenditures shrink, the company not only faces pressure from declining revenue but also suffers from the double blow of extended payment collection cycles and inventory backlogs. 2021 and 2024 coincided with industry adjustment periods, leading to simultaneous deterioration of cash flow and net profit.
Despite large fluctuations in cash flow, Netac Intelligent’s asset-liability structure remains stable. At the end of 2024, the company’s asset-liability ratio was about 48.5%, net cash was positive (net debt was -134 million yuan), and short-term debt repayment pressure was controllable [0]. The current ratio of 2.11 and quick ratio of 1.54 are both in relatively safe ranges. However, the continuous fluctuations in operating cash flow are worthy of vigilance, especially with a meager net profit margin of only 2.2%, the risk of cash flow disruption cannot be ignored.
The fundamental reasons for the divergence between cash flow and net profit of Netac Intelligent are the superimposed effects of
[0] Gilin API - Netac Intelligent (300543.SZ) Financial Statement Data (2020-2024)
Insights are generated using AI models and historical data for informational purposes only. They do not constitute investment advice or recommendations. Past performance is not indicative of future results.
About us: Ginlix AI is the AI Investment Copilot powered by real data, bridging advanced AI with professional financial databases to provide verifiable, truth-based answers. Please use the chat box below to ask any financial question.