Tourism Industry Recovery and Ctrip (TCOM) Investment Value Analysis
Unlock More Features
Login to access AI-powered analysis, deep research reports and more advanced features

About us: Ginlix AI is the AI Investment Copilot powered by real data, bridging advanced AI with professional financial databases to provide verifiable, truth-based answers. Please use the chat box below to ask any financial question.
Related Stocks
According to the latest market data, the 2026 New Year’s Day holiday tourism market showed
- Scenic spot ticket bookingsincreased by over4xyear-on-year [0]
- Hotel booking popularityrose by more than3xyear-on-year (data from LY.com)
- Flight bookings to popular destinationsgrew by26%year-on-year (data from Qunar.com)
- Cross-regional population flow nationwideis expected to exceed208 million person-timeson New Year’s Day, up21%year-on-year
The inbound tourism market has seen a
- Continuous advancement of China’s visa facilitation policies
- Steady recovery of international flight capacity
- Expansion of visa-free country scope
- Improved payment convenience for inbound tourism
Based on data analysis, the current tourism recovery
- Concentrated release of demand suppressed by the pandemic
- Holiday bookings show multiple growth
- Short-term growth may slow down
- Change in consumption habits: Increased emphasis on travel experiences post-pandemic
- Continuous consumption upgrade: Growing demand for high-quality tourism products
- Technology-driven: Rising proportion of online bookings
- Dual circulation of outbound and inbound tourism: Balanced development of international tourism market
According to the latest data, Ctrip demonstrates
| Financial Indicator | Value | Evaluation |
|---|---|---|
Market Capitalization |
$49 billion | Global online travel leader |
Current Stock Price |
$74.49 | Up 11.02% in 2025 [0] |
Price-to-Earnings Ratio (P/E) |
19.16x | Reasonable valuation level |
Net Profit Margin |
31.50% | Industry-leading |
Return on Equity (ROE) |
12.53% | Excellent capital return |
Current Ratio |
1.33 | Good liquidity |
Debt Risk Level |
Low Risk | Financially stable |
2024 Business Composition [0]:
- Accommodation booking services: 40.5% (main revenue source)
- Transportation ticketing services: 38.0% (second growth curve)
- Package tours: 8.1%
- Corporate travel: 4.7%
- China Market: 85.5% (core market)
- International Market:14.5% (great growth potential)
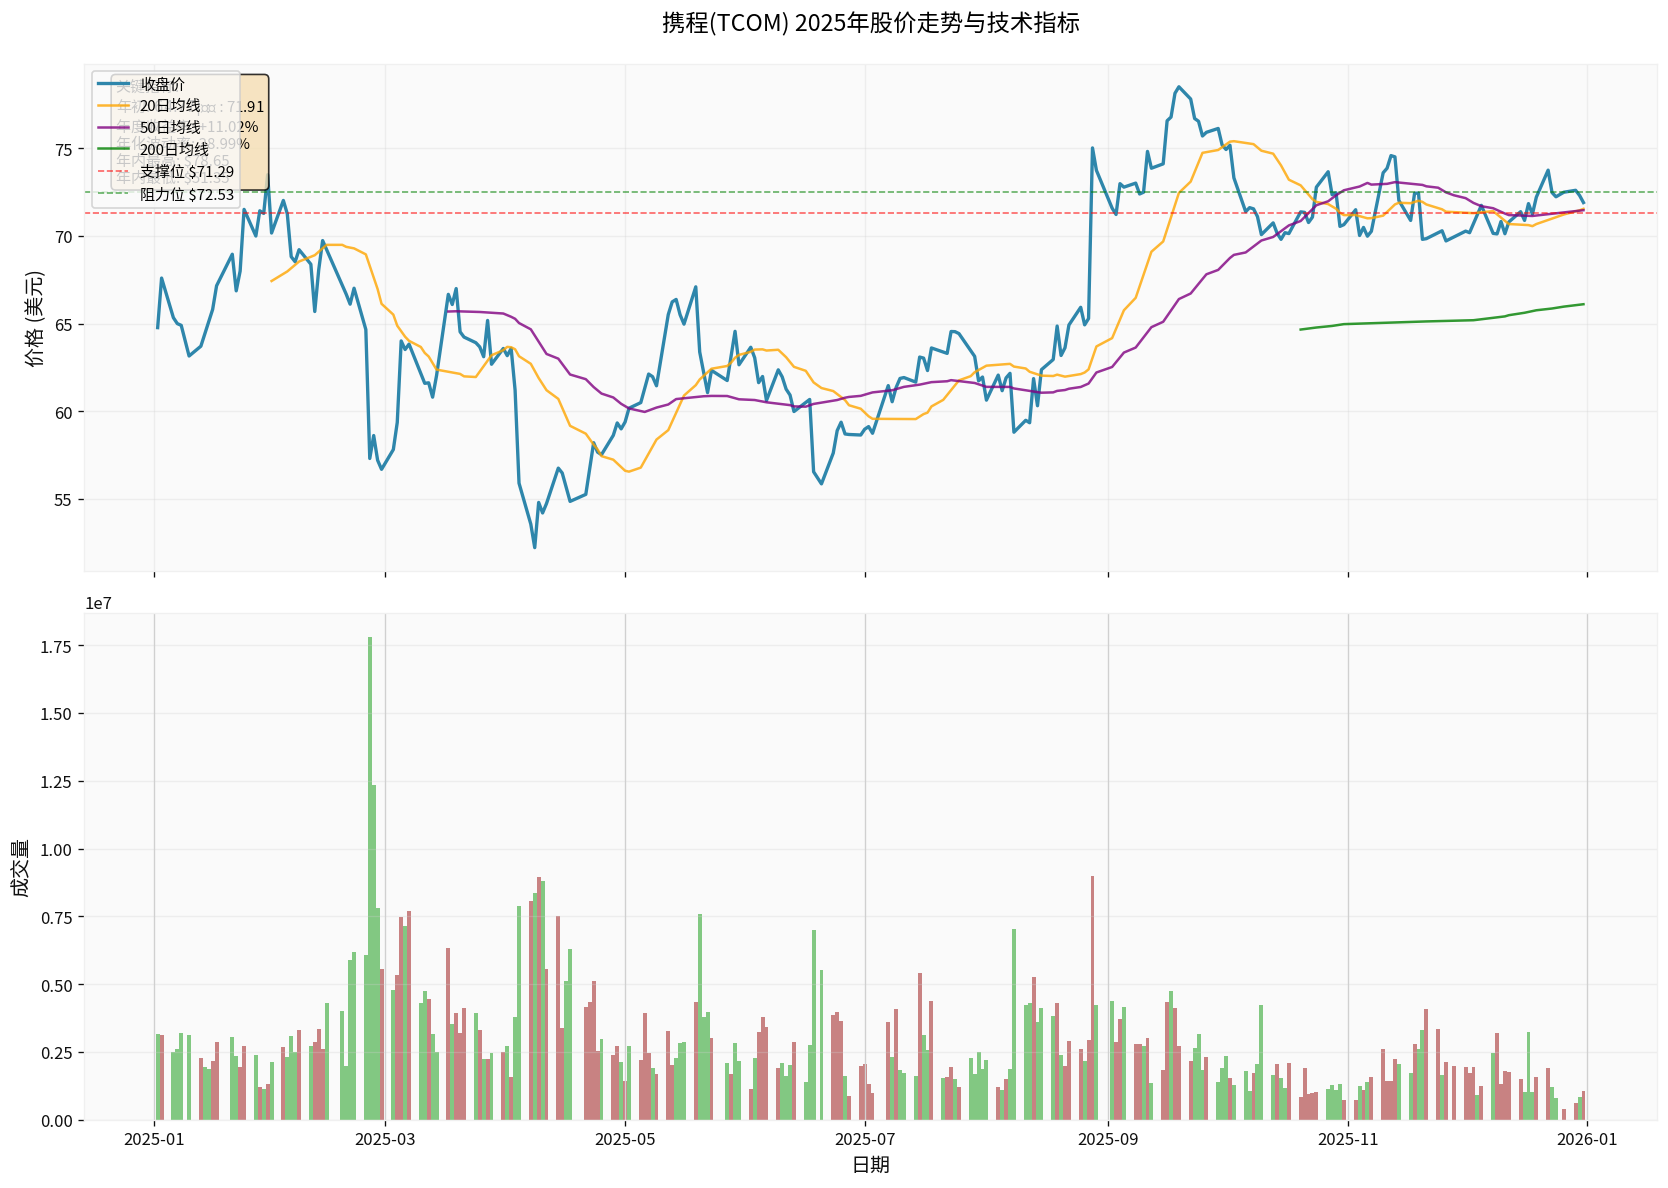
Technical indicators show [0]:
- Trend Judgment: Sideways consolidation, no clear direction
- Support Level: $71.29
- Resistance Level: $72.53
- Beta Coefficient: -0.13 (low correlation with market, independent trend)
- Annual Volatility:38.99% (medium-high volatility)
2025 Stock Price Performance [0]:
- Yearly High: $78.65
- Yearly Low: $51.35
- Price Range:53.2% (high volatility)
- Annual Return: +11.02%
According to DCF valuation model (three-scenario analysis) [0]:
| Scenario | Fair Value | Relative to Current Stock Price | Probability |
|---|---|---|---|
Conservative |
$110.52 | +48.4% | 30% |
Base Case |
$336.39 | +351.6% | 50% |
Optimistic |
$-516.98 | -794.0% | 20% |
- Revenue Growth Rate (5-year CAGR):30.6%
- EBITDA Margin:11.4%
- WACC:3.5%
- Beta Coefficient: -0.13
###3.1 Core Competitive Advantages
-
Brand and User Base
- Leader in China’s online travel market
- Large user ecosystem and loyalty
-
Supply Chain Control
- In-depth cooperation with hotels and airlines
- Strong exclusive resource acquisition capability
-
Technical Strength
- AI-driven personalized recommendations
- Big data analysis capability
###3.2 Innovation Layout: Trip Community Ecosystem
In December 2025, Ctrip launched the **
Insights are generated using AI models and historical data for informational purposes only. They do not constitute investment advice or recommendations. Past performance is not indicative of future results.
About us: Ginlix AI is the AI Investment Copilot powered by real data, bridging advanced AI with professional financial databases to provide verifiable, truth-based answers. Please use the chat box below to ask any financial question.