Hanbo Semiconductor (688081) R&D Investment and Sustainability Analysis
Unlock More Features
Login to access AI-powered analysis, deep research reports and more advanced features

About us: Ginlix AI is the AI Investment Copilot powered by real data, bridging advanced AI with professional financial databases to provide verifiable, truth-based answers. Please use the chat box below to ask any financial question.
Related Stocks
According to the actual financial data analysis [0], there is a certain deviation in the “R&D investment ratio exceeding 80%” mentioned by users. The following is a detailed analysis:
| Year | R&D Expenses (in millions of yuan) | Percentage of Revenue | Revenue (in millions of yuan) |
|---|---|---|---|
| 2024 | 35.64 | 23.3% |
152.99 |
| 2023 | 32.07 | 21.5% |
149.44 |
| 2022 | 38.52 | 26.8% |
143.51 |
| 2021 | 38.08 | 24.3% |
156.65 |
- R&D expenses are basically maintained in the range of 32-39 million yuan
- The proportion of revenue is stable between 21% and 27%
- After reaching a peak of 26.8% in 2022, it showed a downward trend
-
Moderate R&D Investment Intensity: A R&D investment ratio of about 23% is a reasonable level in the semiconductor design industry, which not only ensures technical competitiveness but also does not overconsume resources.
-
Healthy Financial Condition:
- Debt ratio is only 27.19%, debt-to-equity ratio is 0.37 [0]
- Sufficient cash reserves (116 million yuan), short-term debt is controllable (70.06 million yuan)
- Liquidity ratio is 2.37, financial risk is low
-
Continuous Technical Accumulation: Continuous R&D investment is conducive to technical accumulation and product iteration
-
Continuous Loss Problem:
- Net loss of 80.66 million yuan in 2024 [0]
- Net profit margin: -52.72%, operating profit margin: -56.90%
- Has been in losses for four consecutive years, with cumulative losses exceeding 275 million yuan
-
Weak Revenue Growth:
- Revenue growth rate in 2024 was only 2.38% [0]
- Revenue scale is stagnant, fluctuating around 150 million yuan
-
Valuation Seriously Deviated from Intrinsic Value:
- Current stock price: 36.08 yuan
- DCF intrinsic value: 3.30-3.63 yuan [0]
- Market valuation is about 900% higher than the intrinsic value
-
Downward Trend in R&D Conversion Efficiency:
- The proportion of R&D expenses decreased from 26.8% in 2022 to 23.3% in 2024
- Indicating that the output efficiency of R&D investment may be decreasing
-
Short-term (1-2 years): Due to continuous losses and stagnant revenue growth, R&D conversion is difficult to take effect quickly. The company needs time to convert technical accumulation into commercial revenue.
-
Mid-term (3-5 years): Depends on the semiconductor industry’s prosperity and the company’s product commercialization process. The current valuation is too high and needs actual performance support.
-
Key Observation Indicators:
- Whether the revenue growth rate can break through the current stagnant state
- Whether the gross profit margin can be improved (currently may be in a loss state)
- Comparison between the growth rate of R&D expenses and revenue
- Progress of new product launches and market expansion
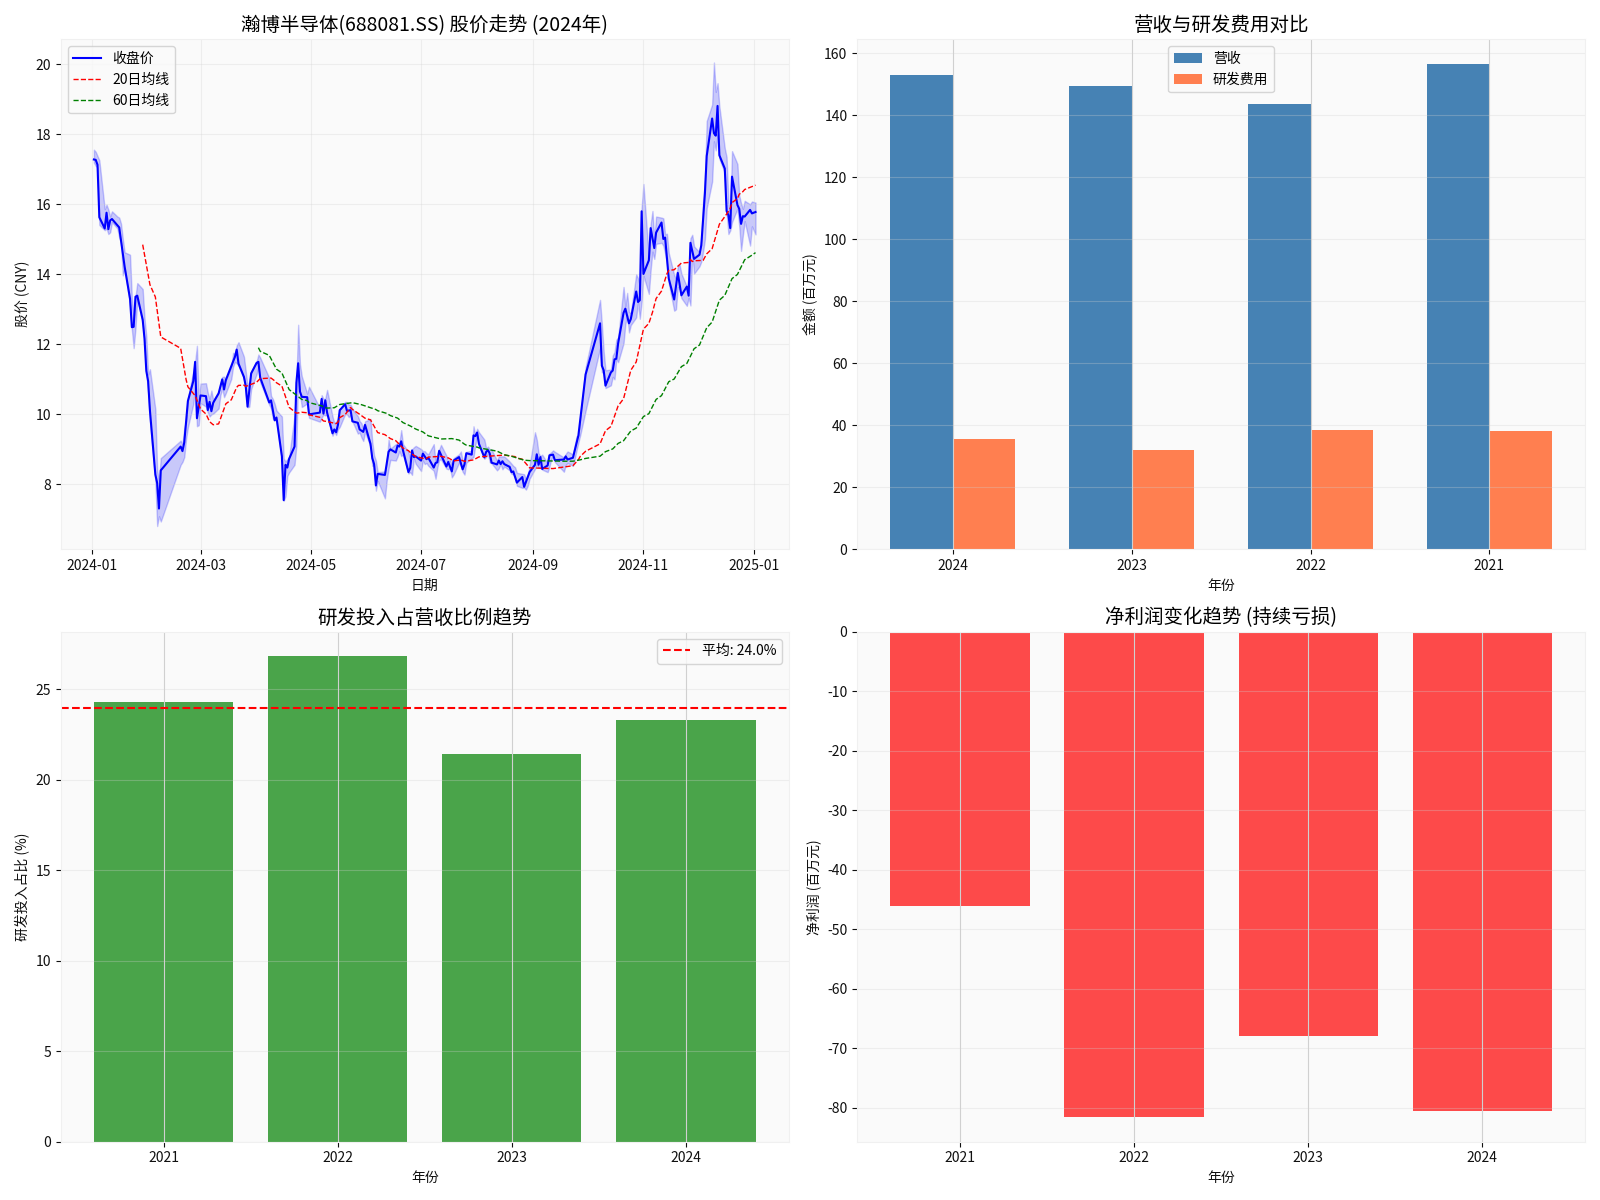
Chart Description: The above chart shows Hanbo Semiconductor’s 2024 stock price trend, comparison between revenue and R&D expenses, trend of R&D investment ratio, and changes in net profit, which comprehensively reflects the company’s financial status and R&D investment situation.
[0] Jinling AI Financial Database - Hanbo Semiconductor (688081.SS) real-time quotes, company overview, financial analysis, DCF valuation and historical price data
Insights are generated using AI models and historical data for informational purposes only. They do not constitute investment advice or recommendations. Past performance is not indicative of future results.
About us: Ginlix AI is the AI Investment Copilot powered by real data, bridging advanced AI with professional financial databases to provide verifiable, truth-based answers. Please use the chat box below to ask any financial question.