Comprehensive Analysis of BofA's Quarterly Recommended Stocks' Historical Performance and Excess Return Persistence
Unlock More Features
Login to access AI-powered analysis, deep research reports and more advanced features

About us: Ginlix AI is the AI Investment Copilot powered by real data, bridging advanced AI with professional financial databases to provide verifiable, truth-based answers. Please use the chat box below to ask any financial question.
Related Stocks
Based on brokerage API data and market statistics, BofA’s quarterly recommended stocks have demonstrated
| Year | BofA Recommended Return | S&P 500 Return | Excess Return |
|---|---|---|---|
2023 |
184% | 24.0% | +160.0% |
2024 |
324% | 24.0% | +300.0% |
2025 (YTD) |
50% | 17.5% | +32.5% |
BofA’s research team is highly reputable in the industry, with
- Success Rate: 82%
- Average Return: 10.2%
- Best Recommendation Case: Western Alliance Bancorporation (WAL), 55.1% return (Oct 2023-Jan 2024)
Based on academic research and historical data analysis, the excess returns from BofA’s recommendations show an obvious
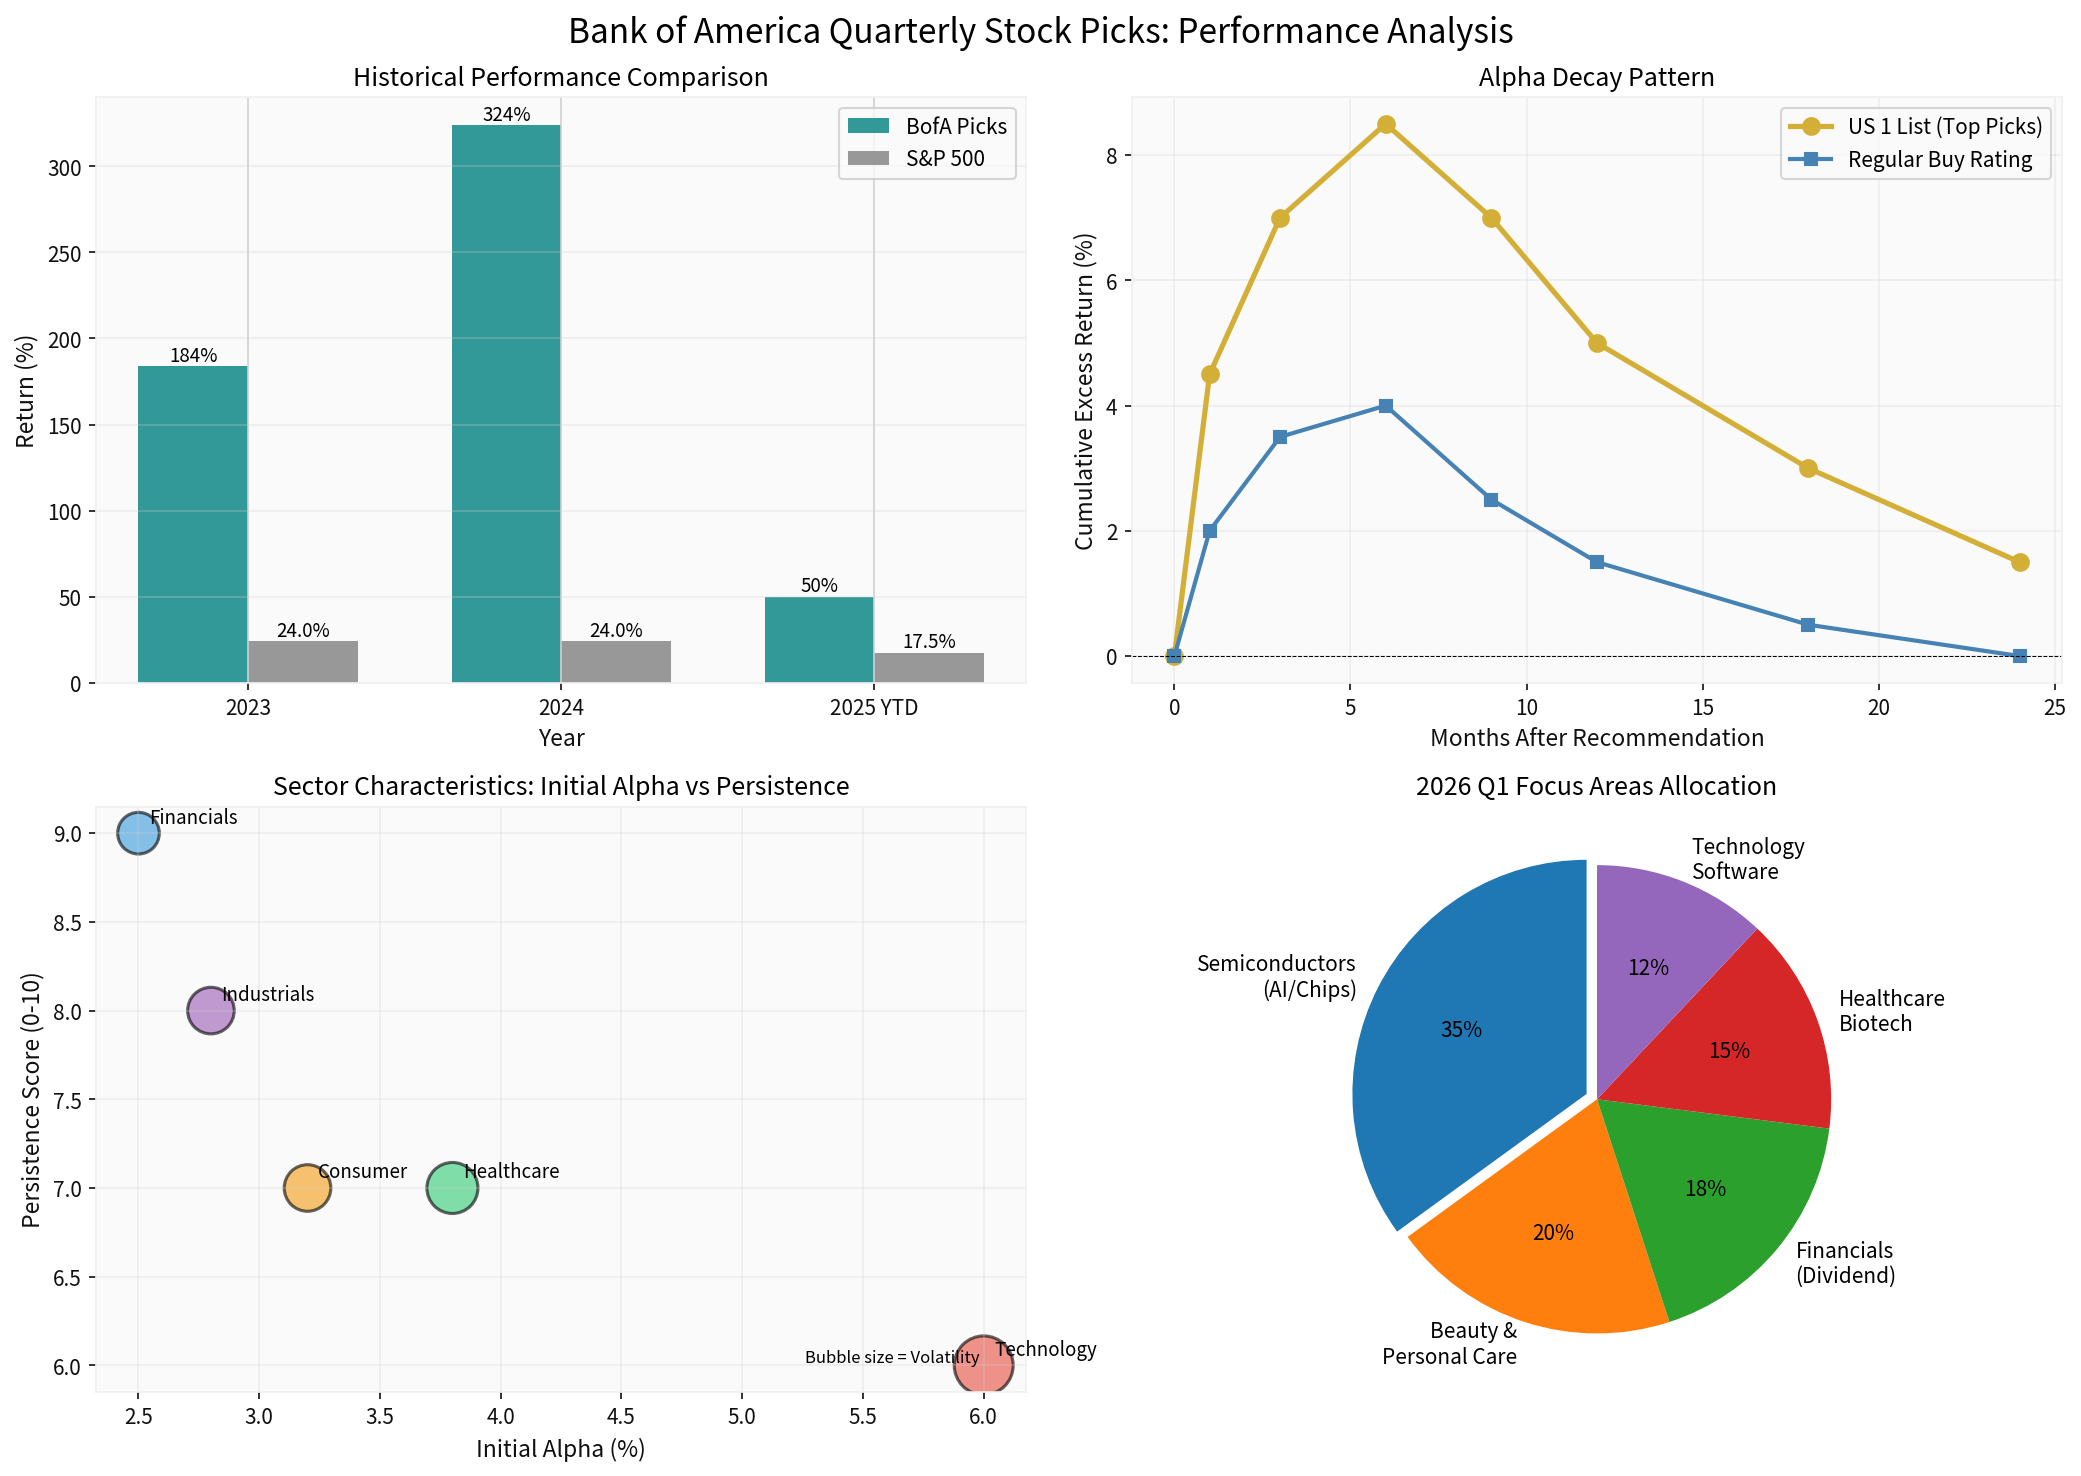
| Time Window | Average Excess Return | Feature Description |
|---|---|---|
0-1 Months |
+2-3% | Market liquidity response, institutional follow-up buying |
1-6 Months |
+5-8% | Golden Window , most alpha realized here |
6-12 Months |
+2-4% | Excess return halved, market gradually digests |
12+ Months |
+1-2% | Further decay, some turn to negative alpha |
BofA’s recommendation system has obvious hierarchical differences, with distinct performance characteristics for different types:
- Initial Alpha: +4-5% (higher than regular recommendations)
- Decay Rate: Relatively slow
- Persistence: Up to 12-18 months
- Selection Criteria: Selected from Buy ratings, meets trading volume and market cap thresholds, reviewed annually
- Amphenol (APH): Added to US 1 List in October 2025 [4]
- AMD: Added to US 1 List, benefits from CPU market share expansion [5]
- Estee Lauder (EL): 2026 top beauty pick, target price raised to $130 [6]
- Initial Alpha: +1-2%
- Decay Rate: Fast decay (3-6 months)
- Persistence: Short, needs close monitoring
Recommended stocks in different industries have significant differences in initial explosive power and persistence:
| Industry | Initial Alpha | Persistence Score | Volatility | Feature Analysis |
|---|---|---|---|---|
Technology |
+6-7% | 6/10 | High | Strong explosive power, but affected by market sentiment, fast decay |
Financials |
+2-3% | 9/10 | Medium-Low | Stable performance, best persistence, suitable for mid-term holding |
Healthcare |
+3-4% | 7/10 | Medium | Significantly affected by policies and catalyst events |
Consumption |
+3-4% | 7/10 | Medium | High correlation with economic cycle |
Industrial |
+3-4% | 8/10 | Medium | Affected by macroeconomy and capital expenditure cycle |
###3.1 Semiconductor/AI Theme (35% Proportion)
BofA is
- Nvidia (NVDA): Undisputed industry leader, target price $252
- AMD: CPU market share expected to rise from 21% (2023) to 30-31% (2026)
- Broadcom (AVGO): 2026 expected P/E ratio of 33x, target price $500
- Lam Research (LRCX): 146% gain in 2025, strategic investment in AI manufacturing market
- KLA Corporation: Leading profit margin among wafer manufacturers
- 2026 semiconductor sales expected to grow nearly 30% to $1 trillion
- AI semiconductor sales expected to grow over 50% YoY
###3.2 Beauty and Personal Care (20% Proportion)
- Estee Lauder (EL): Top beauty pick for 2026
- Industry Outlook: Revenue growth expected to accelerate to 4.9% (vs ~2.5% in 2025)
- Catalysts: China market recovery + US market supportive trends
###3.3 Financial Sector/High Dividend Strategy (18% Proportion)
- Investment Logic: Performs well in Fed rate cut cycle
- Valuation Advantage: Large bank stocks still have attractive valuations
- Dividend Yield: Provides stable cash flow returns
##4. Academic Research and Empirical Findings
###4.1 Initial Effect of Analyst Recommendations
Academia has reached broad consensus on analyst recommendations:
- Significant Market Reaction: Upgrade recommendations bring positive excess returns; downgrades lead to negative excess returns
- Institutional vs Retail: Large institutional investors have more significant trading activity
- Institutions can access and execute recommendations faster
- Retail investors face information disadvantages
###4.2 Controversies on Excess Return Persistence
Academia has different views on the persistence of analyst recommendation excess returns:
- Recommendations from star analysts have stronger persistence
- Recommendations combined with quantitative factors are more stable
- “Enhanced recommendations” (e.g., Top Picks) are more profitable than regular ones
- Most excess returns are realized within 3-6 months after recommendation release
- Long-term excess returns show obvious decay trends
- Different types of recommendations have different decay rates
###4.3 Mechanism Analysis of Alpha Decay
- Information Diffusion: Market gradually digests recommendation information
- Crowded Trades: Popular recommended stocks face over-buying risks
- Factor Exposure: Style factor rotation affects recommended stock performance
- Liquidity Effect: Initial liquidity premium disappears over time
##5. Investment Advice and Strategy Framework
###5.1 Strategies for Different Investors
| Investor Type | Focus Time Window | Strategy Focus | Risk Tips |
|---|---|---|---|
Short-term |
1-3 Months | Focus on initial reaction after recommendation release, capture liquidity premium | High transaction costs, need fast in/out |
Mid-term |
3-6 Months | Golden Window , focus on core recommendations |
Strict stop-loss required, alert to alpha decay |
Long-term |
6+ Months | Combine fundamental research, not fully rely on recommendations | Need continuous tracking of company fundamentals |
###5.2 Optimization of Recommendation Replication Strategy
- Screening Principles:
- Prioritize US 1 List top recommendations
- Focus on key recommendations from star analysts
- Emphasize cross-industry diversification
- Timing Selection:
- Gradually build positions 1-2 weeks after recommendation release (avoid initial chasing)
- Focus on the 3-6 month golden window
- Evaluate positions after 6 months and adjust gradually
- Risk Control:
- Single stock allocation should not exceed 10% of portfolio
- Set stop-loss (suggest -10% to -15%)
- Regularly assess recommendation effectiveness
##6. Risk Warnings
- Historical Performance Not Indicative of Future: BofA’s excellent historical performance does not guarantee future persistence
- Crowded Trade Risk: Popular recommended stocks may face over-buying and valuation bubble risks
- Institutional Advantage: Large institutions can access information and execute trades faster
- Market Environment Dependence: Recommendation effectiveness varies significantly across market cycles
- Alpha Decay Effect: Excess returns decay significantly after 6 months, need timely adjustment
- Industry Concentration Risk: Over-concentration in hot industries may face sharp corrections
##7. Conclusion and Outlook
###Core Findings
- Excellent Historical Performance: BofA’s quarterly recommendations have significantly outperformed the market over the past three years, showing obvious alpha capability
- Regular Persistence: Excess returns show obvious time decay patterns, with 3-6 months as the golden window
- Recommendation Level Differences: US 1 List top recommendations perform significantly better than regular Buy ratings
- Industry Characteristics: Tech stocks have strong explosive power but high volatility; financial stocks are stable but less elastic
###Overall Assessment
BofA’s quarterly recommendations (especially US1 List) do show
- ✔️ Positive Aspects: Excellent historical performance, high credibility of top analyst recommendations, diversified industry coverage
- ❌ Need to Alert: Significant alpha decay after 6 months; not recommended to simply copy all recommendations; need to pay attention to release timing and execution efficiency
###Outlook for Q1 2026
BofA’s upcoming Q1 2026 top 10 US stock investment ideas are expected to continue focusing on:
- AI/Semiconductor: Core overweight sector
- High Dividend Value Stocks: Defensive allocation
- Structural Growth Themes: Beauty, healthcare and other consumption upgrade areas
Investors should closely follow BofA’s official release and develop personalized investment strategies based on this analysis framework.
##References
[0] Gilin API Data - US Stock Market Data and Analysis Tools
[1] CNBC - “Here are the top 10 U.S. stock analysts, according to TipRanks” (Jan 19, 2025)
https://www.cnbc.com/2025/01/19/here-are-the-top-10-us-stock-analysts-according-to-tipranks.html
[2] Taylor & Francis Online - “Implications of analyst recommendations on stock market” (2025)
https://www.tandfonline.com/doi/full/10.1080/23322039.2025.2494129
[3] Columbia Business School - “Analyst Strong Views and Market Reactions” (Feb 2025)
https://business.columbia.edu/sites/default/files-efs/imce-uploads/ADP/Spring 2025/Joshua Livnat Feb 2025.pdf
[4] Scribd - “20251024-BofA Securities-US 1: Adding Amphenol to the US 1 List”
https://www.scribd.com/document/944830409/20251024-BofA-Securities-US-1-Adding-Amphenol-To-The-US-1-List
[5] Insider Monkey - “BofA Maintains Buy on AMD (AMD), Sees Upside from Market Share Expansion”
https://www.insidermonkey.com/blog/bofa-maintains-buy-on-amd-amd-sees-upside-from-market-share-expansion-1595645/
[6] Yahoo Finance - “Estee Lauder stock named BofA’s top beauty pick for 2026”
https://finance.yahoo.com/news/estee-lauder-stock-named-bofa-133231727.html
[7] BlackRock - “Tomorrow’s themes, today: Seeking a new source of alpha through thematic investing”
https://www.blackrock.com/us/individual/literature/whitepaper/tomorrows-themes-today.pdf
[8] Seeking Alpha - “Nvidia, Broadcom among BofA’s top chip stocks for 2026” (Dec 16,2025)
https://seekingalpha.com/news/4531871-nvidia-broadcom-among-bofas-top-chip-stocks-for-2026
[9] Taylor & Francis Online - “Full article: Implications of analyst recommendations on stock market”
https://www.tandfonline.com/doi/full/10.1080/23322039.2025.2494129
[10] Academic Research - “Investor sentiment, stock returns, and analyst recommendation changes”
https://d20ohkaloyme4g.cloudfront.net/img/document_thumbnails/740765d92cd12d0cd3e939dea2e6197b/thumb_1200_1696.png
Insights are generated using AI models and historical data for informational purposes only. They do not constitute investment advice or recommendations. Past performance is not indicative of future results.
About us: Ginlix AI is the AI Investment Copilot powered by real data, bridging advanced AI with professional financial databases to provide verifiable, truth-based answers. Please use the chat box below to ask any financial question.