In-depth Analysis of Under Armour's Turnaround Potential: Can It Achieve Growth in a Giant-Dominated Market?
Unlock More Features
Login to access AI-powered analysis, deep research reports and more advanced features

About us: Ginlix AI is the AI Investment Copilot powered by real data, bridging advanced AI with professional financial databases to provide verifiable, truth-based answers. Please use the chat box below to ask any financial question.
Related Stocks
Based on comprehensive analysis, Under Armour shows

- Under Armour: Market cap $229 million, past 1-year stock price -34.26%, past 3-year -47.22%, past5-year -69.31%
- Nike: Market cap $92.68 billion (40x UAA), past1-year -14.89%, past3-year -47.20%
- Lululemon: Market cap $23.47 billion (10x UAA), past1-year -43.69%
| Financial Indicator | Under Armour | Nike | Lululemon |
|---|---|---|---|
| Net Margin | -1.74% |
5.43% | 15.72% |
| ROE | -4.61% |
18.43% | 39.22% |
| Operating Margin | -0.76% |
6.54% | 22.04% |
| P/E Ratio | -26.02x | 36.68x | 14.28x |
- Under Armour is the only loss-making companyamong the three; negative margin and ROE reflect core business challenges.
- Lululemon’s profitability far exceeds the other two, with its 15.72% net margin and39.22% ROE indicating the success of its premium strategy.
- Nike has the highest P/E ratio (36.68x), reflecting market confidence in its long-term growth despite recent poor performance.
###2.1 Core Elements of “Brand First” Strategy
According to the latest public information, Under Armour is implementing the following strategic transformations [1]:
- Reduce reliance on discounts and increase full-price sales ratio
- Streamline SKU (stock keeping unit) quantity and focus on core product lines
- Raise average selling price (ASP)
- Strengthen brand narrative and marketing communication
- Re-emphasize the core positioning of “performance sports”
- Focus on brand asset building
- North America Market: Stabilize and “restructure” the brand
- EMEA Market: Achieved 12% growth in Q2 2025, becoming a highlight [1]
- Asia-Pacific Market: Continuous investment but faces challenges
###2.2 Restructuring Plan Progress
- Expand 2025 FY restructuring plan, adding $95 million in expenses
- Split Curry Brand as an independent business unit
- 2026 FY adjusted operating profit forecast raised to $95-110 million[1]
- Cost reduction and operational efficiency measures start to show effects
- 2026 FY revenue expected to decline by4%-5%
- GAAP operating loss expected to be $56-71 million
- Adjusted operating profit $95-110 million (showing improvement in core business)
###2.3 Strategic Execution Risks
-
Brand Relevance Dilemma: Under Armour’s “performance sports” positioning faces challenges as consumer preferences shift to “athleisure” and fashion-oriented styles [1]
-
Lack of Pricing Power: Morningstar analysts point out that due to lack of pricing power, Under Armour struggles to offset increased tariff costs (about $100 million) through price hikes [1]
-
Sustained Pressure on North American Business: As the largest market (accounting for60.2% of revenue), the North American business is still declining, which is a key bottleneck for turnaround
-
Intense Competition in International Markets: Although EMEA achieved growth, Euromonitor data shows that the Asia-Pacific and Western European sportswear markets合计约$186 billion (exceeding North America’s $167 billion), while Under Armour accounts for only36% of revenue in these regions, facing fierce competition from global and local operators [1]
##3. Market Competitiveness Assessment
###3.1 Industry Landscape
- Market size: $173.19 billion (2024: $164.45 billion)
- Expected growth: Reach $224.32 billion by2030, CAGR 5.31% [2]
- Nike:24.87% (absolute leader)
- Adidas:14.38%
- Lululemon:5.93%
- Under Armour: Not in top5 (estimated <3%)
- “Tech-Lifestyle” Integration: Consumers demand products that are both fashionable and have real performance specifications [2]
- DTC Model Rebalancing: Nike returns to a “hybrid” model from “DTC priority”, showing the limitations of pure DTC strategy [2]
- Rise of Professional Brands: On Holding and Hoka have moved from niche running brands to mainstream, occupying the premium wholesale space temporarily abandoned by Nike [2]
###3.2 Under Armour’s Competitive Disadvantages
| Dimension | Nike | Under Armour |
|---|---|---|
| Market Share | 24.87% | <3% |
| Brand Awareness | Global first tier | Second tier |
| Marketing Budget | Billions of dollars | Limited (financially constrained) |
| Athlete Endorsements | Top athlete lineup | Stephen Curry (partnership ends in2026) |
| R&D Investment | Industry leading | Constrained by financial status |
- Brand Power Gap: Nike’s brand value and global influence are hard to replicate in the short term
- Distribution Network: Nike’s global distribution channels are far deeper and wider than Under Armour’s
- Financial Resources: Nike’s market cap and cash flow allow continuous large-scale investment in marketing and R&D
###3.3 Potential Opportunity Windows
- Nike also faces growth pressure (past1-year -14.89%, 3-year -47.20%) [0]
- Nike’s “hybrid model” transformation may leave wholesale channel space for competitors
- Adidas is recovering but focuses on European markets, possibly ignoring certain segments
- Performance Segment: Focus on professional sports and training fields, avoid direct competition with Nike in the mass market
- Cost-Effectiveness Advantage: Mid-market positioning, avoid direct competition with Lululemon in the high-end market
- Specific Regional Growth: EMEA has proven its ability to achieve double-digit growth
- Digital Channel Innovation: Seek breakthroughs in DTC and e-commerce fields
##4. Recent Catalysts and Investor Sentiment
###4.1 Key Catalysts
-
Fairfax Financial’s Significant Stake Increase
- Stake ratio increased from ~12% to 16.1%[3]
- Continuous buying in late December, including 15.7 million shares增持 from Dec22-29 at an average price of $4.53 [3]
- Endorsement from value investor Prem Watsa (“Canada’s Warren Buffett”)
- Stake ratio increased from ~12% to
-
UBS Reiterates Buy Rating[3]
-
Q22025 Earnings Beat Expectations
- EPS: $0.04 vs expected $0.02 (100% beat) [3]
- Gross margin:47.3%, exceeding market consensus [3]
-
Founder’s Renewed Focus
- Kevin Plank publicly committed to “focus on rebuilding a stronger Under Armour” [3]
- Reduce daily participation in the Baltimore Peninsula project and focus on core business
- S&P Global places Under Armour on credit watch negative [3]
- Revenue continues to decline (5% drop in latest quarter) [1]
- Partnership with Stephen Curry ends in2026 [3]
###4.2 Stock Price Performance and Technical Analysis
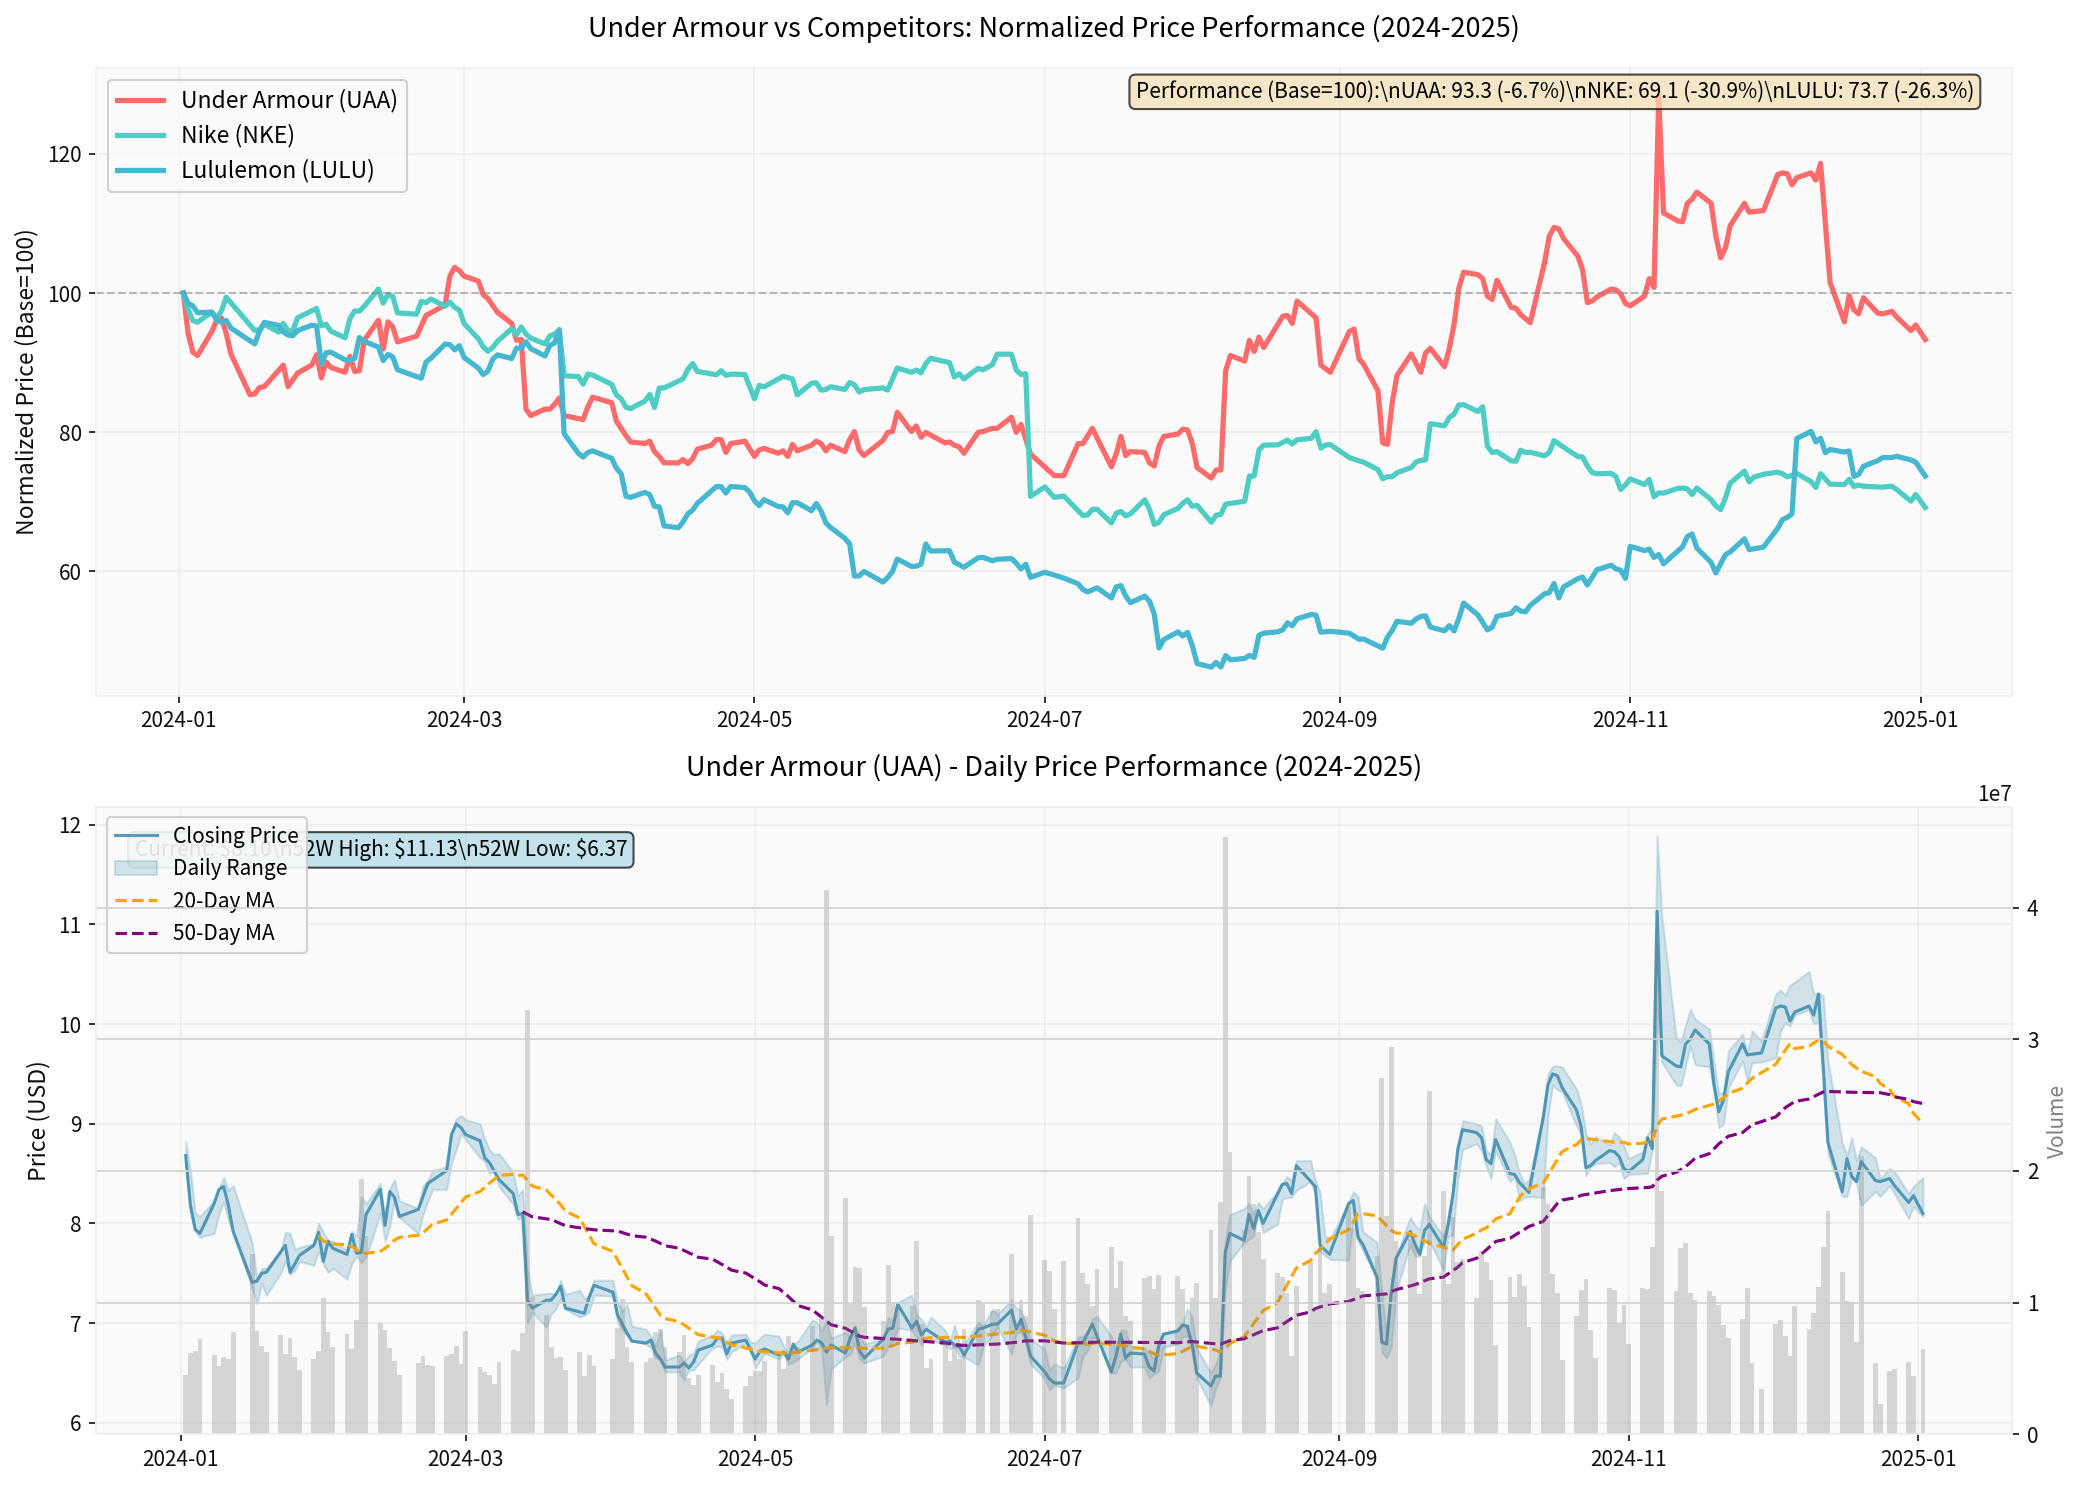
- Top Chart: Shows the standardized price performance of the three companies from2024-2025. Under Armour (-6.68%) outperformed Nike (-30.86%) and Lululemon (-26.33%)
- Bottom Chart: Shows Under Armour’s detailed price trend, including closing price, 20-day and50-day moving averages, and trading volume. Current price is $8.10 (historical closing price), far below the 52-week high of $11.89
- Trend: Sideways consolidation, no clear direction
- Support Level: $7.91
- Resistance Level: $9.00
- KDJ: Oversold area, indicating rebound opportunity
- Beta:1.83 (high volatility, high risk)
##5. Valuation Analysis
###5.1 Current Valuation Levels
| Valuation Indicator | Under Armour | Nike | Lululemon |
|---|---|---|---|
| P/E Ratio | -26.02x (loss-making) | 36.68x | 14.28x |
| P/B Ratio | 1.23x | 6.57x | 5.23x |
| P/S Ratio | 0.45x | N/A | N/A |
| EV/OCF | 43.00x | 31.71x | 12.68x |
- P/B 1.23x: Close to book value, indicating the market has priced in a lot of negative expectations
- P/S0.45x: Relatively low, but considering negative margin, it may still not be “cheap”
- Comparison: Nike and Lululemon’s P/B multiples are far higher than UAA, reflecting their profitability and growth prospects
###5.2 Analyst Expectations and Target Price
- Buy:21 people (28.8%)
- Hold:42 people (57.5%)
- Sell:10 people (13.7%)
- 2025-11-07: UBS maintains Buy [0]
-2025-11-07: Evercore ISI maintains “Underperform”
-2025-10-21: Citi maintains “Neutral”
##6. Scenario Analysis: Next18-24 Months
###6.1 Bull Case (Probability:30%)
- North American market stabilizes and resumes growth
- EMEA and Latin American markets continue double-digit growth
- Brand premiumization strategy significantly improves gross margin
- Macroeconomic environment is favorable for consumption recovery
- 2026 FY revenue decline narrows to -2% to 0%
- 2027 FY resumes positive growth of3-5%
- Net margin turns positive to1-2%
- Stock price回升 to $8-10 range
###6.2 Base Case (Probability:50%)
- Turnaround progresses slowly but steadily
- North American market continues to decline but at a narrower rate
- International markets grow moderately
- Profitability gradually improves but remains slightly profitable
-2026 FY revenue declines by4-5% (in line with company guidance)
-2027 FY resumes low single-digit growth
- Net margin approaches break-even
- Stock price fluctuates in $5-7 range
###6.3 Bear Case (Probability:20%)
- North American market declines accelerated
- Tariff and cost pressures intensify
- Brand premiumization fails, forced to continue discounting to clear inventory
- Macroeconomic recession hits consumer spending
- Revenue continues double-digit decline
- Losses expand
- May need further financing or cost cuts
- Stock price falls below $5, testing 52-week low of $4.13
##7. Investment Recommendations and Conclusions
###7.1 Turnaround Potential Assessment
- ✅ Sufficient Financial Buffer: Healthy liquidity (current ratio1.69) buys time for turnaround
- ✅ Clear Strategic Direction: “Brand First” and premiumization strategies are logically sound
- ✅ Early Success Signs: Double-digit growth in EMEA, Q2 earnings beat expectations
- ✅ Institutional Investor Support: Fairfax’s16.1% stake and UBS’s Buy rating provide confidence
- ✅ Relative Stock Performance: Less underperformance than competitors in2024-2025, showing partial market recognition
- ❌ Huge Scale Disadvantage: Market cap is only1/40 of Nike’s, hard to match marketing and R&D investment
- ❌ Insufficient Brand Power: Lack of global top-tier brand awareness and loyalty
- ❌ Negative Profitability: Negative margin and ROE, hard to achieve sustainable growth
- ❌ Core Market Shrinkage: North American market continues to decline, not yet bottoming out
- ❌ High Execution Risk: Turnaround strategy requires perfect execution with low tolerance for errors
###7.2 Investment Recommendations
- Investors with high risk tolerance
— tags (codes, translate to display labels) —
turnaround_analysis, sports_apparel, financial_analysis, market_competition, investment_research
— event_type (code, translate to display label) —
social_media
— sentiment (code, translate to display label) —
neutral
Insights are generated using AI models and historical data for informational purposes only. They do not constitute investment advice or recommendations. Past performance is not indicative of future results.
About us: Ginlix AI is the AI Investment Copilot powered by real data, bridging advanced AI with professional financial databases to provide verifiable, truth-based answers. Please use the chat box below to ask any financial question.