Analysis of the Impact of Asia's Manufacturing Order Recovery on the Investment Value of Export-Oriented Stocks
Unlock More Features
Login to access AI-powered analysis, deep research reports and more advanced features
About us: Ginlix AI is the AI Investment Copilot powered by real data, bridging advanced AI with professional financial databases to provide verifiable, truth-based answers. Please use the chat box below to ask any financial question.
Related Stocks
According to the latest data,
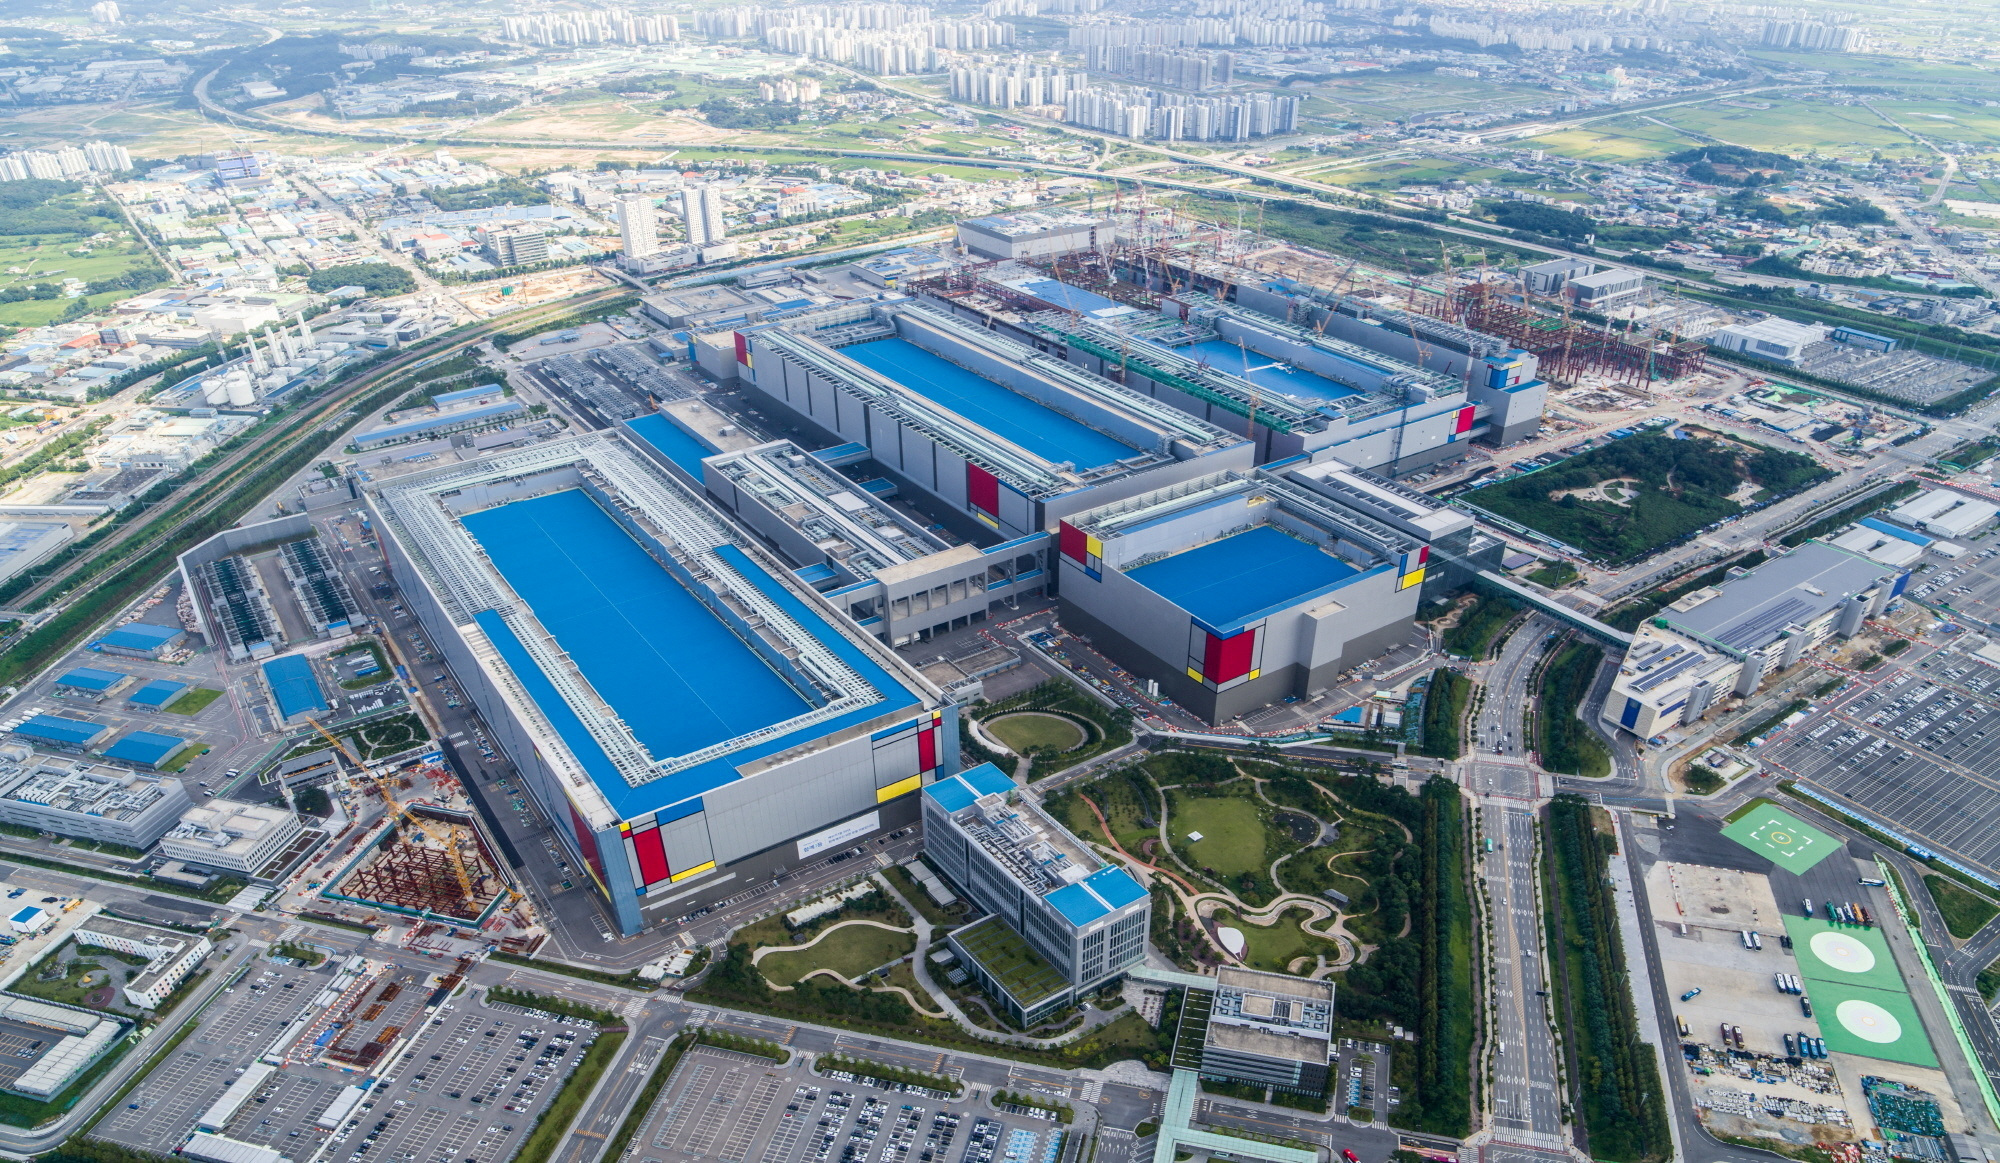
Major manufacturing powers in Asia performed more steadily at the end of 2025,
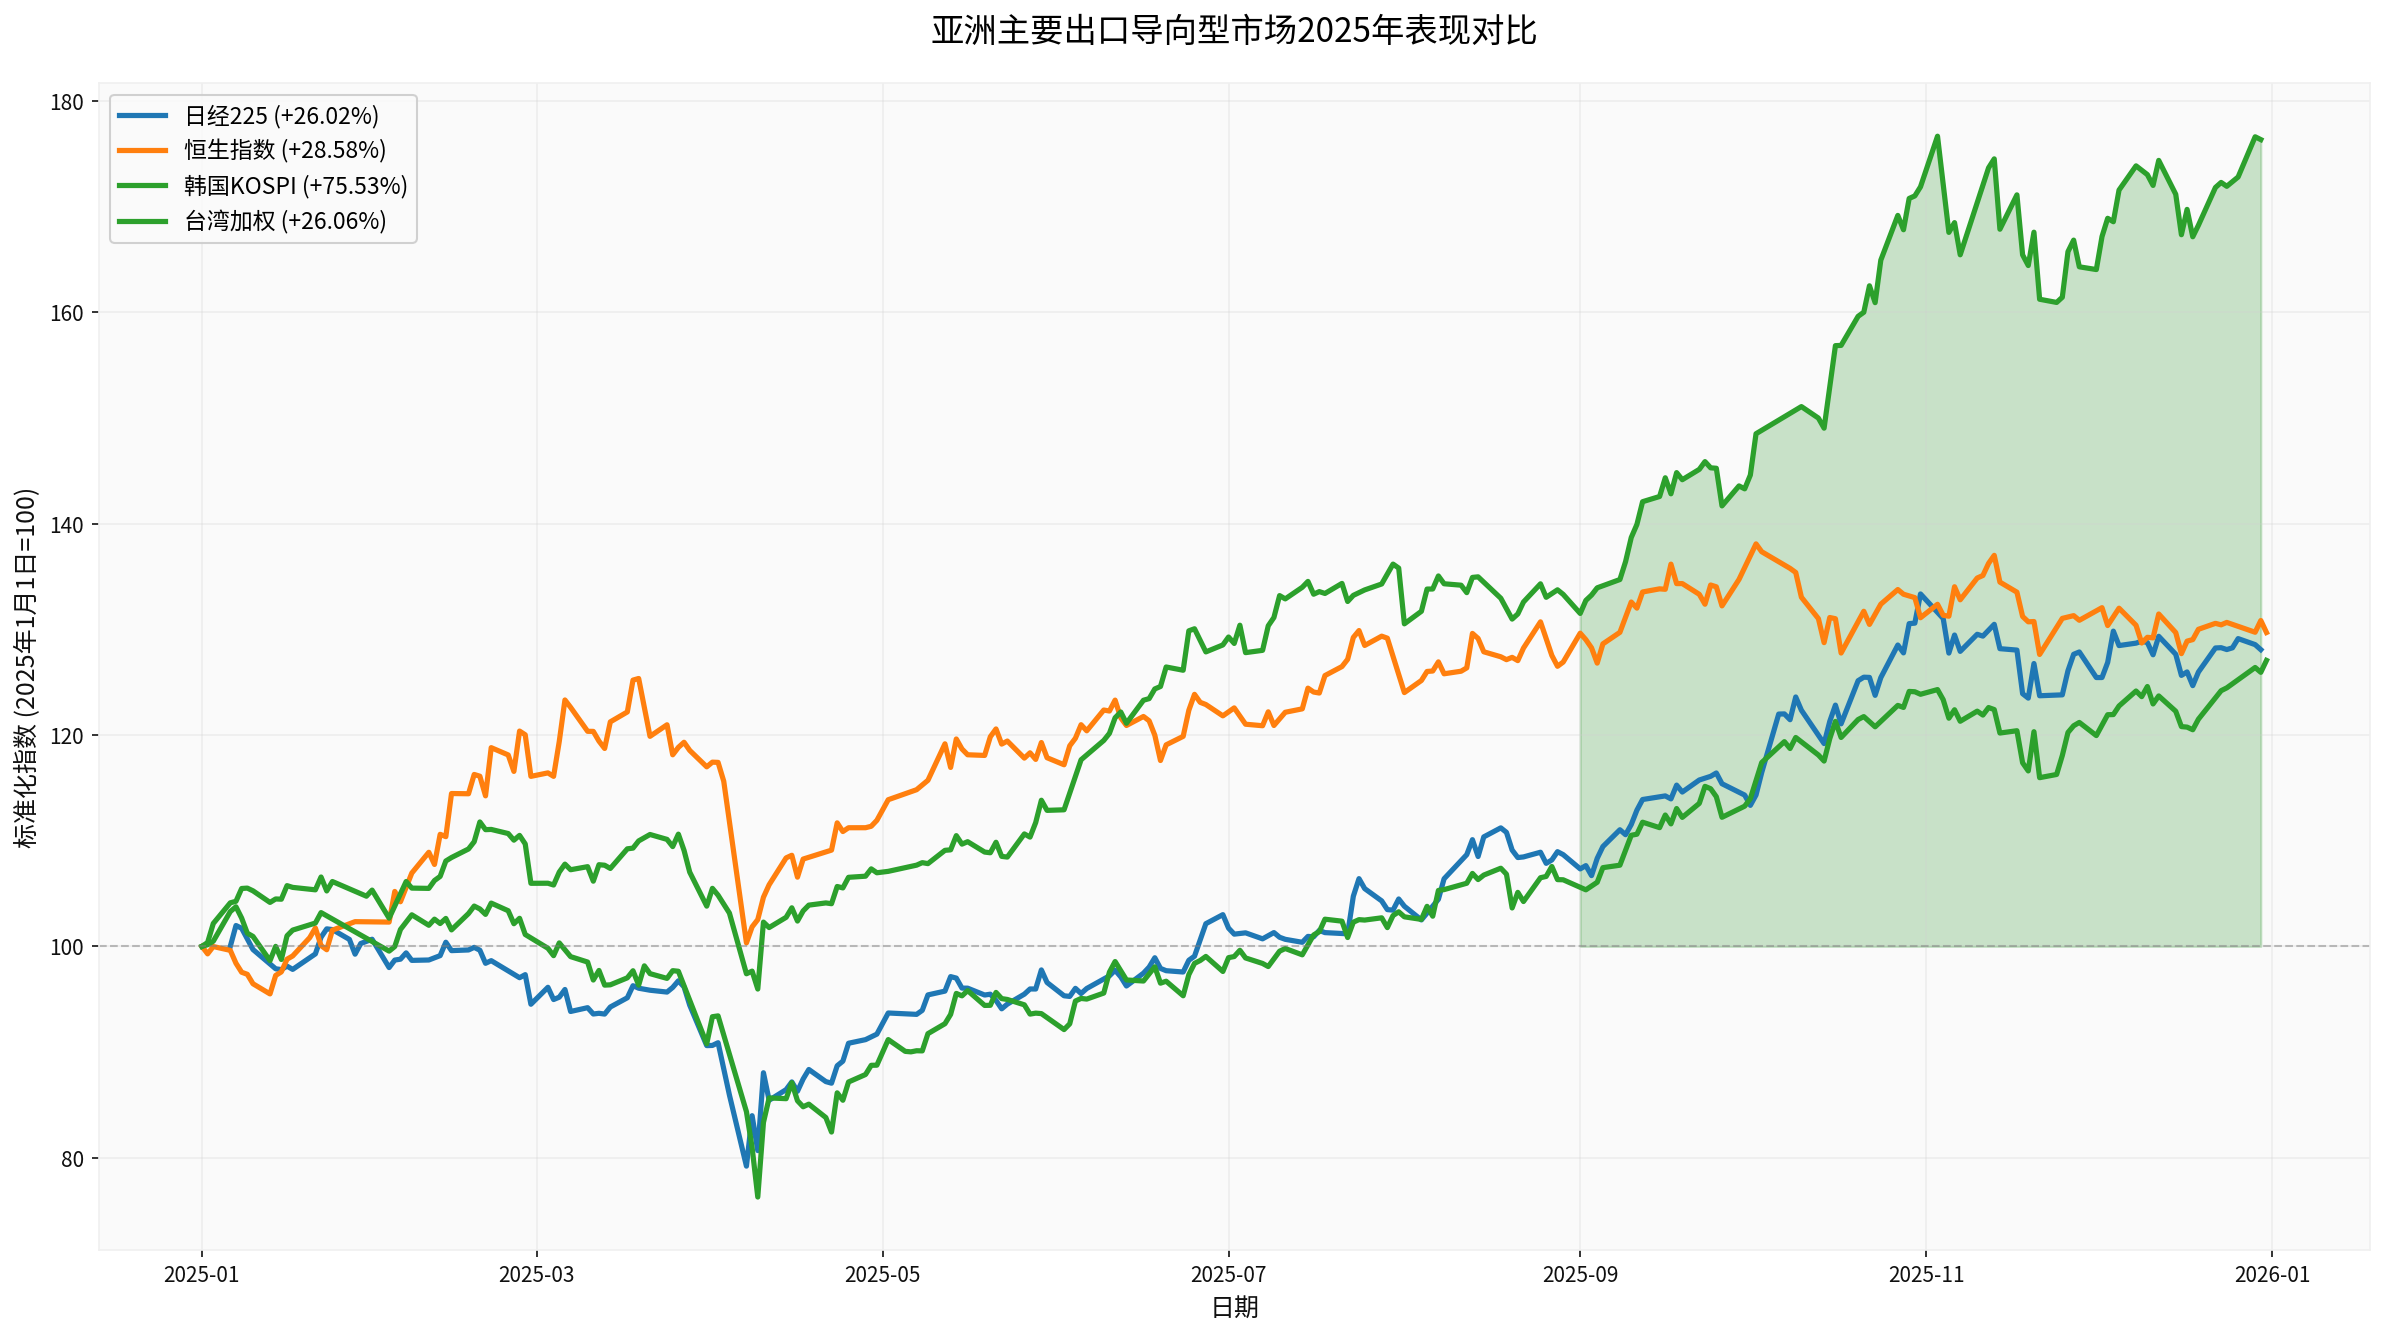
- South Korea KOSPI: +75.53%(Best performer, rose from 2,390 points to 4,214 points)
- Hong Kong Hang Seng Index: +28.58%(Rose from 19,763 points to 25,631 points)
- Taiwan Capitalization Weighted Stock Index: +26.06%(Rose from 22,797 points to 28,964 points)
- Nikkei 225 Index: +26.02%(Rose from 39,945 points to 50,339 points)
- Current Stock Price:$303.89 (Market cap: $1.58 trillion)
- Annual Gain:+50.75% (90-day gain: +29.70%)
- Profitability:ROE 34.52%, Net Profit Margin 43.70%, Operating Margin 49.51%
- Valuation Level:P/E 25.74x, P/B 8.17x
- Financial Health:Current Ratio 2.69, Quick Ratio 2.47
- Consensus Target Price:$357.50 (+17.6% from current price)
- Rating Distribution:72.7% of analysts gave a “Buy” rating
- Recent Ratings:Several institutions including Bernstein, Needham, and Barclays maintained “Overweight/Buy” ratings
- Current Stock Price:125,250 KRW (Market cap: 838.43 trillion KRW)
- Annual Gain:+134.83% (90-day gain: +78.32%)
- Profitability:ROE 8.39%, Net Profit Margin 10.38%, Operating Margin 9.51%
- Valuation Level:P/E 25.76x, P/B 2.17x
- Financial Health:Current Ratio 2.51, Quick Ratio 1.91
Japan’s export data shows that
Although BYD’s stock price corrected in the second half of 2025 (-14.44% in the past three months), the long-term growth logic of the new energy vehicle industry chain remains unchanged.
- AI chip demand has structural growth characteristics, not short-term cyclical fluctuations
- Industry leaders like TSMC and Samsung have technical moats and pricing power
- Relatively reasonable valuation:TSMC’s P/E of 25.74x is lower than the average level of U.S. tech giants
- Analyst consensus is bullish:72.7% of analysts gave TSMC a Buy rating
- Geopolitical risks (U.S.-China tech competition, chip export controls)
- Possible adjustment in AI investment cycle
- Valuations already reflect high growth expectations
- Electric vehicle penetration continues to rise, driving parts demand
- Strong growth in China’s new energy vehicle exports(global expansion of enterprises like BYD)
- However, short-term competition intensifies, and gross margins are under pressure (BYD’s operating margin is only 5.13%)
- Global economic slowdown may affect auto consumption
- Price wars continue to compress profit margins
- Geopolitical factors affect export markets
- Global AI capital expenditure is expected to exceed $500 billion in 2026 [8]
- Data center construction cycle is long (2-4 years), with sustained demand
- Power equipment has become a new bottleneck for AI development(instead of chips), with strong demand for related equipment [6]
- The International Energy Agency (IEA) predicts that the world will add more than 200 GW of gas-fired power generation capacity from 2025 to 2030, with nearly 60% concentrated in countries along the “Belt and Road” [6]
- China’s gas turbine enterprises’ export orders surged (Harbin Electric’s H1 2025 export orders reached 11.874 billion RMB, up 945.25% YoY) [6]
- Asian manufacturers continue to invest in automation and efficiency improvement
- Industrial chain cluster effect is obvious, and it is difficult to be replaced in the short term
- Trade protectionist policies may continue
- Technology export controls affect industrial chain layout
- The Bank of Korea warns that the global economic outlook faces uncertainties from changes in the global trade environment and semiconductor cycles [8]
- Monetary policies of major central banks remain uncertain
- Economic slowdown in Europe and the U.S. may affect export demand
- Debt pressure in emerging markets
- The semiconductor industry has obvious cyclicality, and the current upward cycle may be approaching the middle stage
- If AI investment falls short of expectations, it may lead to order adjustments
- Valuations in some markets are already high (South Korea KOSPI’s annual gain of +75.53%)
- South Korean markethas risen too much in the short term (KOSPI +75.53%), so moderate profit taking is recommended
- Leaders like TSMCcan continue to be held, with room to reach the target price of $357.50
- Pay attention to quarterly earnings reportsfor verification of AI demand
- TSMC (TSM):Benefits from AI chip demand, has high technical barriers, and relatively reasonable valuation
- Samsung Electronics (005930.KS):Memory chip cycle reversal and AI demand-driven, but wait for correction due to large short-term gains
- Japanese semiconductor equipment manufacturers:Benefit from global semiconductor capital expenditure growth
- Chinese power equipment enterprises:Explosive demand for power in AI data centers, strong demand for equipment like gas turbines
- Tech Hardware: 50-60%(TSMC, Samsung, semiconductor equipment)
- Auto Parts: 20-30%(selected targets in the electric vehicle industry chain)
- Power Equipment: 10-20%(related to data centers)
- AI infrastructure investment will last 3-5 years, providing long-term demand support for semiconductors and equipment manufacturers
- Asia’s manufacturing position in the global supply chain will further improve
- Electric vehicles and green energy transformationwill bring new growth points
- Need to be vigilant about geopolitical riskson long-term industrial chain layout
- Long-term demand from AI infrastructure construction
- Upward semiconductor cycle
- Improved competitiveness of Asian manufacturing
- Excessive short-term gains (especially in the South Korean market)
- Geopolitical uncertainty
- Global economic slowdown risk
- Industry cyclical fluctuations
[0] Gilin API Data — Market Indices, Company Financial Data, Stock Prices, Analyst Ratings
[1] Yahoo Finance — “China’s December RatingDog Manufacturing PMI Rises to 50.1, Beats Expectations”
https://hk.finance.yahoo.com/news/經濟-中國12月ratingdog製造業pmi升至50-1-勝預期-014619451.html
[2] Yahoo Finance — “Mainland China’s December RatingDog Manufacturing PMI Rises to 50.1, Returns to Expansion Range”
https://hk.finance.yahoo.com/news/內地12月ratingdog製造業pmi升至50-1-重返擴張區間-025732516.html
[3] Yahoo Finance — “Asia’s Factories End 2025 on Firmer Footing as Orders Pick Up”
https://finance.yahoo.com/news/asias-factories-end-2025-firmer-025321589.html
[4] Bloomberg — “Asia Manufacturing Rebounds as Global Demand Weathers Trump Hit”
https://www.bloomberg.com/news/articles/2026-01-02/asia-manufacturing-rebounds-as-global-demand-weathers-trump-hit
[5] Bloomberg — “Japan Exports Growth Streak Continues”
https://www.wsj.com/economy/trade/japan-exports-grow-for-third-straight-month-121ad795
[6] Yahoo Finance — “AI Race | ByteDance Expands AI Business, Plans to Invest 160 Billion RMB Next Year”
https://hk.finance.yahoo.com/news/ai競賽-字節跳動拓ai業務-明年擬投1600億元人幣-未知是否用英偉達芯片-093852202.html
[7] Yahoo Finance — “Asia’s Factories End 2025 on Firmer Footing as Orders Pick Up”
https://ca.finance.yahoo.com/news/asias-factories-end-2025-firmer-025321313.html
[8] Bloomberg — “Stock Market Outlook For 2026: What Investors Can Expect”
https://www.forbes.com/sites/investor-hub/article/stock-market-outlook-2026-what-investors-can-expect-in-the-first-6-months/
Insights are generated using AI models and historical data for informational purposes only. They do not constitute investment advice or recommendations. Past performance is not indicative of future results.
About us: Ginlix AI is the AI Investment Copilot powered by real data, bridging advanced AI with professional financial databases to provide verifiable, truth-based answers. Please use the chat box below to ask any financial question.