EU Trade Measures' Impact on China's EV and PV Industries
Unlock More Features
Login to access AI-powered analysis, deep research reports and more advanced features
About us: Ginlix AI is the AI Investment Copilot powered by real data, bridging advanced AI with professional financial databases to provide verifiable, truth-based answers. Please use the chat box below to ask any financial question.
Related Stocks
Based on information obtained and cross-validated from public sources, this report summarizes the current impact assessment of EU trade investigations on China’s electric vehicle (EV) and photovoltaic (PV) industry chains, as well as actionable and verifiable response frameworks and data gap explanations.
I. Verified Policy and Market Trends (with Sources)
- EU Trade Measures on Chinese EVs
- Last year, the EU imposed tariffs on electric vehicles imported from China and determined that Chinese automakers received substantial subsidies [5,7].
- The market and media have widely reported a tariff level of “up to about 45%”, but the final applicable tax rates for specific automakers and models vary and are dynamically adjusted; the official final ruling rates shall be subject to documents from the European Commission, and no precise breakdown was obtained in the current search (Source: Contextual reports from WSJ/Bloomberg, note to refer to official announcements) [5,7].
- Progress and Impact Scope of CBAM (Carbon Border Adjustment Mechanism)
- CBAM will take effect on January 1, 2026, initially covering six high-emission sectors (steel, aluminum, cement, fertilizers, electricity, hydrogen); it is proposed to expand to some assembled goods (such as cars, washing machines) to plug loopholes, which is in the discussion/draft stage and not yet a current regulation [1].
- In early 2025, the head of the European Commission stated that the coverage might be reduced to about 20% of companies (these companies account for the vast majority of emissions) to simplify implementation; the specific list and coverage rate shall be subject to subsequent EU regulations [16].
- Direct impact on PV: PV modules themselves are not in the first batch of CBAM coverage, but if their upstream high-energy-consuming materials such as polysilicon, silicon wafers, glass, and aluminum frames are included in the future, it will increase carbon costs and pass them on to module prices; currently, there is no clear official final ruling and effective schedule for “PV modules being included in CBAM” [1].
- China-EU Trade Pattern and Market Dynamics (Verified)
- Since the end of 2022, anti-dumping and countervailing measures against Chinese products have exceeded 250 [5,7].
- China’s Ministry of Commerce criticized CBAM as “unfair and discriminatory” and warned of possible countermeasures [1].
- In December 2025, Macron warned that the EU might impose tariffs on China due to trade surplus [2].
- Structural changes in China’s new energy terminal market in Europe:
- EVs: Data shows that the sales volume of Chinese brands in Europe reached a plateau in 2024, and the market share of Chinese EVs in Europe has declined since 2023 [18]; BYD’s new car registrations in Europe in October 2024 were 17,470 units (5,695 units in October 2023) [19], but the overall market share is constrained by tariffs and localization pace. Meanwhile, Tesla’s performance in Europe was under pressure, with a market share of only about 0.6% in a certain month and a year-on-year sales decline of about 30% [18], reflecting that the European market is rebalancing from “pure import” to “local competition and cooperation”.
- PV: The EU has not imposed new comprehensive tariffs on PV modules, but the review of China’s supply chain continues, and the expectation of CBAM upstream expansion constitutes medium- to long-term uncertainty (the current official first batch list does not include PV modules; future tracking is needed) [1].
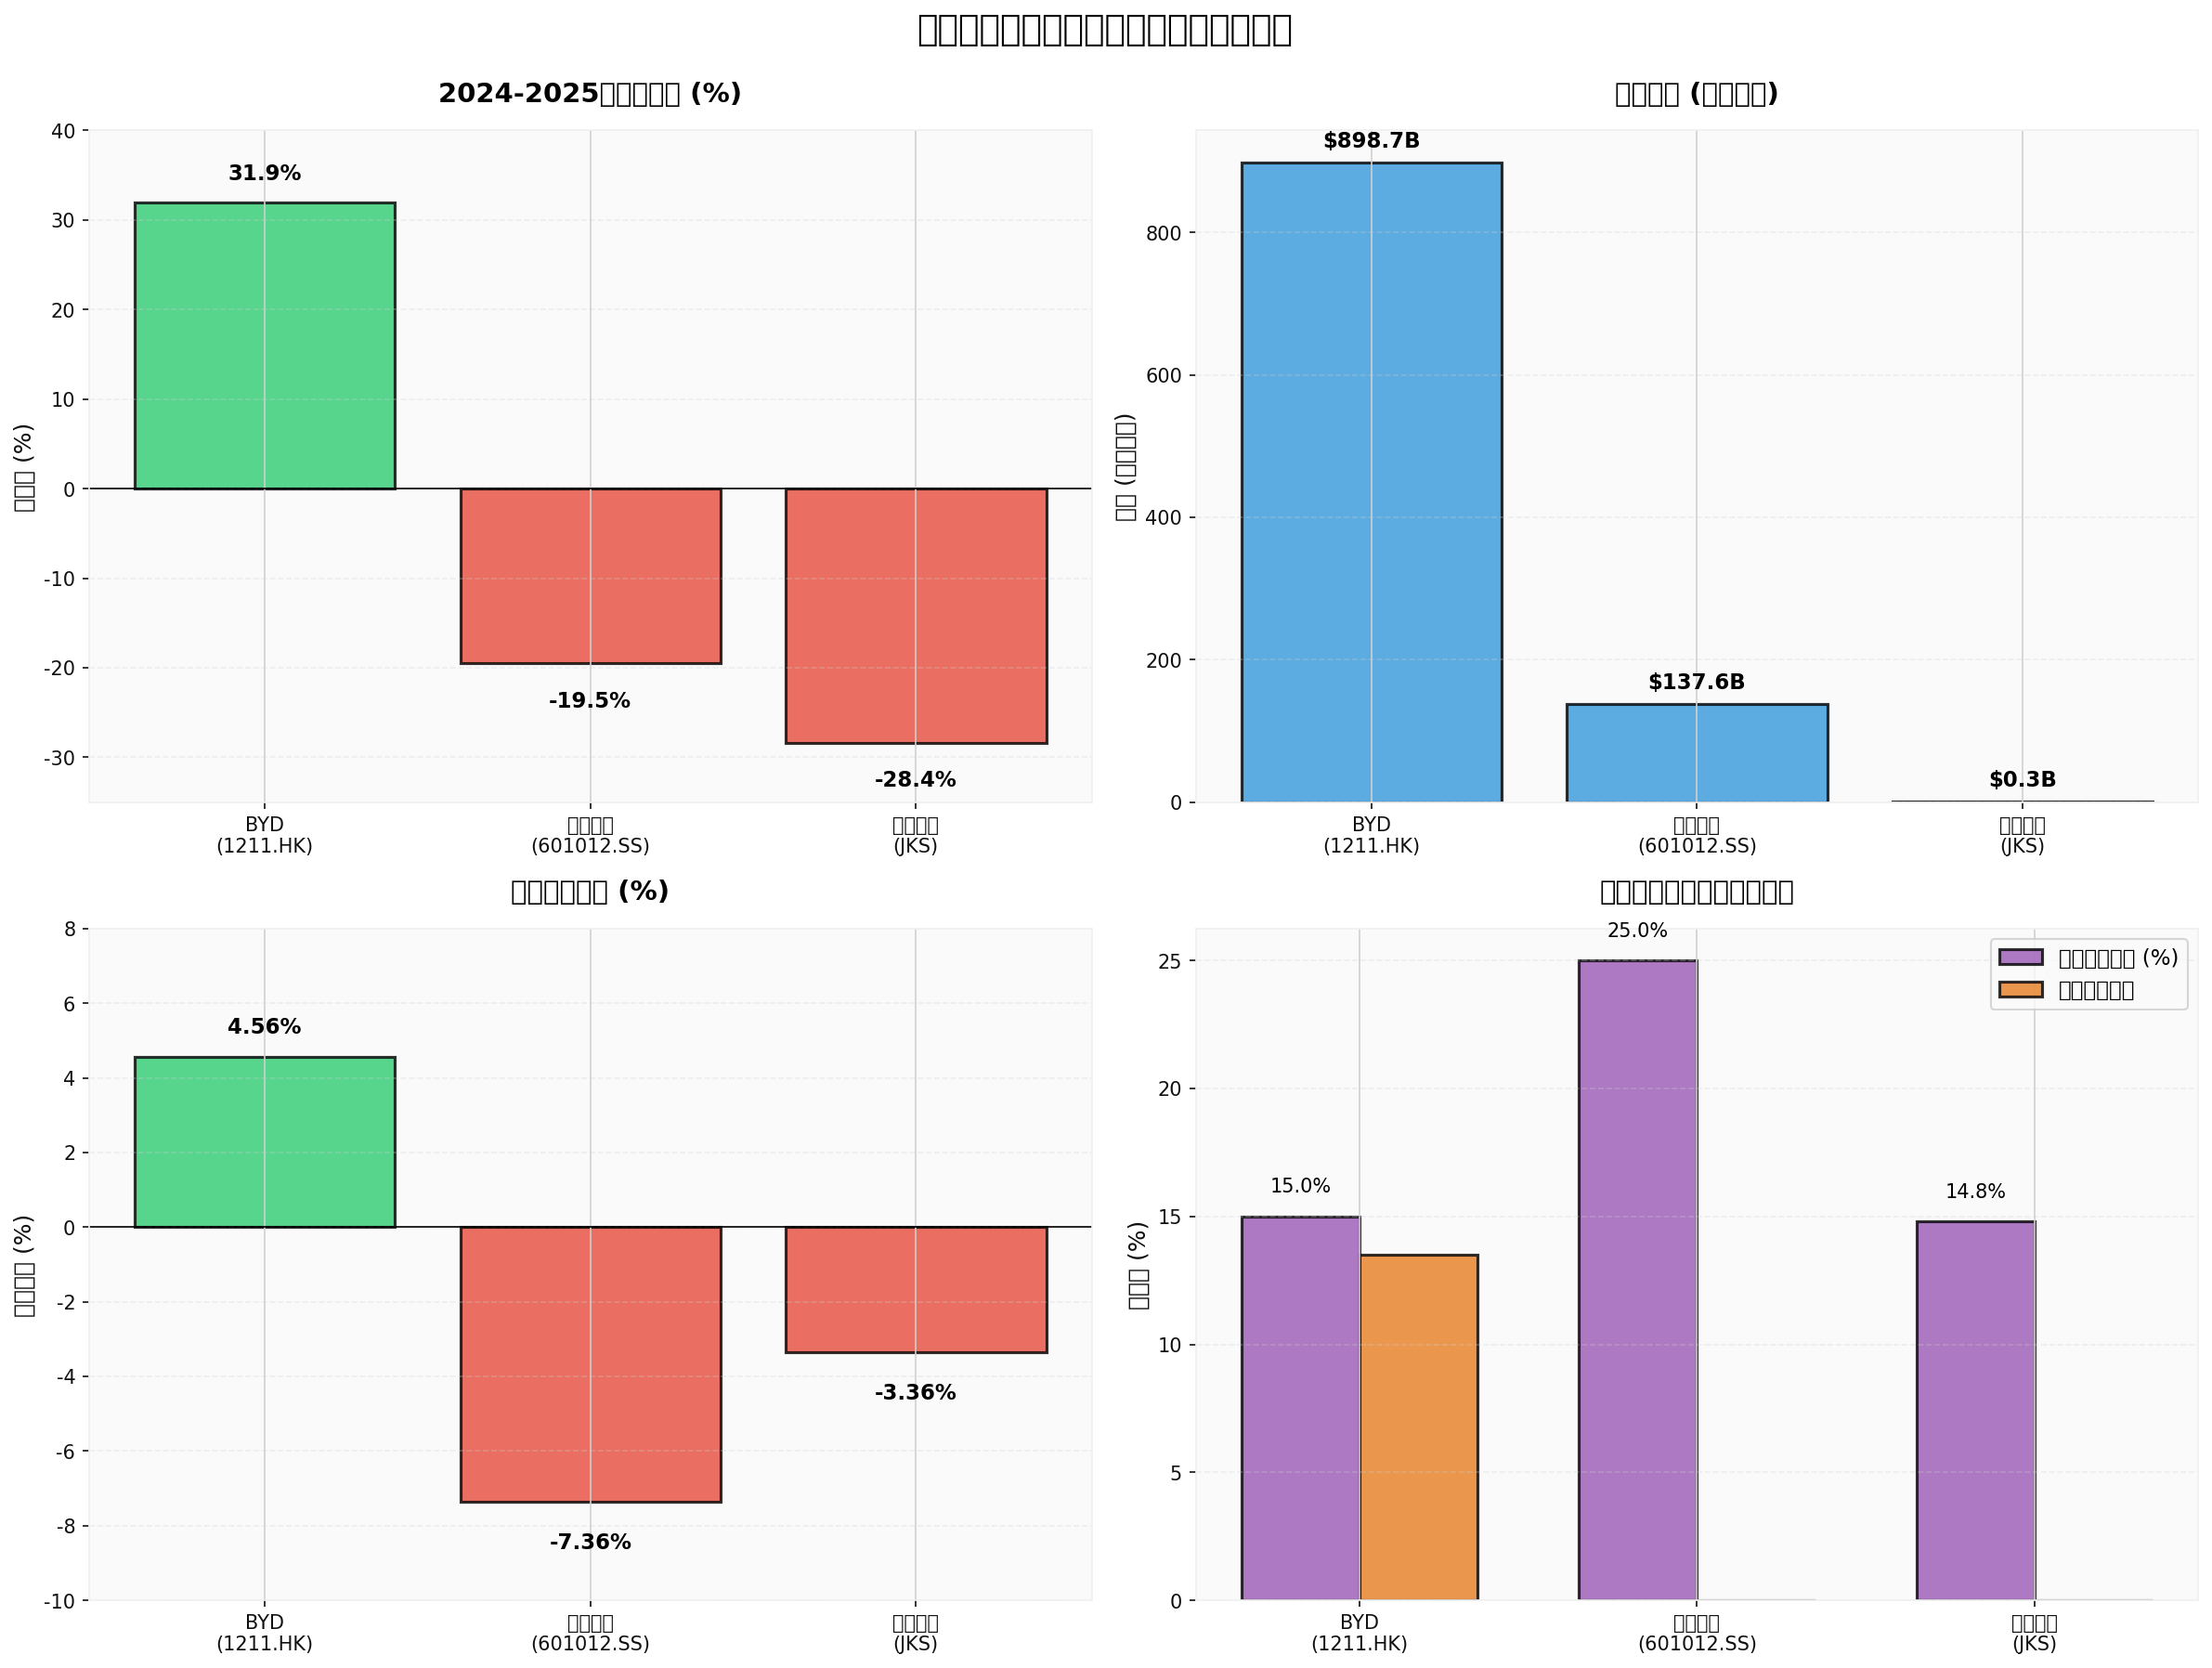
II. Verifiable Impact Assessment on Relevant Enterprises (Based on Brokerage API and Search Results)
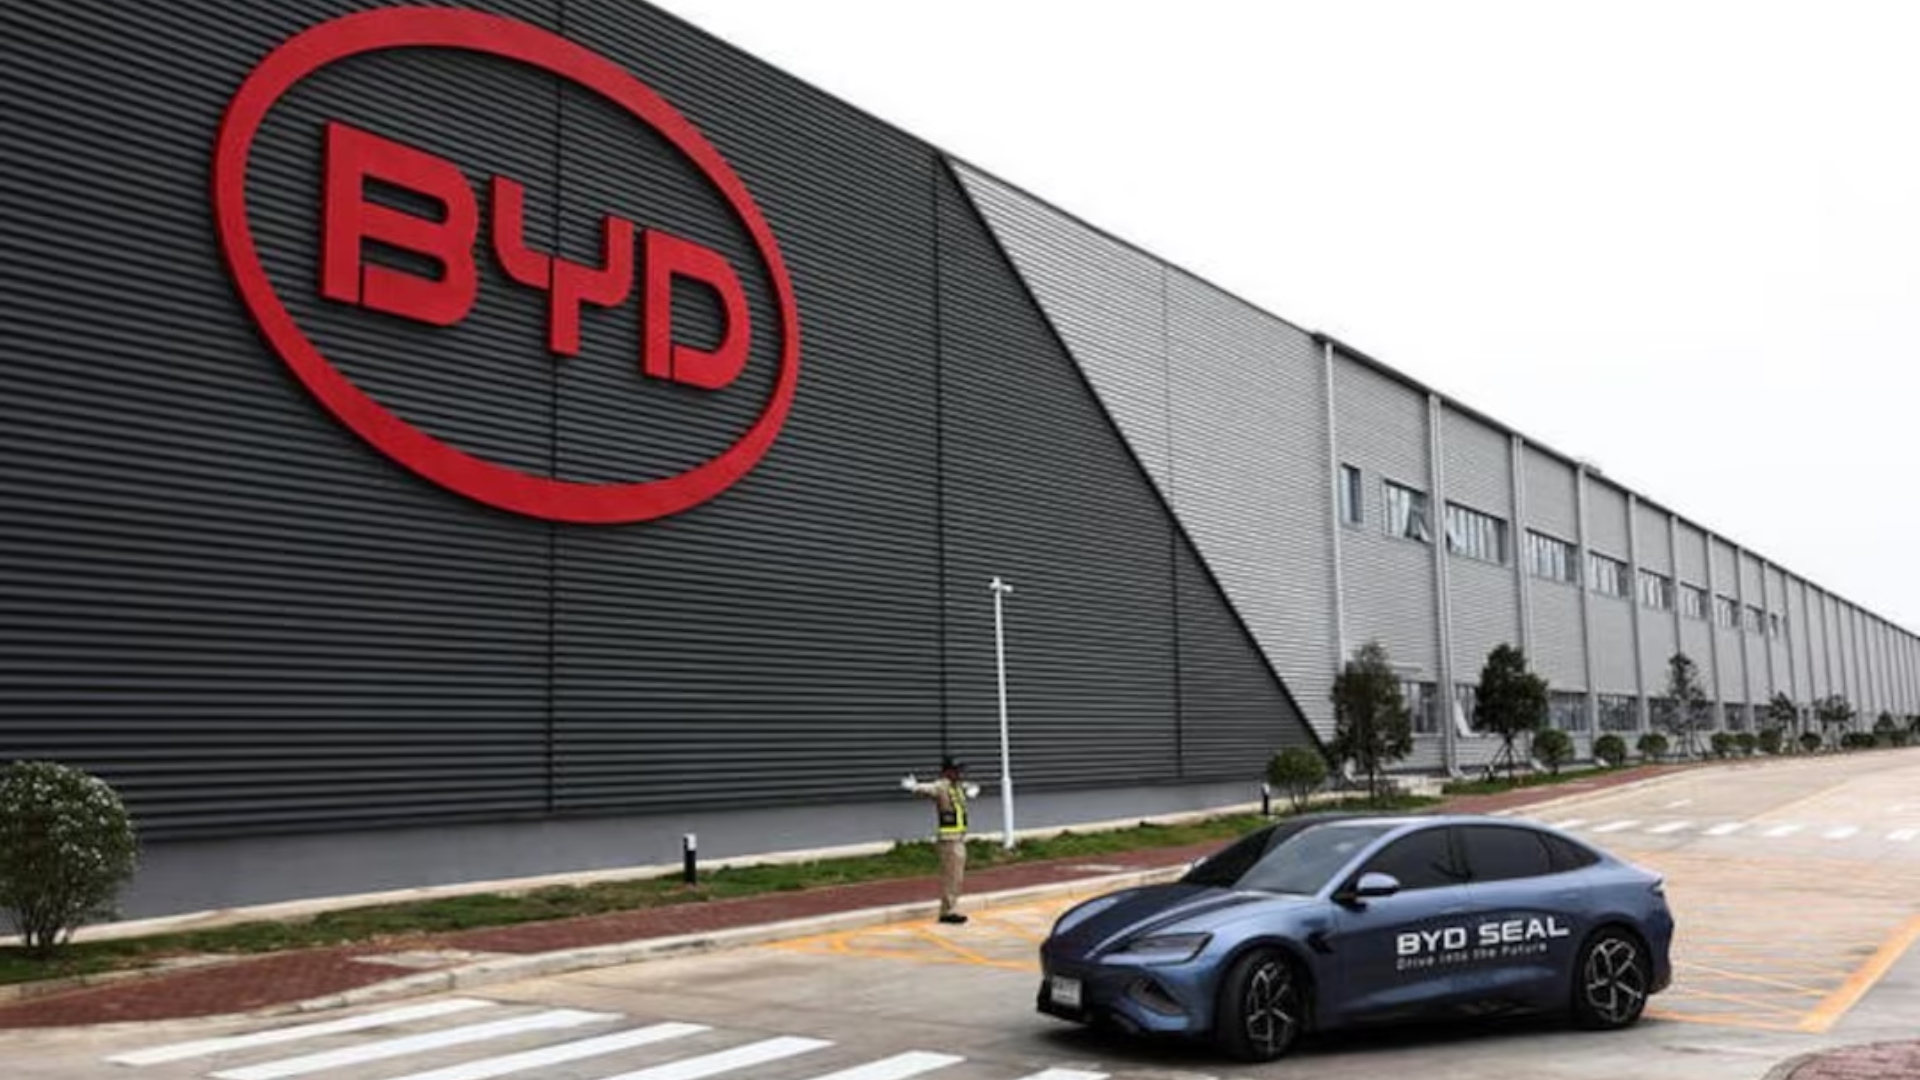
- EV Main Chain: BYD (1211.HK) [10]
- Market value and fundamentals: Market value is approximately $898.72B; stock price range from $72.27 to $95.35 in 2024-2025 (with an increase of about +31.94% during the period) [10]; ROE is about 17.62%, net profit margin about 4.56% [10].
- Qualitative judgment on tariff impact: The reported tariff level of about 45% significantly increases the cost of imported cars, but in terminal competition, part of the impact is offset through local production and cost internalization. BYD is accelerating localization in Europe through building factories and cooperation to avoid direct import tariffs (specific production capacity and cost structure details have not been publicly disclosed) [12,19].
- Data gaps and impact degree: Without official final tax rates and per-vehicle cost pass-through rates, the impact is difficult to accurately calculate. It is recommended to track the EU’s final ruling rates for automakers, the pace of localization capacity ramp-up, and changes in per-vehicle profit margins. Current judgment: Tariffs have a significant impact on the “pure import model”, but the localization pace will buffer part of the impact; the overall impact is between “medium and significant”.
- PV Main Chain: LONGi Green Energy (601012.SS) [11], JinkoSolar (JKS) [13]
- LONGi: Market value is approximately $137.56B; stock price dropped from $22.61 to $18.20 in 2024-2025 (-19.50%) [11]; net profit margin is -7.36%, ROE is -9.39% [11].
- JinkoSolar: Market value is approximately $0.335B; stock price dropped from $36.05 to $25.81 in 2024-2025 (-28.40%) [13]; net profit margin is -3.36% [13]; FY2024 European revenue accounted for about 14.8% [13].
- Verifiable impact: Currently, there is no new comprehensive tariff policy on PV modules implemented by the EU; the first batch of CBAM list does not include PV modules. However, if upstream polysilicon is included, it will increase costs (subject to subsequent regulations). Industry cyclical overcapacity is a more direct profit pressure (public reports show that Chinese polysilicon enterprises are responding to overcapacity through joint ventures, etc.) [7].
- Data gaps and impact degree: The upstream carbon cost pass-through rate, final CBAM coverage pace, and quota price level are not clear. Current judgment: The profit pressure of the PV main chain mainly comes from cyclicality and price competition, and CBAM expectations constitute medium- to long-term risk premium; enterprises with large exposure to the European market (such as JinkoSolar) need to closely track carbon costs and localization layout.
III. Actionable Adjustment Directions and Priorities for Enterprise Global Layout
- Local Production Capacity and Compliance Site Selection (Most Direct and Quantifiable)
- EVs: Establish factories in the EU or countries with preferential agreements with the EU (such as Hungary, Spain) to reduce tariffs and compliance risks through local assembly. Prioritize evaluating supply chain supporting facilities, policy stability, labor and energy costs, and track EU subsidies and local content rules.
- PV: Layout module/cell production capacity in Europe, America, or Southeast Asia to avoid potential barriers; JinkoSolar’s layout in the US and Malaysia is an example (specific production capacity scale and cost structure have not been publicly disclosed) [7].
- KPIs and quantifiable grasp: Local production capacity ratio, local supply chain procurement rate, local per-vehicle/module gross profit margin improvement (need to track enterprise disclosure).
- Supply Chain Carbon Management and Cost Pass-through (Must-have for Responding to CBAM)
- Establish Scope 3 carbon accounting and data chain to ensure traceability to EU-recognized standards (need to track EC data format and certification rules in the future).
- Promote upstream green power and process emission reduction to reduce carbon cost exposure.
- Communicate the “carbon cost sharing mechanism” with customers and bidders, and reflect carbon costs in the pricing model.
- Market and Product Diversification (Diversify Systemic Risks)
- Regional diversification: Accelerate channel and brand building in emerging markets such as ASEAN, Middle East, and Latin America; according to brokerage API data, JPMorgan suggests that “enterprise overseas layout” is one of the four major themes in 2026 [3].
- Product line and value chain extension: Extend from modules to system integration, energy storage, and operation and maintenance services to increase the proportion of local service value.
- Policy and Compliance Hedging (Reduce Uncertainty)
- Deeply participate in EU chambers of commerce and industry associations, track draft regulations, and establish an early warning mechanism (such as CBAM expansion schedule, local content and subsidy policy details).
- Hire local compliance and tax teams to optimize the entity structure and transfer pricing arrangements in Europe to reduce tax and compliance risks.
IV. Current Information Gaps and Next Quantifiable Directions
- Tariff and cost pass-through: Need to obtain the EU’s final ruling rates and implementation time for specific automakers/models, as well as the tariff pass-through rate at the enterprise level (need enterprise announcements or in-depth research reports for support).
- CBAM upstream pass-through to PV: Need to wait for the EU’s official documents on whether “polysilicon, silicon wafers, glass, aluminum frames” are included and the schedule, and measure the sensitivity to module BOM costs.
- Localization efficiency: Need more detailed local production capacity, cost, and profit improvement data (capital expenditure, local gross profit margin, local supply chain ratio, etc.).
V. Actionable Enterprise Action List (Quantifiable and Trackable)
- Complete the “tariff and CBAM impact diagnosis” within 3 months:
- Establish an SKU-level tariff rate and cost impact matrix (official sources and enterprise customs declaration data).
- Build a carbon cost model, and calculate the sensitivity of BOM after upstream inclusion in CBAM under different scenarios.
- Optimize supply chain and site selection within 6 months:
- Evaluate 1-2 local or nearshore sites, and output Capex and Opex comparisons (including policy subsidies and carbon costs).
- Sign green power procurement and energy efficiency improvement agreements to reduce per-unit product carbon costs.
- Implement the “product-market-carbon cost” integrated pricing and negotiation mechanism within 12 months:
- Embed carbon costs and tariff costs into the quotation template, and agree on sharing terms with key customers.
- Establish a compliance data platform to ensure traceability and auditability.
Charts and Visualization Background:
- The above charts show the comparison of major enterprises in market value, stock price performance, and profit indicators [10,11,13].
- The charts show: BYD is significantly ahead in market value and profitability, while PV enterprises face greater cyclical profit pressure; this comparison is for macro background reference and does not directly equate to the causal measurement of a single policy impact.
References:
- Gilin API Data [0]
- [1] Bloomberg - China Calls EU Carbon Border Tax Unfair, Warns of Counter-Moves (https://www.bloomberg.com/news/articles/2026-01-01/china-calls-eu-carbon-border-tax-unfair-warns-of-counter-moves)
- [2] Bloomberg - Macron Warns EU May Hit China With Tariffs Over Trade Surplus (https://www.bloomberg.com/news/articles/2025-12-07/macron-warns-eu-may-hit-china-with-tariffs-over-trade-surplus)
- [3] Yahoo Finance (HK) - JPMorgan Optimistic About Four Major Themes Driving MSCI China Index in 2026 (https://hk.finance.yahoo.com/news/摩根大通看好2026-msci中國指數-ai-反內卷-海外布局與消費復甦四大主題驅動-231004197.html)
- [5] WSJ - China’s Trade Surplus Reaches $1 Trillion, Gaining Huge Advantage in Tariff War (https://cn.wsj.com/articles/中国贸易顺差达万亿美元-在关税戰中优势巨大-f3bfa77d)
- [7] Bloomberg - China’s Polysilicon Giants Join Forces to Tackle Overcapacity (https://www.bloomberg.com/news/articles/2025-12-10/china-s-polysilicon-giants-join-forces-to-tackle-overcapacity)
- [12] Yahoo Finance (HK) - How China Avoids Trade Protectionism: CATL’s Factory in Germany is a Way (https://hk.finance.yahoo.com/news/中国如何规避贸易保护主义-宁德时代在德国建厂是个路子-074928198.html)
- [16] Yahoo Finance (UK) - EU Considers Exempting Most Companies from Carbon Border Levy (https://uk.finance.yahoo.com/news/eu-considers-exempting-most-companies-121850993.html)
- [18] WSJ - Tesla’s European Sales Almost Halved in October / BYD’s European Sales Continue to Rise (https://cn.wsj.com/articles/tesla-had-another-bad-month-in-europe-3c62a2b7; https://cn.wsj.com/articles/chineseautomaker-byd-s-european-sales-continue-to-rise-3aed74dc)
- [19] WSJ - Infographic: How China is Dominating the Global Electric Vehicle Market (https://cn.wsj.com/articles/圖解中國正如何稱霸全球電動汽車市場-2efdbfba)
Insights are generated using AI models and historical data for informational purposes only. They do not constitute investment advice or recommendations. Past performance is not indicative of future results.
About us: Ginlix AI is the AI Investment Copilot powered by real data, bridging advanced AI with professional financial databases to provide verifiable, truth-based answers. Please use the chat box below to ask any financial question.