Analysis of Coinbase Valuation Correction on Crypto Stock Sentiment and Valuation Framework
Unlock More Features
Login to access AI-powered analysis, deep research reports and more advanced features

About us: Ginlix AI is the AI Investment Copilot powered by real data, bridging advanced AI with professional financial databases to provide verifiable, truth-based answers. Please use the chat box below to ask any financial question.
Related Stocks
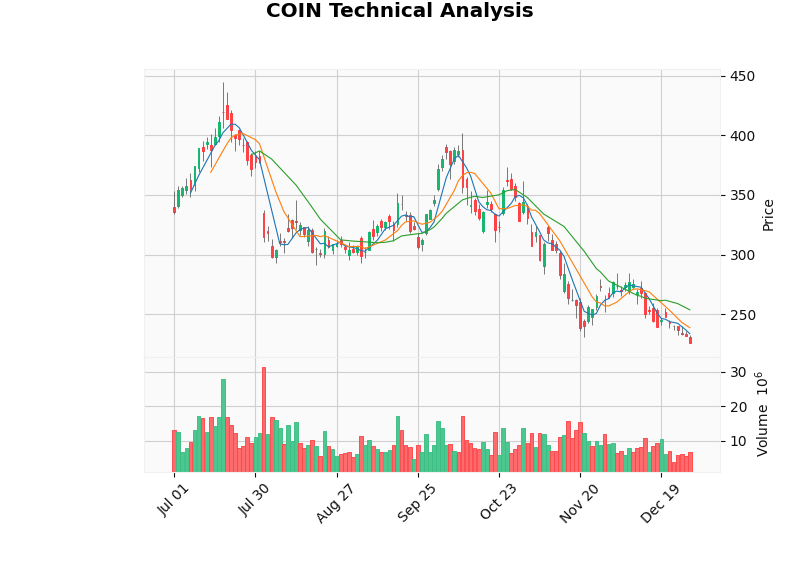
- COIN’s latest quote: $226.14, ~-34.67% in the past 3 months, ~-32.56% in the past 6 months (tool data) [0].
- Period from 2025-07-01 to 2025-12-31: ~-33.48% (measured by interval) [0].
- Valuation metrics: P/E ~18-20x (TTM), P/S ~7-8x, P/B ~3-4x [0].
- Technical aspects: In a downward channel, oversold zone (RSI/KDJ indication), key support ~$225, resistance ~$284 [0].
- DCF scenario (model): Intrinsic value valuation ~$21-27 (significantly lower than current market price), indicating extremely high discount rate and high-risk assumptions, but the difference between model results and market price does not directly equate to “market overvaluation” [0].
- Market data source (for verifying volatility and returns): Yahoo Finance page shows COIN’s two-year volatility and returns [1].
- Scenario Assumption(based on user statement, not a tool-verifiable conclusion): If a similar ~42% rapid correction occurs in July, the market often interprets this as a combination of “valuation regression + liquidity contraction + regulatory uncertainty”.
- Sentiment Transmission Path(hypothetical deduction):
- Risk Reassessment: Investors may become more sensitive to the discount rate and earnings quality of high-growth, high-volatility crypto sectors, reducing their risk premium tolerance for high-growth narratives.
- Sector Spillover: Exchanges, mining companies, and payment-related targets (e.g., MARA, RIOT, SQ, PYPL, etc.) may face short-term selling pressure (this is a transmission logic, not a data-verified conclusion).
- Capital Rebalancing: Some capital may shift to low-correlation or defensive assets, leading to sector capital outflows and valuation compression.
- Current Verifiable Price and Trend Signals:
- Cumulative ~-33.48% in the second half of 2025, showing mid-cycle pressure, but not the same measurement as “42% in a single month” (the latter is in the user’s background context) [0].
- Technical aspects are in a downward channel and oversold, indicating weak short-term risk appetite and rising volatility [0].
- Indicators need to reflect business models (commission/trading fees, subscription/value-added, custody/derivatives, cyclicality and regulation) and volatility. A multi-dimensional combination is recommended:
- Price Multiple Category
- Adjusted P/E: Excludes one-time expenses/income, closer to sustainable profitability; combined with COIN’s current P/E ~18-20x and high volatility, it is recommended to evaluate relative valuation using industry and historical percentiles [0].
- P/Operating CF and P/FCF: Cash flow characteristics of exchange businesses are more critical for pricing; combined with FCF and high capital expenditure cycles, multi-year averages should be used for robust comparisons [0].
- P/S: Suitable for stages with large profit fluctuations, high growth but unstable; COIN’s current ~7-8x, needs to be compared with industry ranges and crypto cycle positions [0].
- Business/Asset-Specific Multiples
- P/Platform Trading Volume: Market capitalization vs. annualized trading volume, reflecting the capitalized value per unit of trading volume; it is a commonly used supplementary perspective in the industry (specific values need to be calculated based on company disclosures, not directly provided by current tools).
- Price/Assets Under Custody (AUC): Measures the valuation level per unit of custody assets, reflecting platform stickiness and custody business value (needs to be calculated based on disclosures).
- Profitability and Quality
- Operating Margin and Net Margin: COIN has shown improvement in recent quarters (e.g., net margin and operating margin increases) [0], but attention needs to be paid to fee cycles and cost structure resilience.
- Revenue/Trade Mix: Structural evolution and sustainability of trading and subscription/value-added revenue (tools show product-wise revenue structure, need to compare with history and peers) [0].
- Risk and Cyclicality
- Beta and Volatility: COIN’s Beta to SPY is ~3.69, indicating high sensitivity and systematic risk premium requirements [0].
- WACC and Scenario Discounting: DCF models show high discount rate and risk premium assumptions; in cyclical industries, it is recommended to use scenario ranges (conservative/neutral/optimistic) to verify valuation elasticity instead of a single point valuation [0].
- Compliance and Balance Sheet
- Balance Sheet Quality: Liquidity and leverage ratios (e.g., Current Ratio ~2.4) [0], need to be combined with regulatory costs and reserve requirements.
- Legal and Regulatory Costs: Regulatory response investments (legal, compliance) as normalized costs should be included in profitability quality assessment.
- Price Multiple Category
- If a similar ~42% sharp correction occurs (user background scenario), sentiment is often amplified: high discount rate assumption reassessment, short-term sector capital outflows, media and social media dissemination exacerbate sentiment fluctuations.
- Technical aspects indicate current downward channel and oversold status, meaning short-term volatility may still exist, but it also provides range trading opportunities for capital with higher risk appetite (strict stop-loss and position control required) [0].
- The gap between DCF model results (~$21-27) and current price ($226) indicates: under extremely high discount rate and conservative growth assumptions, “intrinsic value” is significantly lower than market price; but model results are highly sensitive to WACC, growth, and terminal value, and should be used as a sensitivity analysis tool rather than an absolute conclusion [0].
- Short-term: Closely monitor crypto market volatility (BTC/ETH, etc.), regulatory policies and macro liquidity, control single-stock exposure, and conduct band management combined with technical support/resistance (current support ~$225, resistance ~$284) [0].
- Mid-term: Introduce business-specific multiples such as P/Operating CF and P/Trading Volume into the valuation system, avoid relying solely on P/E/P/B, and evaluate structural improvements combined with the pace of increase in subscription and value-added revenue share.
- Long-term: Under the trend of integration between crypto assets and traditional finance (ETF, custody and derivatives expansion), evaluate platform network effects and compliance moats; build a robust valuation range using multi-scenario DCF and phased multiple methods.
- Gilin API Data: Real-time quotes, daily line and interval performance, valuation metrics (P/E, P/S, P/B), technical aspects (Beta, trend and support/resistance), financial analysis (profit margins, product-wise revenue), DCF scenario results, etc. [0].
- Web Search and Public Pages: Yahoo Finance page (COIN’s two-year volatility and return data) [1].
- [0] Gilin API Data
- [1] Yahoo Finance - COIN (Financial Analysis) (https://finance.yahoo.com/quote/COIN/)
Insights are generated using AI models and historical data for informational purposes only. They do not constitute investment advice or recommendations. Past performance is not indicative of future results.
About us: Ginlix AI is the AI Investment Copilot powered by real data, bridging advanced AI with professional financial databases to provide verifiable, truth-based answers. Please use the chat box below to ask any financial question.