Evaluation of the Impact on Shareholder Value and Capital Utilization Efficiency of Society Pass (SOPA)'s $3 Million Small-Scale Public Offering
Unlock More Features
Login to access AI-powered analysis, deep research reports and more advanced features

About us: Ginlix AI is the AI Investment Copilot powered by real data, bridging advanced AI with professional financial databases to provide verifiable, truth-based answers. Please use the chat box below to ask any financial question.
Related Stocks
According to broker API data and news, Society Pass (SOPA) announced the completion of a $3 million common stock public offering on December 30, 2025, with specific terms as follows:
| Item | Details |
|---|---|
Offering Size |
$3 million |
Offering Price |
$2.00 per share |
Number of Shares Offered |
1.5 million common shares |
Offering Method |
Best-efforts public offering |
Underwriter |
Placement agent (fees deducted from raised funds) |
Completion Date |
December 31, 2025 |
After the offering, the stock price showed positive performance:
- Offering Price: $2.00 per share (premium pricing relative to market price)
- Current Stock Price: $3.80 (as of December 31, 2025 closing)
- Post-Offering Increase: +90% (relative to offering price)
- Daily Increase: +16.92%
- Trading Volume: 14.37 million shares, far higher than the average level [0]
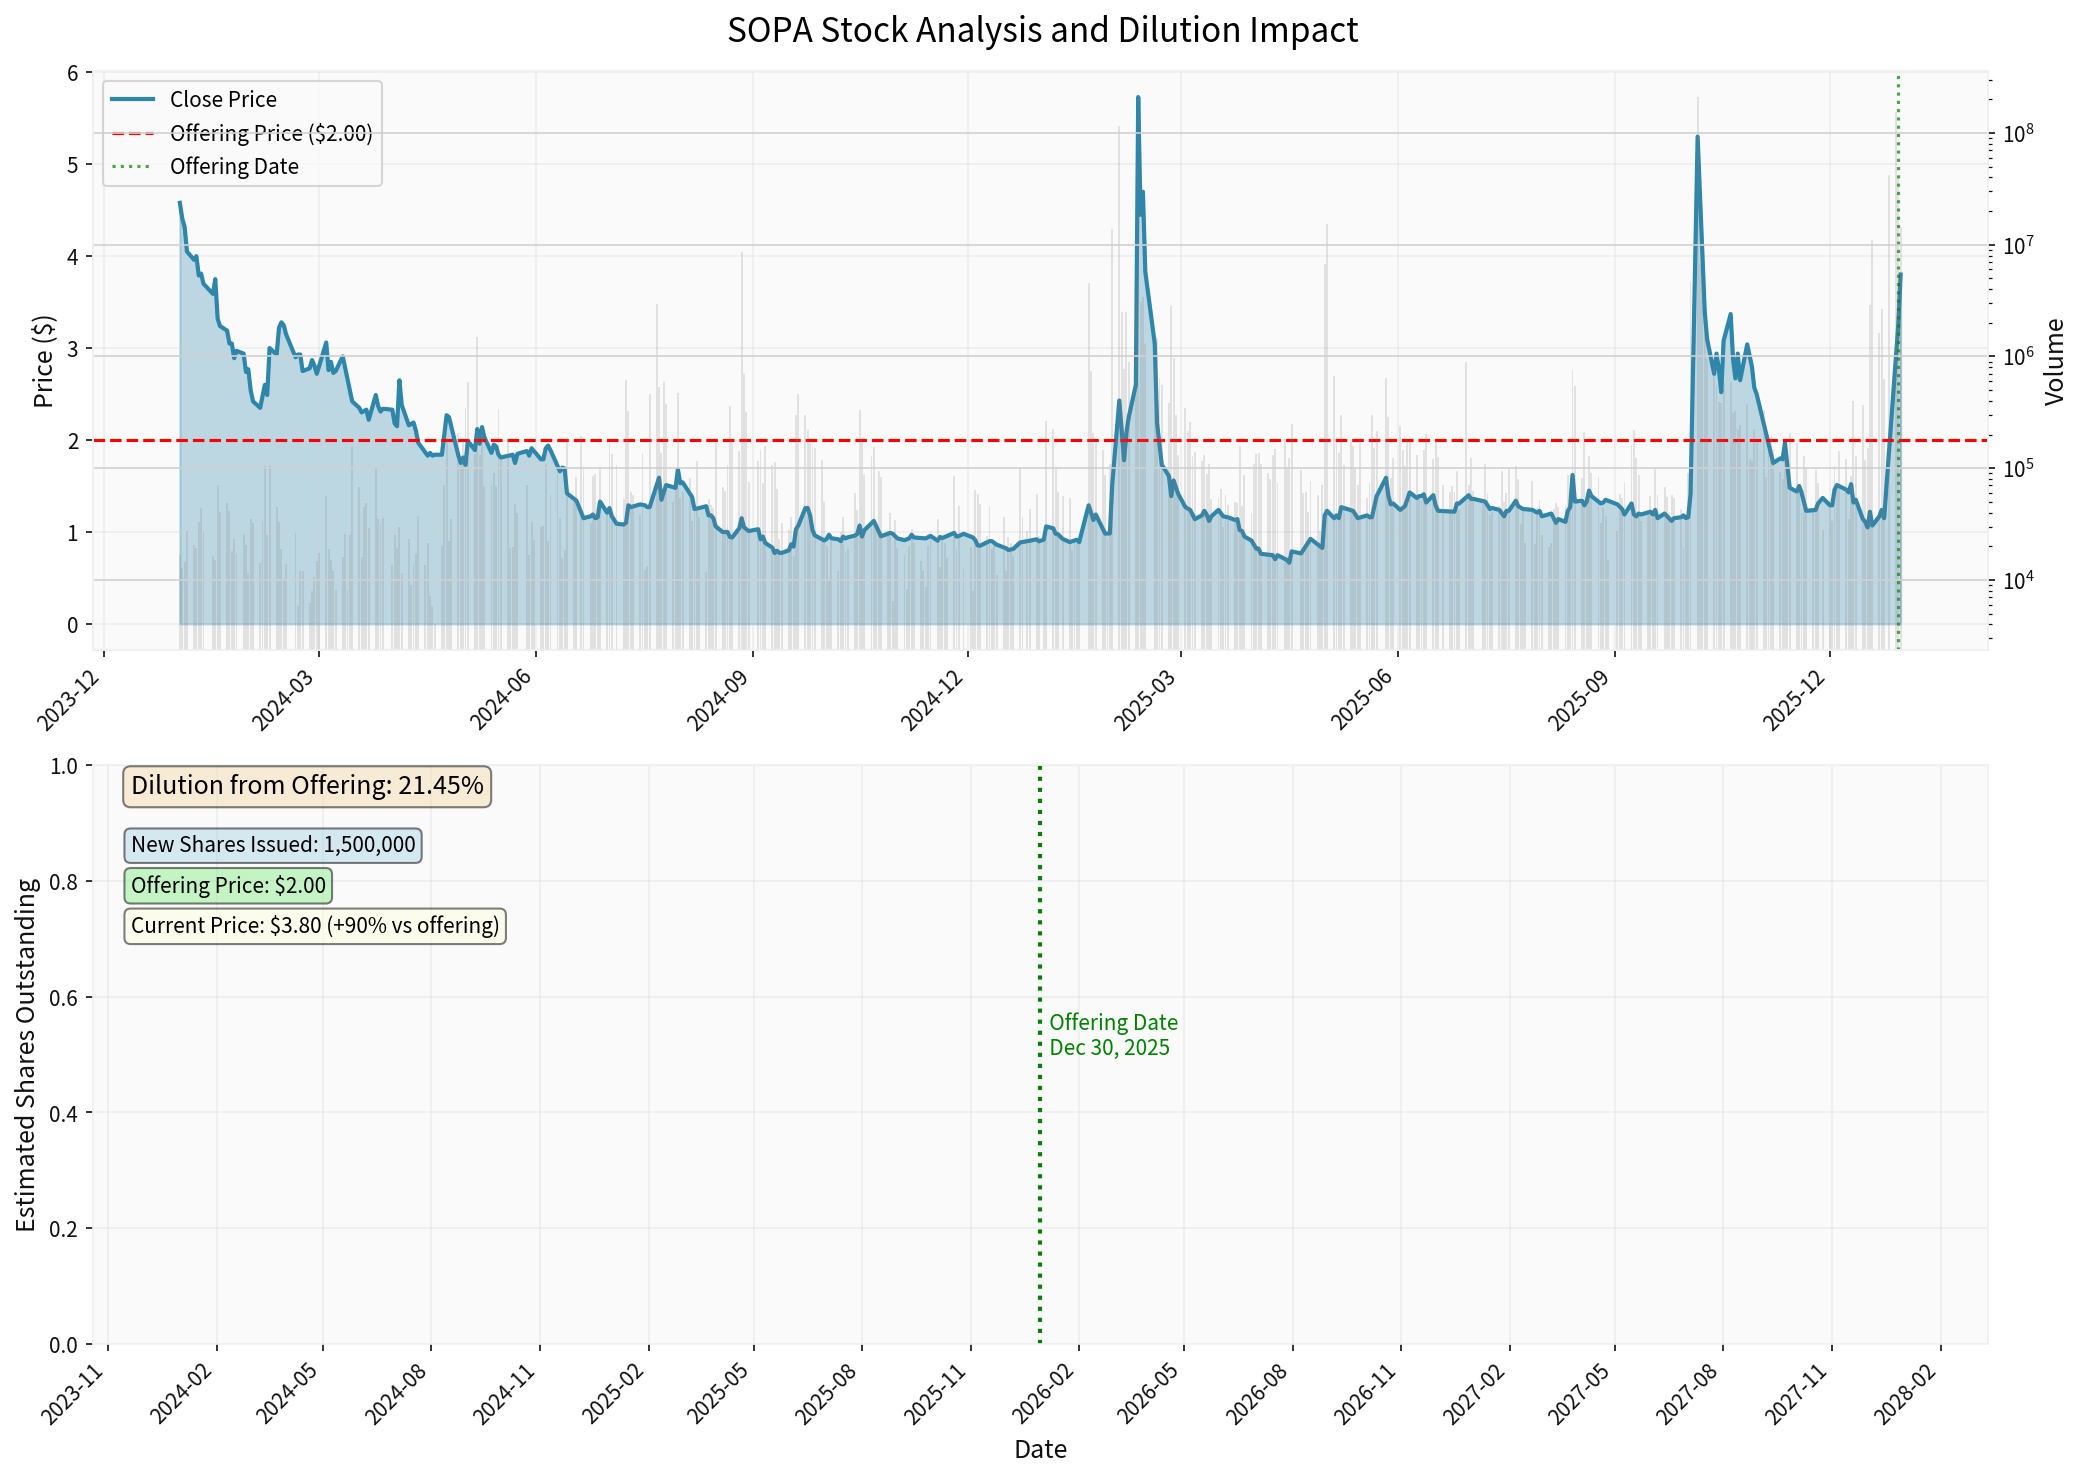
Figure 1: SOPA stock price performance and offering date annotation. Data shows that despite the small offering size, the market response was positive, and the stock price rose significantly after the offering.
Analysis of equity dilution based on current data:
| Indicator | Pre-Offering | Post-Offering | Change |
|---|---|---|---|
Outstanding Shares (Estimated) |
~5.5 million shares | ~7 million shares | +1.5 million shares |
Shareholder Ownership Ratio |
100% | ~78.6% | -21.4% |
Book Value per Share |
Baseline | Diluted | - |
This means existing shareholders’ ownership权益 was diluted by approximately 21.4%.
Despite dilution, changes in the company’s total market capitalization may be beneficial to shareholders:
- Pre-Offering Valuation: ~$20 million (estimated based on pre-offering stock price)
- Net Proceeds: ~$2.7 million (estimated after deducting ~10% underwriting fees)
- Post-Offering Market Capitalization: $20.87 million (current stock price $3.80 × ~5.5 million shares)
-
Liquidity Injection: The $3 million funds provide an important buffer for the cash-strapped company
- Current Ratio: 1.40 (liquidity is acceptable but not abundant)
- Quick Ratio: 1.40 [0]
-
Market Confidence Boost: The 90% stock price increase after the offering indicates investors认可 the company’s strategic direction
-
Avoid Bankruptcy Risk: The company continues to lose money (net profit margin -77.41%), and new funds help maintain operations [0]
-
Continuous Losses:
- Operating Margin: -143.38%
- Net Profit Margin: -77.41%
- ROE: -160.56% [0]
- This means the company loses approximately $0.77 for every $1 of revenue
-
Cash Burn Rate Issue:
- The company’s revenue in Q4 2024 was only $1.38 million, but losses reached $0.89 million [0]
- The $3 million funds are expected to support the company’s operations for approximately 2-3 quarters
-
Valuation Rationality Doubt:
- Price-to-Sales Ratio: 2.47x
- Price-to-Book Ratio: 1.62x
- For a company with severe losses, these valuation multiples are high
According to public information and news, the company plans to use the funds for:
| Use Category | Specific Projects | Expected Effect |
|---|---|---|
Business Expansion |
Launch TMG Social live commerce platform | Target: Achieve $10 million revenue in 2026 |
M&A Integration |
Implement M&A strategy, acquire private companies | Target: In AI, tourism, digital advertising, telecommunications sectors |
Subsidiary IPO |
Support the spin-off and listing of Thoughtful Media Group and NusaTrip | Expected: Unlock suppressed value |
General Corporate Uses |
Operating funds, debt repayment | Maintain company operations |
According to news, the company’s strategic layout includes:
-
Southeast Asia E-commerce Ecosystem:
- Target Markets: Vietnam, Indonesia, Philippines, Singapore, Thailand (accounting for over 80% of Southeast Asia’s population)
- Three Vertical Areas: Digital Media, Tourism, Lifestyle
-
TMG Social Platform:
- Launched in cooperation with Thoughtful Media Group
- Targeting Southeast Asia’s $90 billion social commerce market
- Has a network of over 10,000 influencers and creators
- 2026 Revenue Target: $10 million
-
M&A Strategy:
- Focus on valuation arbitrage opportunities for private companies
- Regions: Southeast Asia, Europe, North America
- Industries: AI data centers, tourism, digital advertising, telecommunications
| Evaluation Dimension | Current Performance | Rating | Explanation |
|---|---|---|---|
Strategic Clarity |
Medium | ⭐⭐⭐ | The company has a clear Southeast Asia e-commerce ecosystem strategy, but business lines are too scattered |
Investment Return Potential |
Uncertain | ⭐⭐ | The target market ($90 billion) is huge, but the company lacks a successful execution record |
Management Execution Capability |
Doubtful | ⭐⭐ | The company’s financial performance continues to deteriorate with no signs of improvement |
Capital Allocation Discipline |
To Be Observed | ⭐⭐⭐ | The $3 million scale is small, and capital use is relatively controllable |
Shareholder Value Creation |
Short-Term Positive / Long-Term Uncertain | ⭐⭐ | Short-term stock price increase, but continuous losses threaten long-term survival |
- Lack of Profitability: The company relies heavily on external financing to maintain operations rather than organic growth
- Transformation Risk: Transition from traditional e-commerce to live social e-commerce requires significant investment and time
- Intense Competition: Giants like TikTok, Shopee, Lazada dominate the Southeast Asian market
| Financial Indicator | Value | Assessment |
|---|---|---|
Operating Revenue (TTM) |
$7.23 million | -17.63% YoY decrease |
Gross Margin |
0.46% | Extremely low, indicating weak pricing power or poor cost control |
Operating Margin |
-143.38% | Severe loss |
Net Profit Margin |
-77.41% | Severe loss |
ROE |
-160.56% | Significant erosion of shareholder equity |
| Financial Indicator | Value | Assessment |
|---|---|---|
Current Ratio |
1.40 | Barely acceptable |
Quick Ratio |
1.40 | Same as current ratio, indicating good inventory management |
Cash Ratio |
0.35 | Insufficient cash reserves |
Debt-to-Equity Ratio |
0.06 | Low leverage |
Free Cash Flow |
$2.44 million | Positive, but insufficient to cover losses |
| Indicator | Value | Assessment |
|---|---|---|
Current Stock Price |
$3.80 | |
52-Week Range |
$0.65 - $6.75 | Extremely volatile |
YTD Increase |
+314.39% | Significant increase during the year |
1-Year Increase |
+323.16% | |
3-Year Decrease |
-74.34% | Severe long-term decline |
5-Year Decrease |
-99.48% | Long-term shareholders almost lost all investments |
P/E Ratio |
-4.15x | Negative, cannot be valued using traditional P/E ratio |
P/B Ratio |
1.62x | Premium over book value |
- Survival Funds: Provide 2-3 quarters of operating funds for the cash-burning company
- Strategic Transformation Support: Fund new business lines like TMG Social
- Market Confidence: Premium pricing shows investors are willing to support
- Relatively Controllable: The $3 million scale is small, with limited trial-and-error costs
- Equity Dilution: Existing shareholders’ ownership ratio decreases by approximately 21%
- Treats Symptom Not Root Cause: Fails to solve the fundamental profitability problem
- Relies on Continuous Financing: May require more rounds of financing
- Valuation Risk: Current stock price increase may be overly optimistic
-
Can TMG Social Achieve the $10 Million Revenue Target?
- The company’s current TTM revenue is only $7.23 million
- Doubling growth in a single business line within one year is extremely challenging
- Efficiency Indicators: Focus on TMG Social’s customer acquisition cost, retention rate, and revenue per user
-
Execution Quality of M&A Strategy
- The company plans to expand scale through acquisitions
- Key Risks: M&A integration failure, paying excessive premiums
- Efficiency Indicators: Post-acquisition revenue growth, cost synergies
-
Valuation Unlocking from Subsidiary IPOs
- Spin-off plans for Thoughtful Media Group and NusaTrip
- Potential Value: Subsidiaries may have higher valuations than the parent company
- Efficiency Indicators: IPO valuation, parent company’s holding value
- Going Concern Risk: The company continues to suffer severe losses and faces survival risks
- Execution Risk: Strategic transformation requires strong execution capability, and the company has a poor track record
- Market Competition: Southeast Asian e-commerce market is dominated by giants, with intense competition
- Exchange Rate Risk: Multi-region operations, exchange rate fluctuations affect financial performance
- Regulatory Risk: Complex and changing regulatory environments in Southeast Asian countries
| Investor Type | Recommendation | Reason |
|---|---|---|
Short-Term Speculators |
Cautious Participation | High stock price volatility, possible short-term opportunities but extremely high risk |
Long-Term Value Investors |
Avoid | The company lacks sustained profitability, and long-term value is doubtful |
Risk Arbitrageurs |
Focus on M&A Opportunities | The company’s M&A strategy may create arbitrage opportunities |
Institutional Investors |
Wait and See | Wait for better execution evidence and profitability improvement |
- Cash Burn Rate: Is it decreasing?
- TMG Social Revenue Growth: Is it meeting targets?
- Gross Margin Improvement: Is it increasing?
- Cash Flow: Is it turning positive?
- Subsidiary IPO Progress: Is it advancing on schedule?
- ✅ Positive: Capital injection eases bankruptcy risk, and stock price increase provides liquidity
- ✅ Positive: Supports the launch of new businesses like TMG Social
- ⚠️ Neutral: The 21% equity dilution is partially offset by market capitalization increase
- ⚠️ Highly Uncertain: The company must prove it can achieve profitability
- ⚠️ Depends on Execution: Success of TMG Social and quality of M&A are key
- ❌ Negative: Historical financial performance is worrying
Insights are generated using AI models and historical data for informational purposes only. They do not constitute investment advice or recommendations. Past performance is not indicative of future results.
About us: Ginlix AI is the AI Investment Copilot powered by real data, bridging advanced AI with professional financial databases to provide verifiable, truth-based answers. Please use the chat box below to ask any financial question.