In-depth Analysis of Datadog (DDOG) CTO's Stock Sale for Investors
Unlock More Features
Login to access AI-powered analysis, deep research reports and more advanced features

About us: Ginlix AI is the AI Investment Copilot powered by real data, bridging advanced AI with professional financial databases to provide verifiable, truth-based answers. Please use the chat box below to ask any financial question.
Related Stocks
The “$4.47 million” you mentioned has a discrepancy with publicly disclosed insider trading records. According to regulatory filings and market data, CTO Alexis Le-Quoc made multiple sales between November and December 2025 (e.g., November 24, December 2, December 8), with single transaction sizes ranging from hundreds of thousands to millions of dollars; some media estimates of the total amount of multiple transactions are around the $4 million level (between $4 million and $4.47 million). Therefore, a more accurate statement is: The CTO sold shares totaling approximately $4 million recently, not a single transaction of $4.47 million. Meanwhile, around December 2, multiple DDOG executives (CEO, CFO, COO, legal head, etc.) sold shares in a concentrated manner, not just the CTO alone.
Regarding market prices: Broker API shows the 52-week high is $201.69, while the transaction prices disclosed in relevant Form 4 and Form 144 from late November to early December ranged from $154.05 to $158.60, which did not reach the 52-week high. Therefore, this sale is in the “near high range but not the peak”.
- Stock Price Performance: As of December 31, 2025, DDOG closed at $135.99 with a market capitalization of $47.69 billion
- 52-Week Range: $81.63 – $201.69 (from broker API)
- Valuation: P/E ratio is approximately 444x (obvious high valuation characteristics)
- Recent Performance: 1 month -15.01%, 6 months +1.24%, 3 years +88.64%
- Analyst Targets: Consensus target price is $185.00, implying an upside potential of about 36%, with 80% of ratings being “Buy”
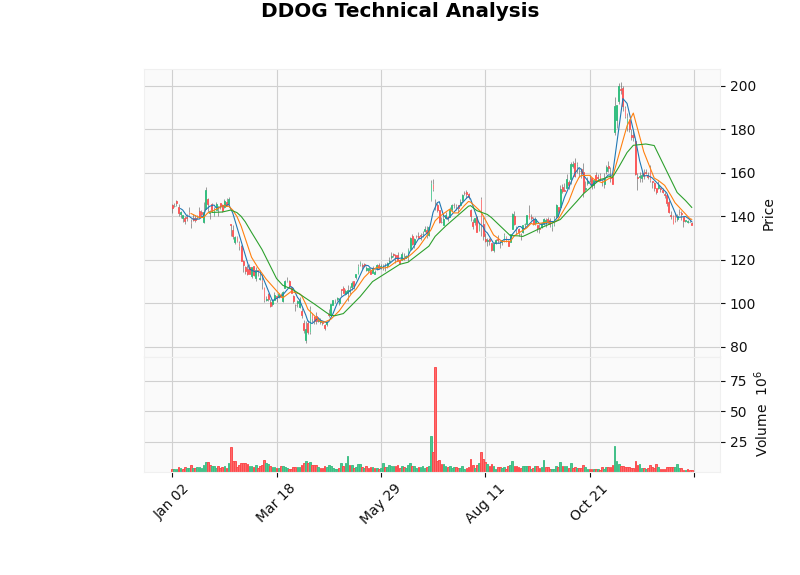
Technical analysis (January 1 to December 31, 2025) shows: Current trend is sideways/no obvious trend, with support at $133.95 and resistance at $144.13; MACD/KDJ are weak but do not form a clear breakdown. This is inconsistent with the claim that “trading volume increased significantly and broke below support”; the aforementioned technical tool conclusions should be followed (see chart below).
- Diversification and Liquidity Management: Under high volatility of tech stocks, executives diversifying single asset exposure is routine financial planning
- Pre-set Plans: Some transactions may be executions of 10b5-1 plans, which need further verification with SEC filings
- Synchronized Reduction by Multiple Executives: Multiple executives sold shares from late November to early December, indicating a group tendency of “concentrated profit-taking” rather than a single event
- Continuity: If the CTO and other executives continue to reduce holdings on a large scale in the following months, it may reflect a convergent adjustment of short-term growth expectations
- Timing and Stock Price: This sale occurred when the stock price was still significantly below the annual high ($201.69), indicating it was not “selling at the peak”; it is more likely to be cash-out at a phased high range
- Valuation Constraints: The current high valuation (P/E ~444x) amplifies sensitivity to growth realization; insider selling may be seen as an attitude towards short-term overvaluation
- Business and Products: The company has recently continuously released customer cases and product feature updates (cloud cost management, AI workload cost and performance observation, OCSF log processor, etc.), supporting long-term stickiness and customer unit price increase
- Quarterly Performance: According to public information, the company’s Q3 results exceeded expectations and raised its 2025 fiscal year guidance, indicating sound fundamentals
- Sector Environment: The software sector was under pressure in 2025, but there are divergent optimistic expectations for the 2026 outlook
- Analyst Attitude: Recently, many institutions maintained “Buy/Overweight” ratings, with target prices generally ranging from $105 to $215
- Mainly maintain a wait-and-see approach: Technicals are sideways with no clear directional signal; short-term may continue to oscillate between $133.95 and $144.13
- Follow up on subsequent regulatory filings: Observe whether there are new concentrated executive sales or 10b5-1 plan disclosures to determine if it is a “one-time profit-taking” or “continuous reduction trend”
- Fundamentals still provide support: If the company can deliver revenue growth and profit margin improvement under valuation pressure, the analyst target price of $185 is achievable
- Valuation and Delivery are Key: High valuation increases sensitivity to growth delivery; focus on quarterly guidance, customer unit price, and retention metrics
- Sector Allocation Weight: It is recommended to moderately control single high-valuation SaaS positions and reduce valuation volatility risks through portfolio diversification
Based on comprehensive evidence, this and recent insider reductions:
- Are more likely to be financial planning behaviors of “profit-taking + asset diversification” rather than “pessimistic signals” about the company’s fundamentals
- Synchronized reductions by multiple executives indicate a group behavior of “phased high-range cash-out” rather than a single event; caution is needed if there are larger-scale continuous reductions in subsequent months
- Before seeing continuous, large-scale insider selling, it should not be interpreted as a “bearish” indicator for the company’s future growth prospects
- Gilin API Data (real-time quotes, technical analysis, financial analysis, company overview)
- MarketBeat - “Datadog (DDOG) Insider Trading Activity 2025” (https://www.marketbeat.com/stocks/NASDAQ/DDOG/insider-trades/)
- TipRanks - “Datadog Executives Cash In: Massive Stock Sales Unveiled!” (https://www.tipranks.com/news/insider-trading/datadog-executives-cash-in-massive-stock-sales-unveiled-insider-trading)
- Investing.com - “Datadog (DDOG) CTO Le-Quoc Alexis sells $2.18 million in stock” (https://www.investing.com/news/insider-trading-news/datadog-ddog-cto-lequoc-alexis-sells-218-million-in-stock-93CH-4392350)
- Relevant SEC Form 4/Form 144 disclosures (indirectly cited through EDGAR public documents)
Insights are generated using AI models and historical data for informational purposes only. They do not constitute investment advice or recommendations. Past performance is not indicative of future results.
About us: Ginlix AI is the AI Investment Copilot powered by real data, bridging advanced AI with professional financial databases to provide verifiable, truth-based answers. Please use the chat box below to ask any financial question.