US Stock Year-End Decline and Failed Santa Claus Rally: Implications for Early 2025 Market Trends
Unlock More Features
Login to access AI-powered analysis, deep research reports and more advanced features

About us: Ginlix AI is the AI Investment Copilot powered by real data, bridging advanced AI with professional financial databases to provide verifiable, truth-based answers. Please use the chat box below to ask any financial question.
Related Stocks
According to data from broker API, major indices recorded declines from early December 2024 to early January 2025 [0]:
- S&P 500: -2.62%
- NASDAQ Composite: +0.29%
- Dow Jones Industrial: -5.30%
From a longer window of SPY (S&P 500 ETF) (2024-12-02 to 2025-01-15, 30 trading days), it fell about 1.69% during the period, which is similar to the above index statistics [0]. If we trace back to early November (custom Python statistical window: 2024-11-01 to 2025-01-15), SPY rose about 3.81% cumulatively, but there was a significant pullback in the year-end ‘Santa Claus Rally window’ (2024-12-24 to 2025-01-03), with a return of -1.55% in that window [0]. This means the ‘Santa Claus Rally’ (usually referring to the last 5 trading days of the year and the first 2 trading days of the next year) failed to deliver the historically common positive returns at the turn of 2024-2025.
From SPY’s daily line statistics (Python calculation, 2024-12-24 to 2025-01-03) [0]:
- Number of trading days:7
- Cumulative change:-1.55%
- Up days:3
- Down days:4
This result is significantly deviated from historical norms. Historical statistics show that since 1950, the S&P 500 has an average return of about +1.3% in this window, with an upward probability of about79% [1]. Recent analysis also points out that the ‘Santa Claus Rally’ at the end of 2024 not only failed to rise but even weakened for consecutive days in some trading days, raising questions about the effectiveness of this seasonal pattern [2].
- The Federal Reserve cut interest rates multiple times cumulatively in 2025, but the 10-year U.S. Treasury yield did not decline significantly synchronously, remaining at a relatively high level, which suppressed valuations [3].
- The AI and technology sectors are at high valuations, coupled with the potential erosion of profits by capital expenditures, raising concerns about valuation rationality [2][3].
###2) Policy and Macro Uncertainty
- Trade policy and tariff expectations fluctuate significantly, driving the market to have large swings in risk appetite and valuation discounts in 2025 [4].
- Geopolitics (such as the situation in the Middle East) have short-term impacts on energy prices and their spillover effects, which also increase market uncertainty [4].
###3) Market Sentiment and Technical Aspects
- The ‘VIX Fear Index’ was in the high range since December 2024 at the end of 2025, indicating that market volatility expectations still exist [2].
- Technically, the three major indices fluctuated and pulled back at key levels, indicating that upward momentum weakened阶段性 [0].
###1) Short-term (1-2 months)
- Volatility may remain at a relatively high level: macro and policy uncertainty, interest rate path and valuation pressure resonance may continue to amplify short-term volatility [2][3][4].
- Valuation pressure continues: if high-valued sectors lack support from marginal improvements in performance or liquidity, they still face correction or sideways consolidation pressure [3].
###2) Seasonal Window and Historical Clues
- The ‘January Effect’ (stronger in the first month of the year) is a long-term statistical feature, but its realization usually depends on marginal improvements in fundamentals and liquidity. If the ‘Santa Claus Rally’ fails to materialize, historically, the probability of pressure on the first quarter trend will increase [2]. It is worth noting that some analysis reviews point out that after the Santa Claus Rally was absent in 2024, the first quarter of 2025 did perform weakly [2].
###3) Structural Opportunities
- AI infrastructure-related industry chains, directions benefiting from interest rate cuts and capital expenditure improvements are still of concern to institutions. Some analysts expect AI-related targets to achieve profit improvement and valuation repair in the next year, becoming one of the main lines of structural market trends [5].
- Prioritize defense, strictly control positions and volatility: in a window with high uncertainty, moderately control portfolio volatility and reduce excessive exposure to high-beta varieties.
- Focus on safety margin and cash flow quality: focus on industry leaders with healthy balance sheets, stable cash flows and reasonable valuations.
- Dynamically assess macro and policy inflection points: pay attention to marginal signals of employment, inflation and interest rate paths, as well as trade policy progress, and adjust position structure and industry exposure in a timely manner.
- Grasp the rhythm from a long-term perspective: historical patterns are not iron laws, but can be used as scenario analysis tools. Before the macro situation becomes clear, respond to short-term volatility with batch layout and hedging thinking.
- The failure of this ‘Santa Claus Rally’ is the result of the combined effect of valuation, interest rates and macro uncertainty. Its deviation from historical seasonal patterns suggests that the market tends to be cautious in pricing risks and uncertainties at the end of the year.
- The early 2025 market will enter a ‘volatility verification period’: marginal changes in macro and earnings will dominate direction selection, and may continue to show high volatility and structural differentiation characteristics in the short term.
- Investment strategies should pay more attention to safety margins and liquidity management, carry out structural allocation around profit improvement and policy catalysis directions, and avoid unilateral betting on short-term trends.
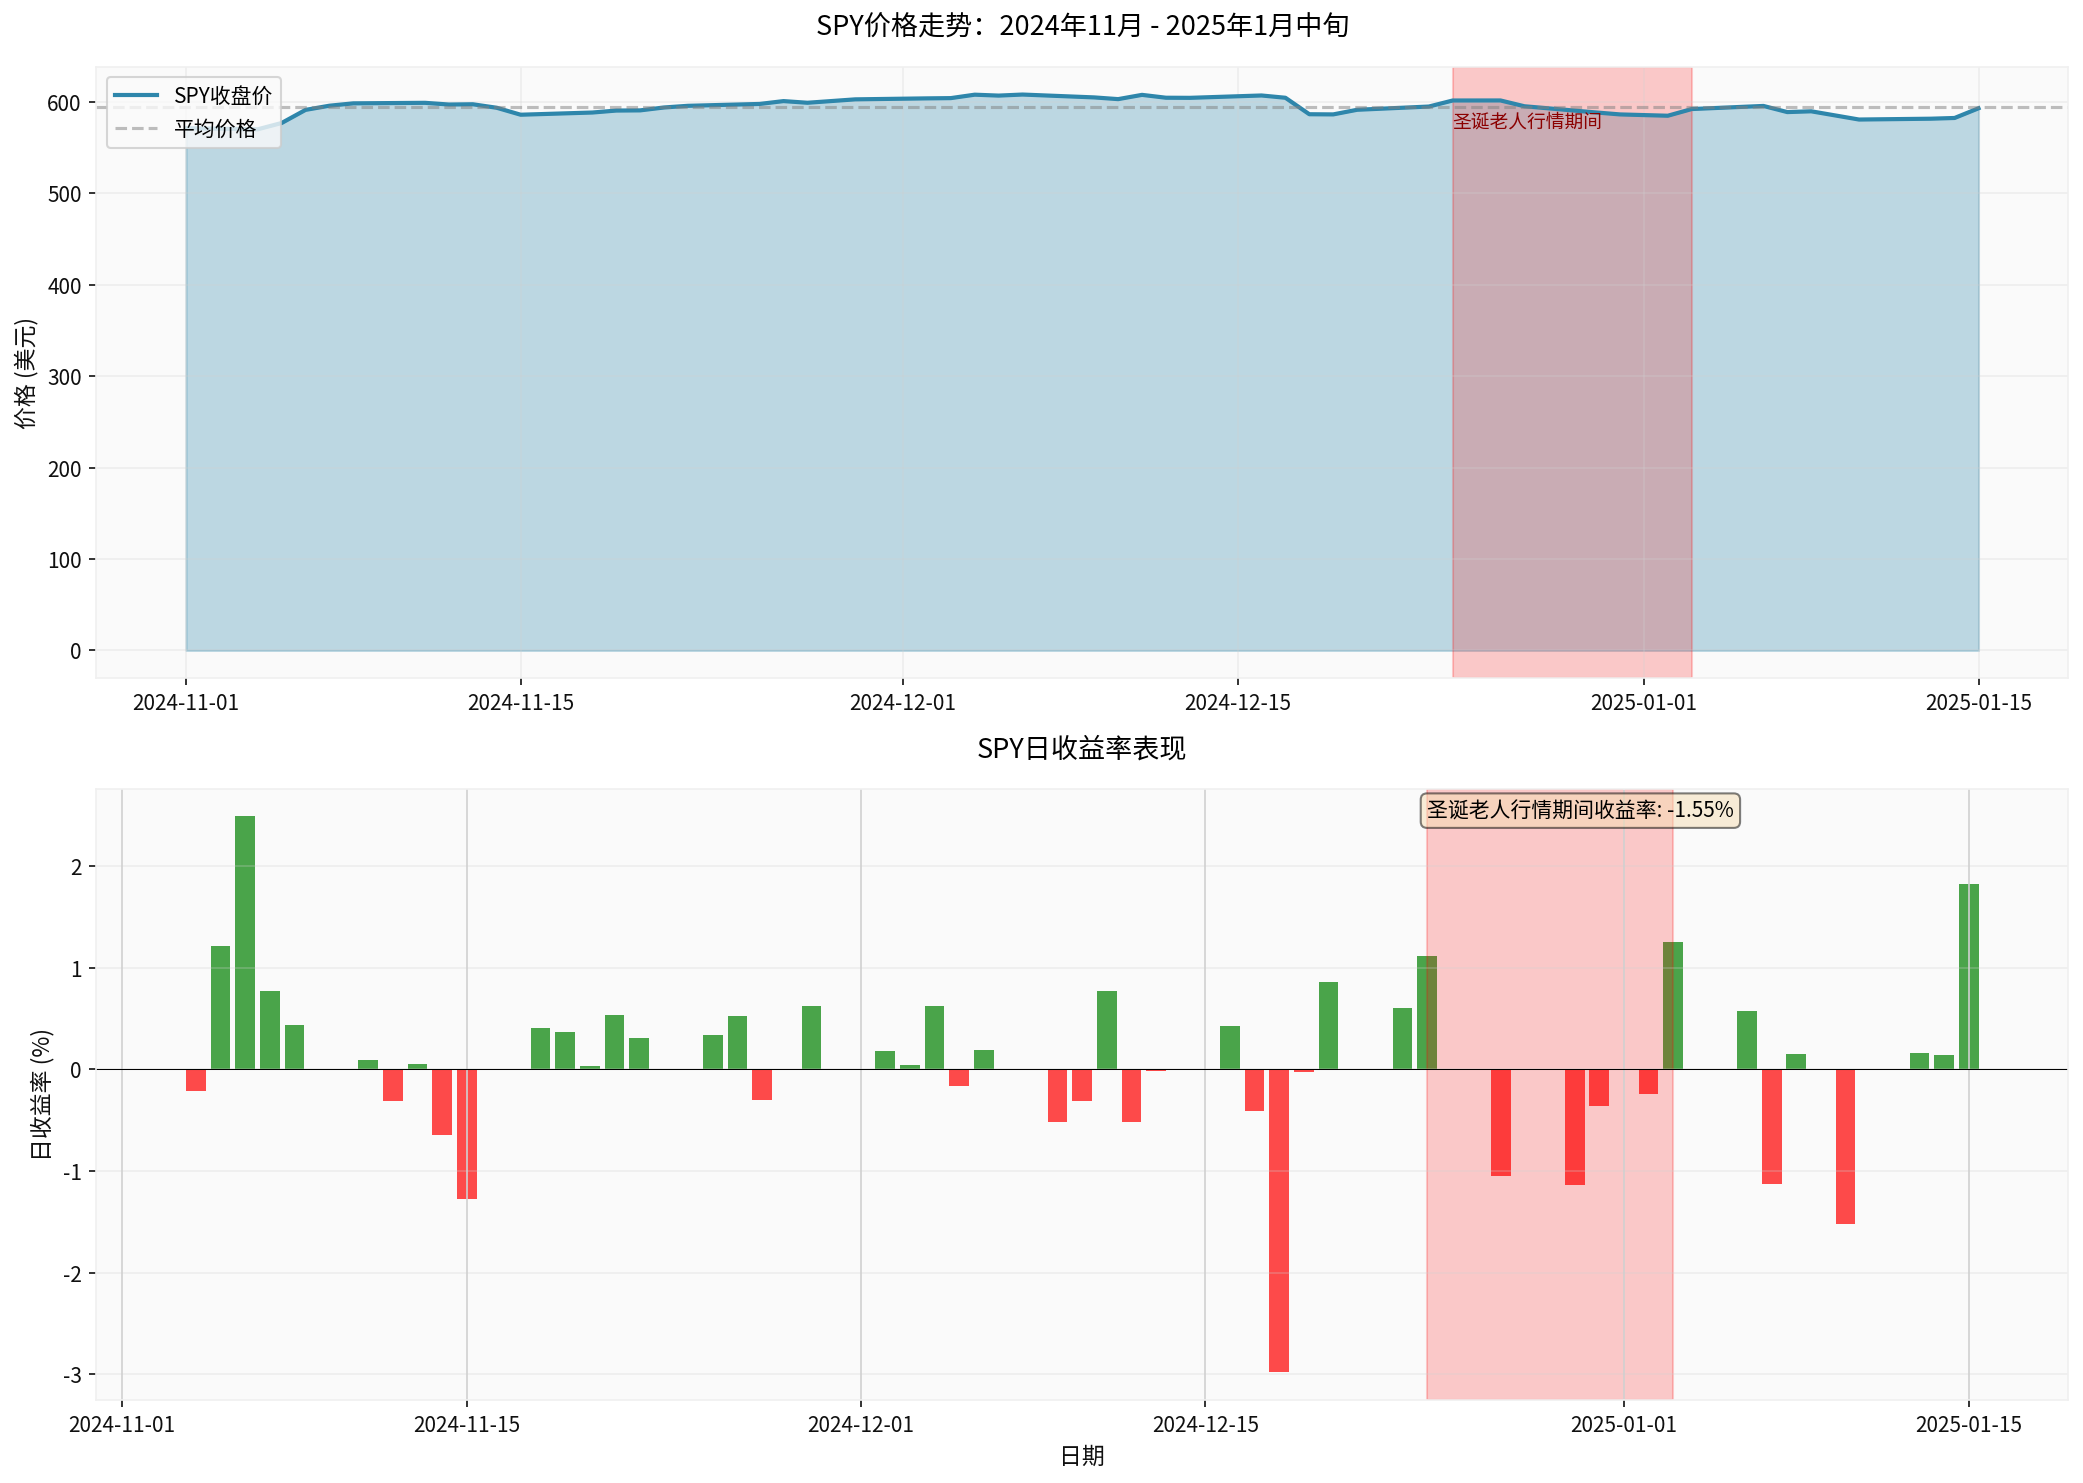
- The above chart shows the SPY closing price trend and mean reference line, with the red shadow marking the ‘Santa Claus Rally window’ (2024-12-24 to 2025-01-03).
- The following chart shows the daily return (green up, red down), and gives a statistical prompt of the cumulative return of -1.55% in this window.
- Data source and coverage: 2024-11-01 to 2025-01-15, from broker API daily data (Python statistics) [0].
[0] Gilin API Data (Market Indices, SPY Daily Line, Custom Python Statistics)
[1] NAGA - “Mastering the Santa Claus Rally: Seasonal Profits in Late December 2025?” (Historical statistics: average +1.3% since 1950, upward probability about79%)
[2] Morningstar/MarketWatch - “After 2 straight misses, this year’s ‘Santa Claus rally’ is off to a solid start: why it matters for investors” (Review of the absence of Santa Claus Rally in 2024 and the performance of the first quarter)
[3] Money.com - “Will the Stock Market Finally Get a ‘Santa Claus Rally’ This Year?” (Analysis of the constraints of interest rates and bond yields on the market)
[4] Reuters - “What just happened? Ten charts to help make sense of markets in 2025” (Trade policy, geopolitics and market impact)
[5] Yahoo Finance - “5 Stocks Set to Start Strong in January and Lead Through 2026” (AI and related targets’ structural opportunity outlook)
Insights are generated using AI models and historical data for informational purposes only. They do not constitute investment advice or recommendations. Past performance is not indicative of future results.
About us: Ginlix AI is the AI Investment Copilot powered by real data, bridging advanced AI with professional financial databases to provide verifiable, truth-based answers. Please use the chat box below to ask any financial question.