In-depth Analysis of Investment Allocation in the Energy Sector Amid Sustained Decline of Brent Crude in 2025
Unlock More Features
Login to access AI-powered analysis, deep research reports and more advanced features
About us: Ginlix AI is the AI Investment Copilot powered by real data, bridging advanced AI with professional financial databases to provide verifiable, truth-based answers. Please use the chat box below to ask any financial question.
Related Stocks
The crude oil market experienced a significant decline in 2025:
- Cumulative Return: -9.35%[0]
- Maximum Drawdown: -26.05%[0]
- Annualized Volatility: 30.77%[0]
- Current Price: $69.74[0]
Brent crude has fallen approximately 19% year-to-date, marking the largest annual drop since 2020 and heading toward the longest annual loss cycle in history[1,2]. Key drivers include:
- Worsening global supply surplus: IEA predicts supply will exceed demand by about 3.84 million barrels per day in 2026[3]
- Potential release of more Russian crude supply from Russia-Ukraine peace talks[3]
- Weak Chinese economic data affecting demand expectations[1]
Despite falling oil prices, the energy sector showed resilience:
- XLE (Energy ETF): +3.76%[0]
- Volatility: 24.72% (lower than crude but higher than the broader market)[0]
- Maximum Drawdown: -18.80%[0]
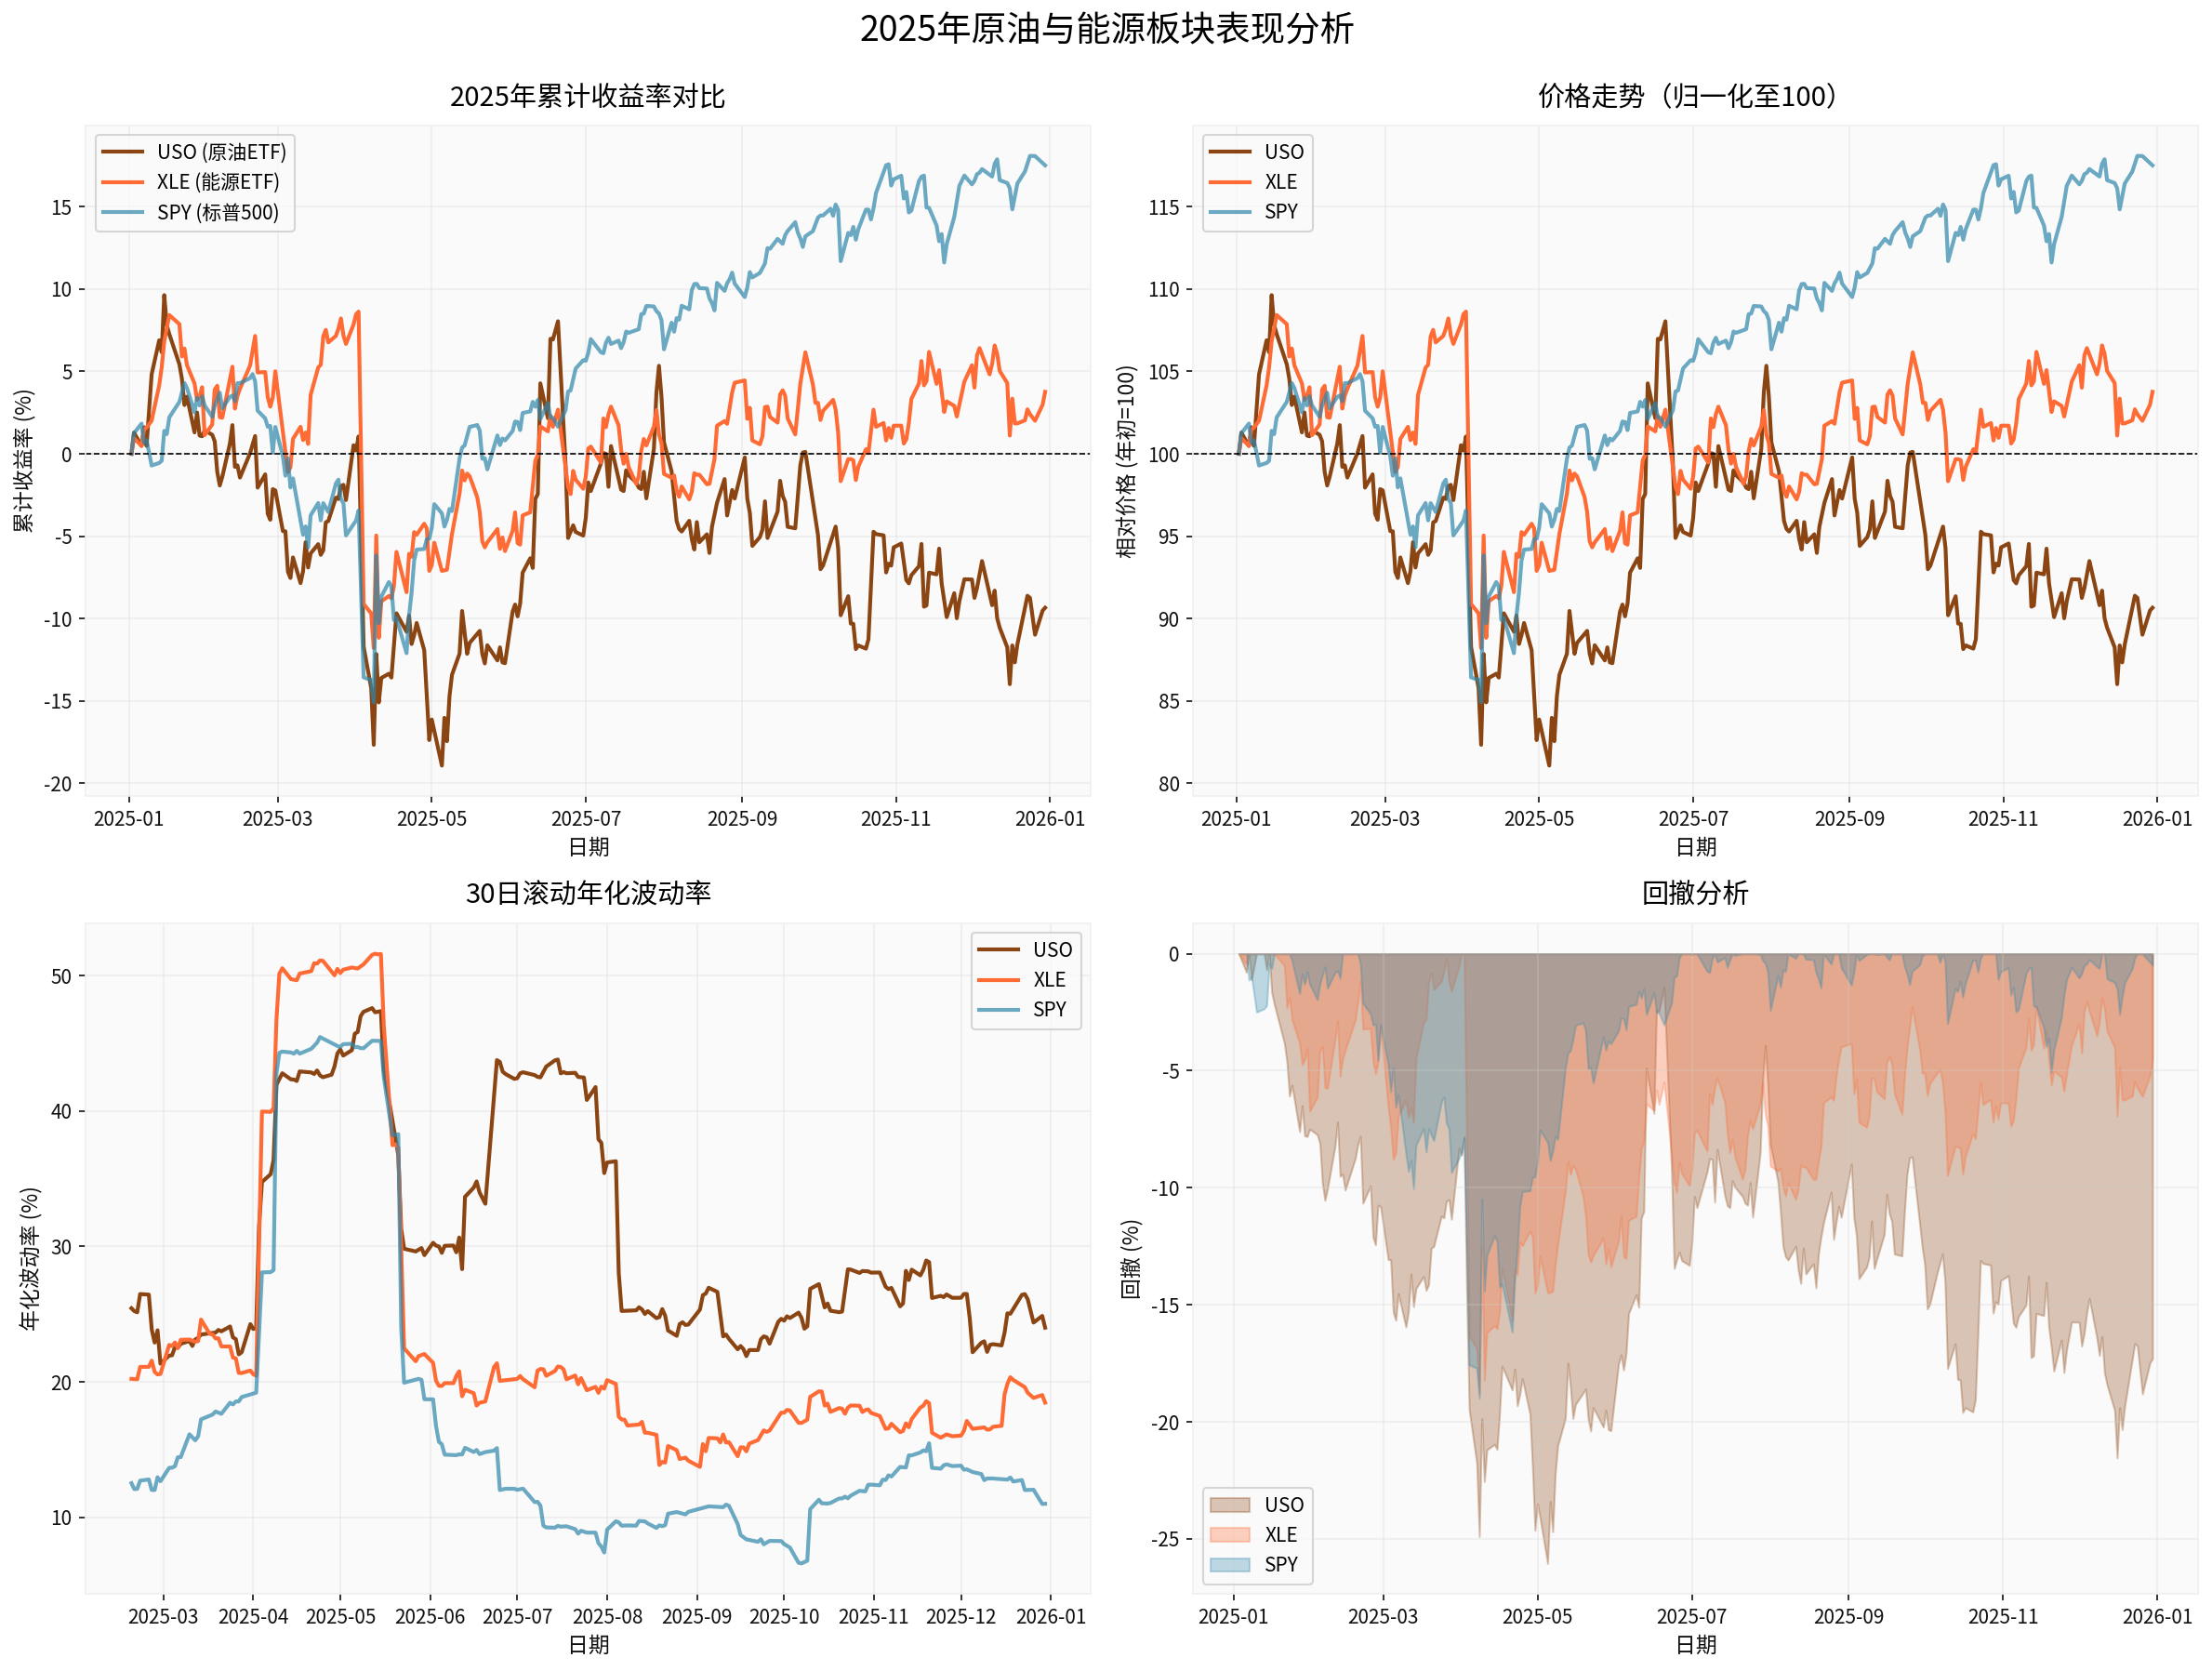
The chart shows that crude oil prices (USO) declined significantly in 2025, while energy stocks (XLE) demonstrated stronger resilience—underperforming the S&P 500 (SPY) but maintaining positive returns.
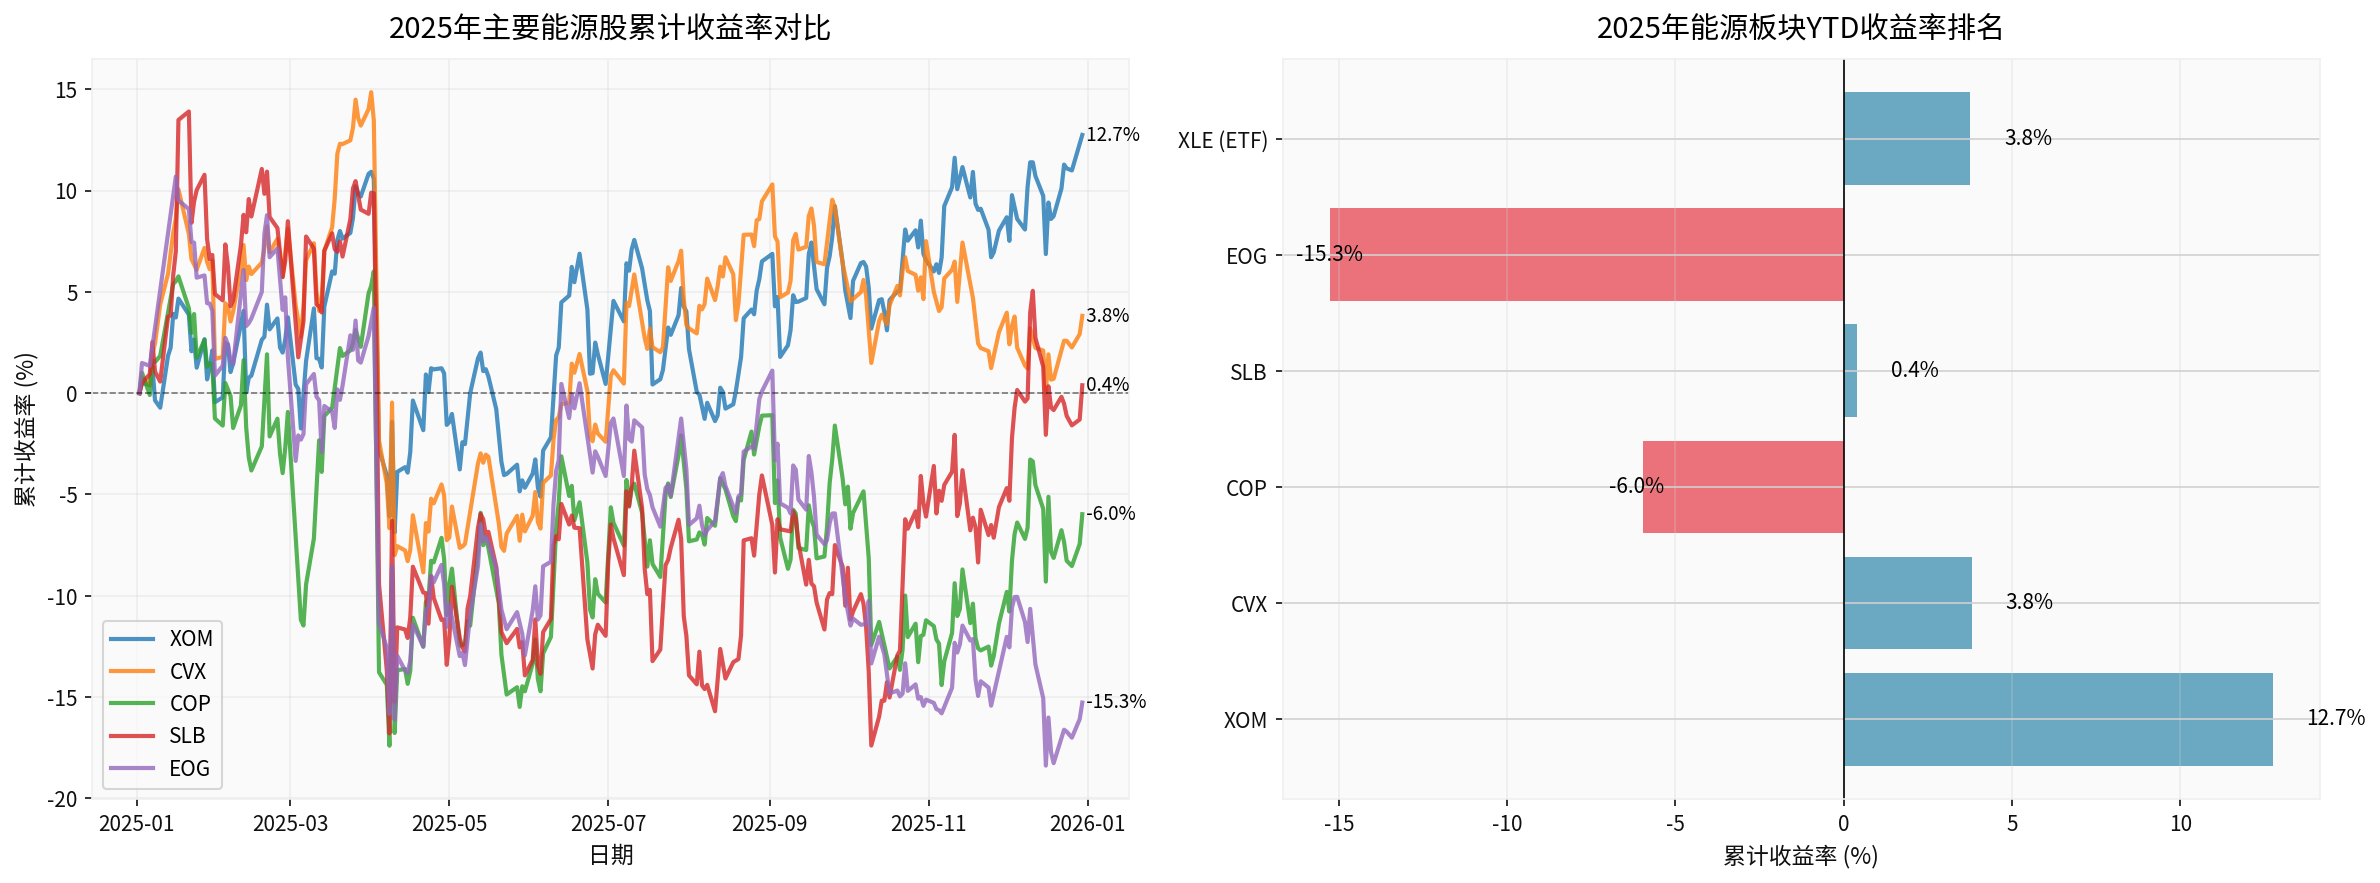
| Stock | Company Name | YTD Return | Volatility | Maximum Drawdown | Investment Logic |
|---|---|---|---|---|---|
XOM |
ExxonMobil | +12.75% [0] |
23.60% | -16.05% | Integrated giant with significant cost advantages |
CVX |
Chevron | +3.82%[0] | 24.50% | -20.64% | High-quality assets but slowing growth |
SLB |
Schlumberger | +0.39%[0] | 36.50% | -27.48% | Oilfield services leader, affected by capital expenditures |
COP |
ConocoPhillips | -5.98%[0] | 34.02% | -22.09% | Pure exploration and production, high oil price sensitivity |
EOG |
EOG Energy | -15.28%[0] | 28.74% | -26.27% | Shale oil representative, cost pressure emerging |
XLE |
Energy ETF | +3.76%[0] | 24.72% | -18.80% | Sector average level |
ExxonMobil hit a new 52-week high in 2025 despite a nearly 20% drop in oil prices[4], revealing a
- Downstream Business Hedge: Refining operations benefit from low-price environments
- Cost Advantage: Guyana project has a break-even point of only $30/barrel[4]
- Dividend Stability: Track record of maintaining dividends during the 2020 pandemic赢得 investor trust[4]
- Balance Sheet Strength: Sufficient cash flow to support dividends and buybacks
Based on 2025 market performance, we propose the following allocation framework:
- Downstream business provides natural hedging
- Global asset distribution reduces geopolitical risks
- Strong cash flow supports shareholder returns
- XOM (ExxonMobil): Top choice with excellent cost control and project management capabilities[4]
- CVX (Chevron): Second choice with high asset quality but slightly weaker growth momentum
- Pipeline companies (e.g., KMI, EPD)
- LNG export facilities
- Stable-fee energy infrastructure
- Decoupled from oil prices, more dependent on throughput
- High dividend yield (usually 6-9%)
- Long contract terms, predictable cash flow
- Wait for signals of industry capital expenditure recovery
- Focus on leading enterprises with technological leadership and obvious cost advantages
- SLB (Schlumberger): As an industry leader, it only fell slightly by 0.39% in2025, showing relative resilience
- COP and EOG fell by5.98% and15.28% respectively in 2025[0]
- Highest sensitivity to oil prices, large downside risks
- Cost curve of U.S. shale oil is shifting upward, competitiveness declining
###3.2 Summary of Allocation Recommendations
| Allocation Tier | Asset Class | Recommended Weight | Key Targets | Risk-Return Profile |
|---|---|---|---|---|
Core |
Integrated Oil Companies | 30-40% | XOM, CVX | Medium risk, stable dividends |
Defensive |
Midstream Infrastructure | 20-30% | MLPs, Pipelines | Low risk, high dividends |
Tactical |
Oilfield Services & Equipment | 10-20% | SLB, HAL | Medium-high risk, cyclical |
Avoid |
Pure Upstream Exploration | 0-5% | COP, EOG | High risk, oil price-sensitive |
###4.1 Key Risk Factors
-
Risk of Further Oil Price Decline
- Current Brent is around $60; if it falls below $50, it may trigger a second round of decline in energy stocks
- Monitor signs of U.S. shale oil production cuts
-
Geopolitical Risks
- Progress in Russia-Ukraine peace talks may release more supply[3]
- Situation in the Middle East remains a potential catalyst
-
Demand-side Risks
- Strength of China’s economic recovery[1]
- Global economic growth slowdown
- Accelerated substitution by new energy
###4.2 Tactical Adjustment Signals
- Oil price stabilizes and breaks through the $70 resistance level
- OPEC+ deepens production cuts
- Significant decline in U.S. shale oil production
- Inflection point in China’s demand
- Oil price falls below the $55 support level
- Clear signs of global recession
- Unexpected tightening of new energy policies
###5.1 Position Shift of Traditional Energy
- From Growth Stocks to Value Stocks: Energy stocks are gradually becoming “cash cows” rather than growth stories
- Dividends + Buybacks as Main Return Sources: Enhanced capital expenditure discipline, abundant free cash flow
###5.2 Energy Transition-related Opportunities
Despite pressure on traditional energy, the following areas are worth attention:
- LNG Infrastructure: Strengthened role of natural gas as a transition energy
- Carbon Management Services: Commercialization of CCUS technology
- Grid Modernization: Demand for new energy grid connection
[0] Gilin API Data - Crude Oil & Energy Sector Price Data, Technical Indicators & Python Calculation Results
[1] Yahoo Finance Hong Kong - “〈Energy After Hours〉Global Supply Surplus and Prospects of Russia-Ukraine Peace Overshadow U.S.-Venezuela Tensions, Crude Oil Under Pressure to Fall” (https://hk.finance.yahoo.com/news/能源盤後-全球供應過剩-俄烏和平現曙光-蓋過美委關係激化-原油承壓走跌-220246461.html)
[2] Yahoo Finance Hong Kong - “〈Energy After Hours〉Supply Surplus Shadow Looms, Crude Oil Plunges Over 2% Toward Largest Annual Drop Since 2020” (https://hk.finance.yahoo.com/news/能源盤後-供給過剩陰影籠罩-原油重挫逾2-邁向2020年以來最大年跌幅-213428311.html)
[3] Yahoo Finance Hong Kong - “Brent Crude Falls Below $60 Amid Supply Surplus and Russia-Ukraine Ceasefire Talks” (https://hk.finance.yahoo.com/news/布倫特原油跌破60美元-受供應過剩及俄烏停火談判影響-143119051.html)
[4] Yahoo Finance - “Why Exxon Mobil Stock Just Hit a New 52-Week High While Oil Prices Tanked 20%” (https://finance.yahoo.com/news/why-exxon-mobil-stock-just-153022986.html)
Insights are generated using AI models and historical data for informational purposes only. They do not constitute investment advice or recommendations. Past performance is not indicative of future results.
About us: Ginlix AI is the AI Investment Copilot powered by real data, bridging advanced AI with professional financial databases to provide verifiable, truth-based answers. Please use the chat box below to ask any financial question.