In-depth Analysis of the Impact of L3 Autonomous Driving Commercialization on the Valuation and Profit Paths of Changan Automobile and BAIC BluePark
Unlock More Features
Login to access AI-powered analysis, deep research reports and more advanced features

About us: Ginlix AI is the AI Investment Copilot powered by real data, bridging advanced AI with professional financial databases to provide verifiable, truth-based answers. Please use the chat box below to ask any financial question.
Related Stocks
I will provide you with a systematic analysis of the impact of L3 autonomous driving commercialization on the valuation of Changan Automobile and BAIC BluePark.
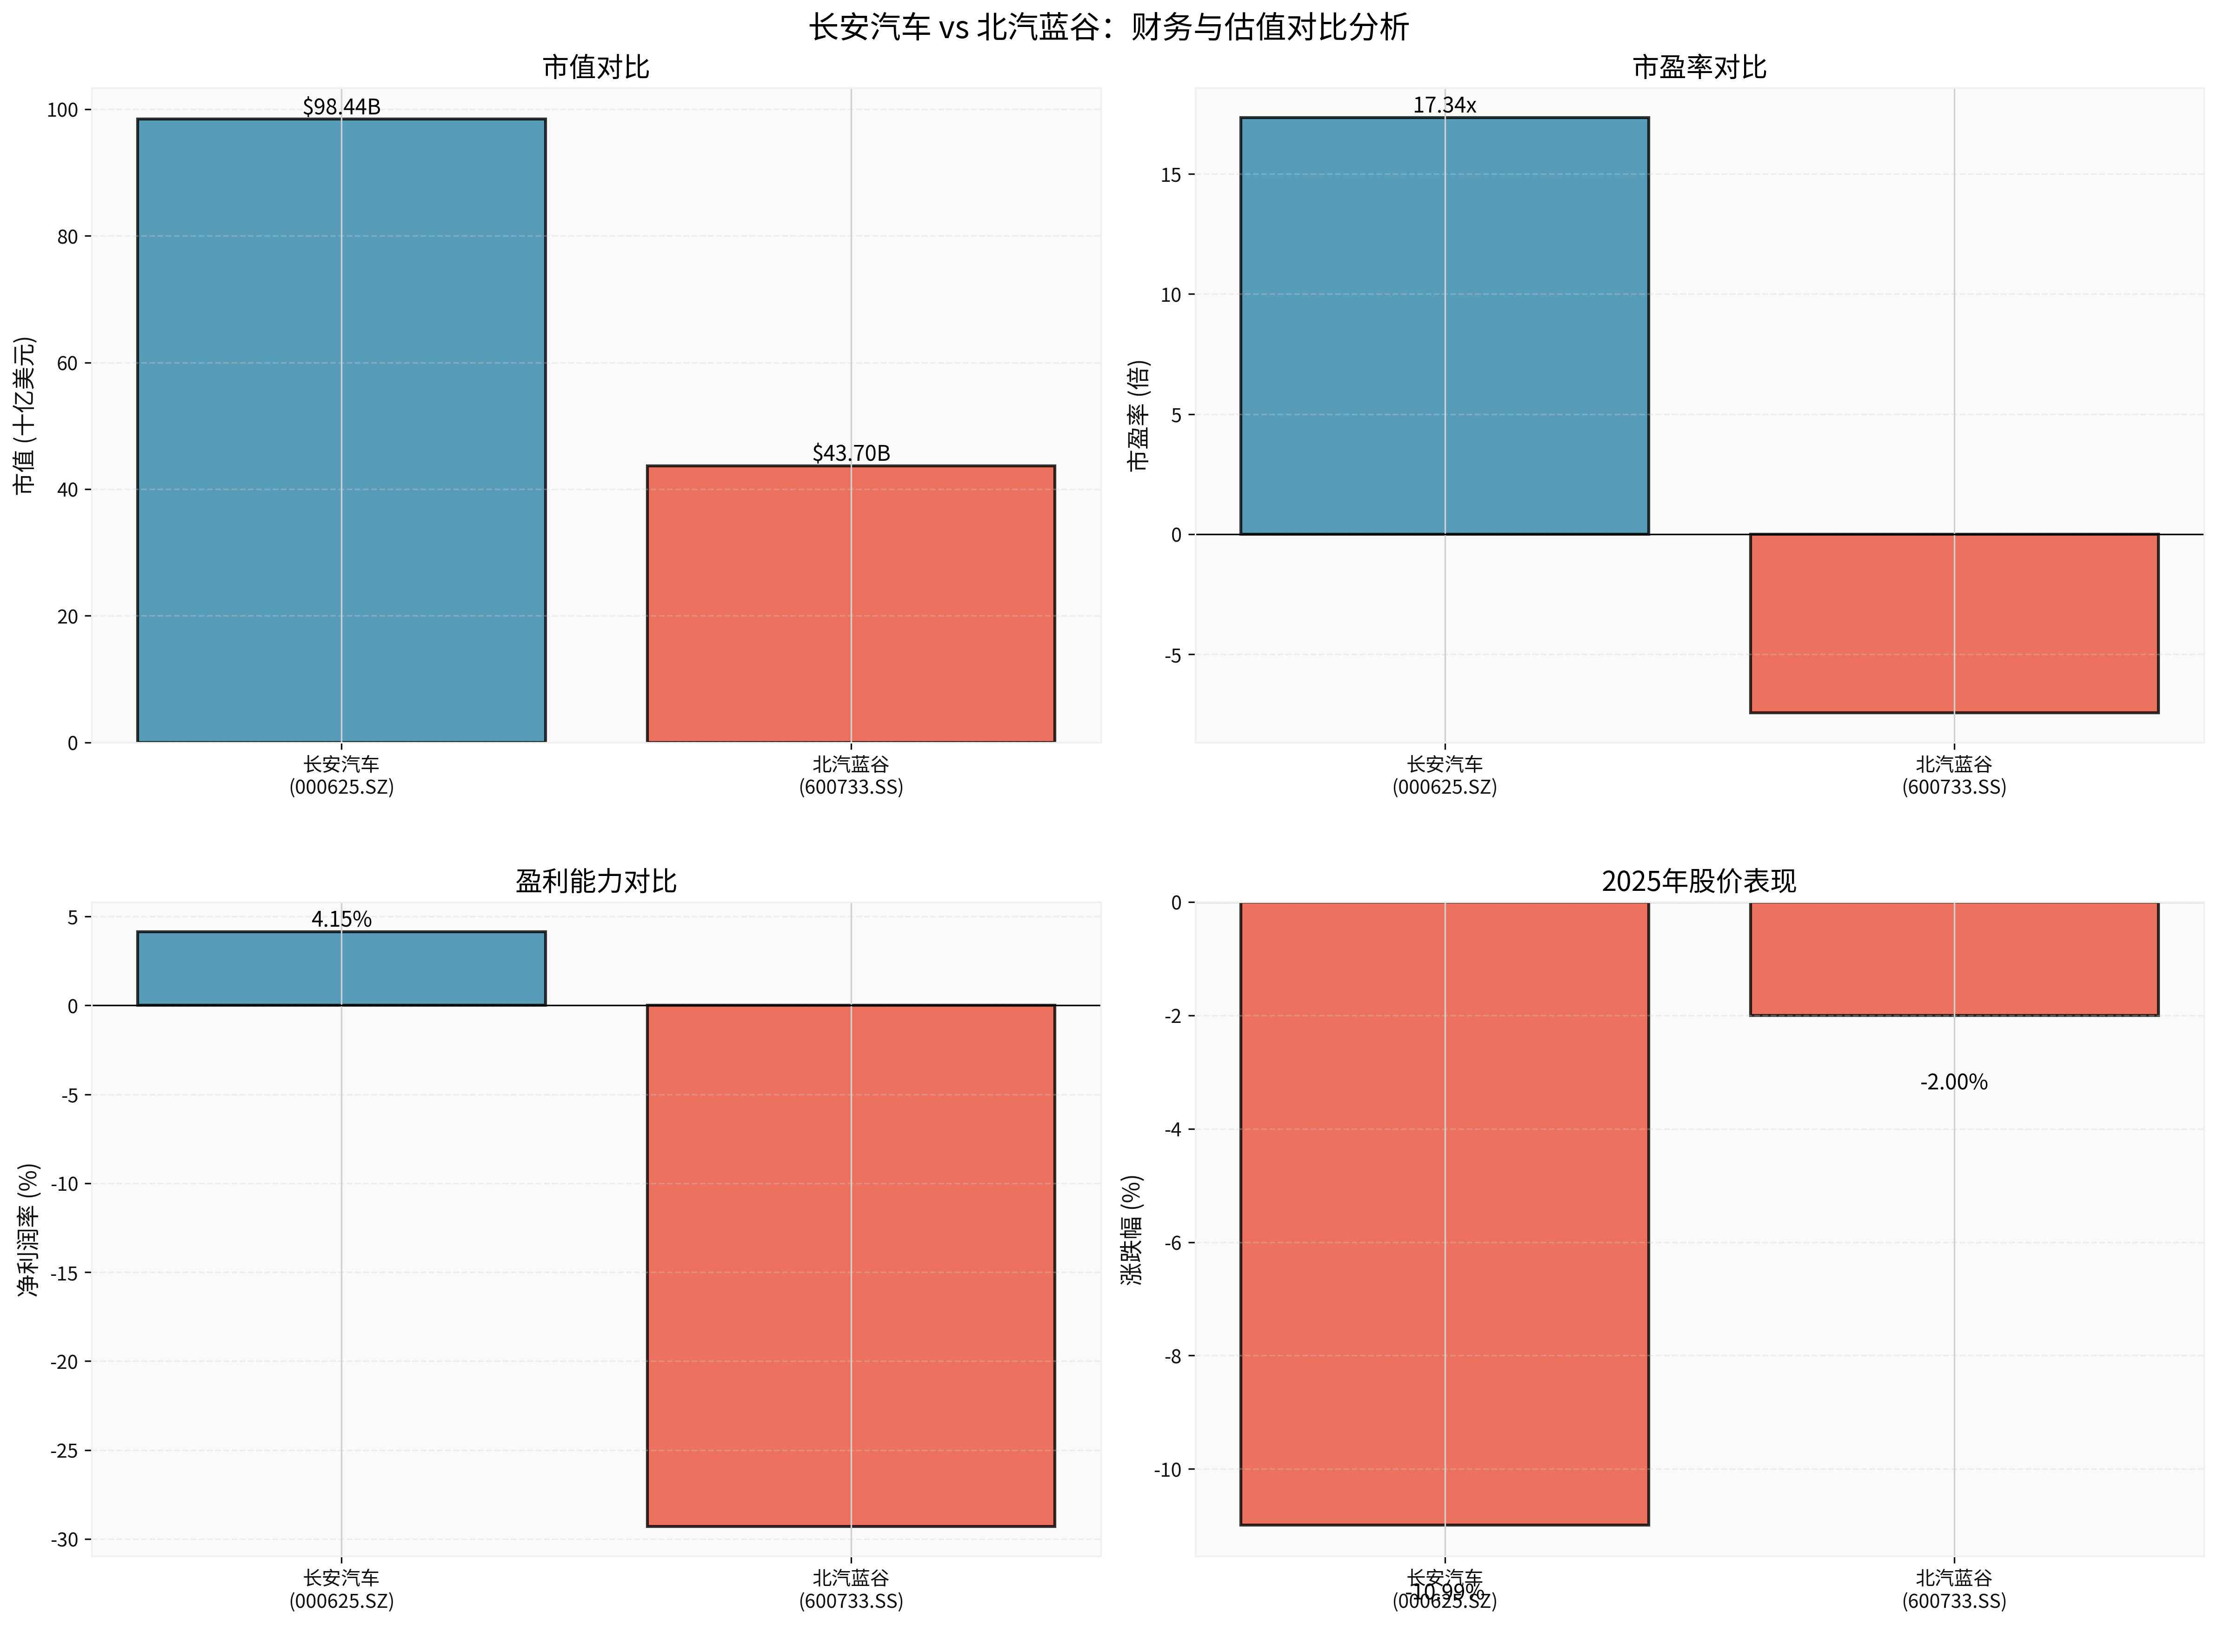
Based on the latest financial data [0], Changan Automobile and BAIC BluePark show significant differences:
- Market Cap: 98.44 billion USD
- P/E Ratio: 17.34x (positive, profitable)
- P/B Ratio: 1.53x
- ROE: 8.83%
- Net Profit Margin:4.15%
- 2025 Stock Performance: Down 10.99% [0]
- Market Cap:43.7 billion USD
- P/E Ratio: -7.43x (continuous loss)
- P/B Ratio:20.94x (overvalued)
- ROE: -153.23%
- Net Profit Margin: -29.30%
- 2025 Stock Performance: Down 2.00% [0]
In terms of financial health, Changan Automobile has a sound financial position with low debt risk; BAIC BluePark faces moderate debt risk, with free cash flow of -4.127 billion USD [0], and its profitability is a concern.
- Policy Dividend: The first batch of L3 access permits from the Ministry of Industry and Information Technology marks a policy breakthrough, paving the way for commercialization in pilot cities.
- Technology Premium: Approved models can gain a market position of technological leadership and brand premium.
- Valuation Expectation Upgrade: Market expectations for the future of intelligent driving may push up valuation multiples.
- Cost Pressure: L3 redundant systems add about 30,000 USD per vehicle, directly compressing gross margins.
- Liability Risk: Automakers need to bear product liability and purchase liability insurance of no less than 5 million USD, increasing operating costs.
- Lack of User Trust: Technical issues such as “phantom braking” and hesitant lane changes affect reputation.
- Strong profitability (net profit margin of4.15%) can partially absorb L3 R&D costs.
- P/E ratio of17.34x is in a reasonable range; L3 theme is expected to push valuation to 20-22x.
- L3-related businesses are expected to contribute revenue growth in 2026, but net profit contribution is limited.
- Continuous loss (net profit margin of-29.30%) means L3 investment will further worsen short-term profitability.
- P/B ratio of20.94x is already overvalued; L3 theme is difficult to support higher valuation.
- Need to be alert to L3 R&D investment exacerbating cash flow pressure (free cash flow of-4.127 billion USD) [0].
###2.2 Long-term Impact (2027-2029)
According to Daiwa’s forecast, China’s passenger car L3 penetration rate will be about1% in 2026, corresponding to sales of 257,000 units [1]. With technological maturity and cost reduction, L3 is expected to become a standard feature for high-end models.
- L3 technology monetization capability (subscription services, Robotaxi, etc.)
- Data asset value (autonomous driving training data)
- Ecosystem building capability
###3.1 L3 vs L2 Cost Structure Comparison
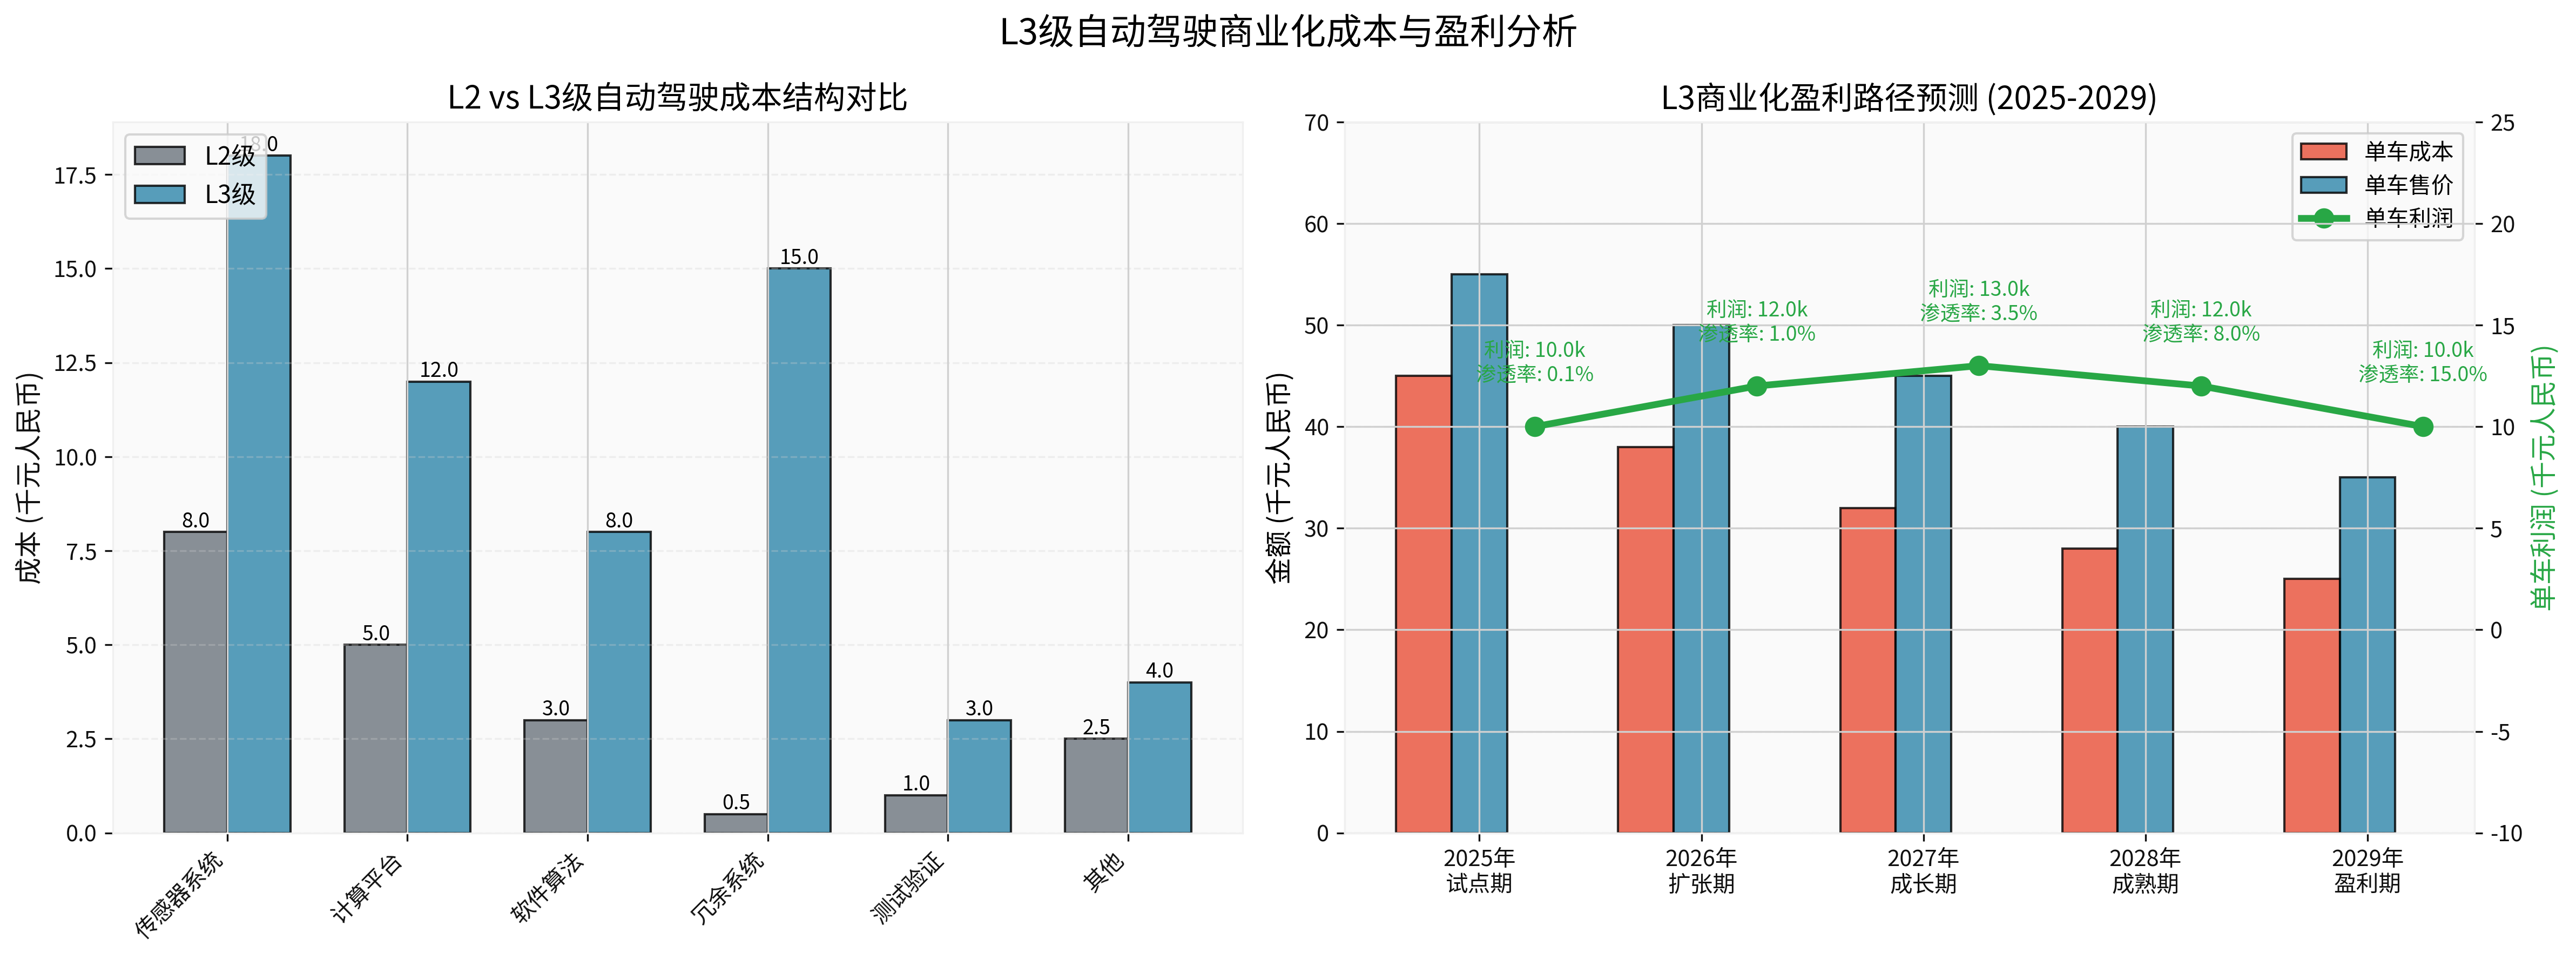
- Redundant Systems: From 500 USD to15,000 USD (+30x), including backup systems for braking, steering, and power supply.
- Sensor Systems: From8,000 USD to18,000 USD (+125%), with upgrades to lidar and high-precision cameras.
- Computing Platform: From5,000 USD to12,000 USD (+140%), demand for higher computing power chips.
###3.2 Profit Path Timeline Forecast
- L3 Penetration Rate:0.1%
- Profit per Vehicle: About10,000 USD (high-end model pilot)
- Stage Feature: Focus on brand building and data accumulation.
- L3 Penetration Rate:1.0% (257,000 units) [1]
- Profit per Vehicle: About12,000 USD
- Stage Feature: Scale cost reduction begins to emerge.
- L3 Penetration Rate:3.5%
- Profit per Vehicle: About13,000 USD
- Stage Feature: Supply chain maturity leads to significant cost reduction.
- L3 Penetration Rate:8.0%
- Profit per Vehicle: About12,000 USD
- Stage Feature: Price competition intensifies, profit margin is under pressure.
- L3 Penetration Rate:15.0%
- Profit per Vehicle: About10,000 USD
- Stage Feature: Aftermarket services (subscription, insurance, data) become the main profit source.
###4.1 Hardware Business Profit Time Point
- Relying on scale effect (2025 revenue of42.24 billion USD) [0], can分摊 L3 R&D costs.
- Expected L3 model sales to exceed30,000 units in2026, hardware business to achieve break-even.
- L3 business is expected to contribute net profit of500-800 million USD in2027.
- Under loss background (2025 Q3 net loss of117 million USD) [0], L3 investment extends profit time.
- Need to rely on external financing or government subsidies to maintain R&D investment.
- Only when L3 penetration rate rises to8% in2028 can it possibly achieve overall profitability.
###4.2 Software and Service Profit Time Point
- Referring to Tesla’s FSD model, L3 function subscription fee is about10,000-20,000 USD per year.
- User base needs to reach more than500,000 to achieve profitability.
- Need policy to fully liberalize L3 commercial restrictions.
- Technical maturity reaches 99.999% reliability.
- Per-vehicle operating cost drops to below50% of traditional taxis.
- Selling autonomous driving training data to third parties.
- High-precision map update services.
- Expected data services to contribute10-15% of revenue in2028.
###5.1 Technical Cost Rise Challenge
- Redundant system cost ratio rises from2.5% to25%
- L3 R&D investment needs 2-3 billion USD per year
- High supply chain dependence (lidar, high computing power chips)
- Technology Sharing Alliance: Automakers jointly develop L3 platforms to share costs.
- Deep Supplier Binding: Lock supply prices through strategic investment.
- Modular Design: Progressive upgrade from L2 to L3 to L4 to reduce one-time investment.
###5.2 User Trust Repair Challenge
- Frequent “phantom braking” incidents affect reputation.
- Unclear liability definition causes user concerns.
- Technical reliability fails to meet user expectations.
- Liability Insurance Coverage: 5 million USD liability insurance reduces user risk concerns.
- Transparent Communication: Open test data to establish trust mechanisms.
- Regional Promotion: Start from pilot cities with simple road conditions.
- User Experience Optimization: Progressive function release to reduce learning costs.
###6.1 Changan Automobile (000625.SZ)
- Sound profitability can support L3 R&D investment.
- Deepal SL03获 L3 permit, leading technical reserve.
- L3 penetration rate increase in2026 will bring performance elasticity.
- Reasonable valuation (PE17.34x) with upside potential.
- Basic Business:15x PE ×0.69 USD EPS =10.35 USD
- L3 Business Premium:3-5 USD (based on 2027 expectations)
- Target Price:13.35-15.35 USD
###6.2 BAIC BluePark (600733.SS)
- Continuous loss, L3 investment exacerbates financial pressure.
- Arcfox Alpha S获 L3 permit, but scale is limited.
- Rely on Huawei’s technical empowerment, but cooperation model has uncertainty.
- P/B ratio of20.94x is overvalued, need to be alert to correction risk.
- Tight cash flow (free cash flow of-4.127 billion USD) [0]
- Difficult to achieve profitability before2026
- L3 commercialization progress is slower than expected.
###7.1 Key Assumptions
- Policy Assumption: First-tier cities like Beijing and Shanghai fully liberalize L3 commercial use in2026.
- Technology Assumption: L3 system cost drops to400,000 USD per vehicle in2027.
- Market Assumption: L3 penetration rate reaches25-30% in2030.
- Competition Assumption: Tesla, Xpeng, etc. accelerate L3 deployment.
###7.2 Sensitivity Analysis
- Changan Automobile Target Price:18 USD
- BAIC BluePark Target Price:10 USD
- L3 profit time advanced to Q42025.
- Changan Automobile Target Price:9 USD
- BAIC BluePark Target Price:5 USD
- L3 profit time delayed to2030.
-
Differentiated Impact of L3 Commercialization on Valuation: Changan Automobile benefits from sound fundamentals; L3 theme is expected to push valuation to20x PE. BAIC BluePark is under loss pressure; L3 is difficult to support higher valuation.
-
Company-specific Profit Time Points: Changan Automobile is expected to achieve break-even for L3 business in Q42026; BAIC BluePark needs to wait until Q22028.
-
Dual Tests of Technical Cost and User Trust: Redundant system cost increases by30,000 USD per vehicle; 5 million USD liability insurance requires automakers to bear product liability, short-term profit under pressure; user trust repair takes2-3 years.
-
Long-term Value Lies in Software and Services: Hardware profit will be compressed; subscription services, Robotaxi, and data services will become main profit sources, expected to be gradually realized from2027 to2029.
[0] Gilin API Data - Company Fundamentals, Financial Analysis, Market Data
[1] Daiwa Report - “China’s Passenger Car L3 Penetration Rate to Reach ~1% Next Year with Sales of 257,000 Units” (https://hk.finance.yahoo.com/news/大和-明年中國乘用軋l3級滲透率約1-銷量25-7萬輛-料3股受惠-025442367.html)
[2] WSJ - “Xpeng Motors获准在广州测试L3级自动驾驶技术” (https://cn.wsj.com/articles/小鹏汽车获准在广州测试l3级自动驾驶技术-a6664a39)
Insights are generated using AI models and historical data for informational purposes only. They do not constitute investment advice or recommendations. Past performance is not indicative of future results.
About us: Ginlix AI is the AI Investment Copilot powered by real data, bridging advanced AI with professional financial databases to provide verifiable, truth-based answers. Please use the chat box below to ask any financial question.