Gold Price Breaks $4400: Analysis of Driving Factors and Investment Implications
Unlock More Features
Login to access AI-powered analysis, deep research reports and more advanced features

About us: Ginlix AI is the AI Investment Copilot powered by real data, bridging advanced AI with professional financial databases to provide verifiable, truth-based answers. Please use the chat box below to ask any financial question.
Related Stocks
Based on brokerage API data and market research, I will provide you with a comprehensive analysis report.
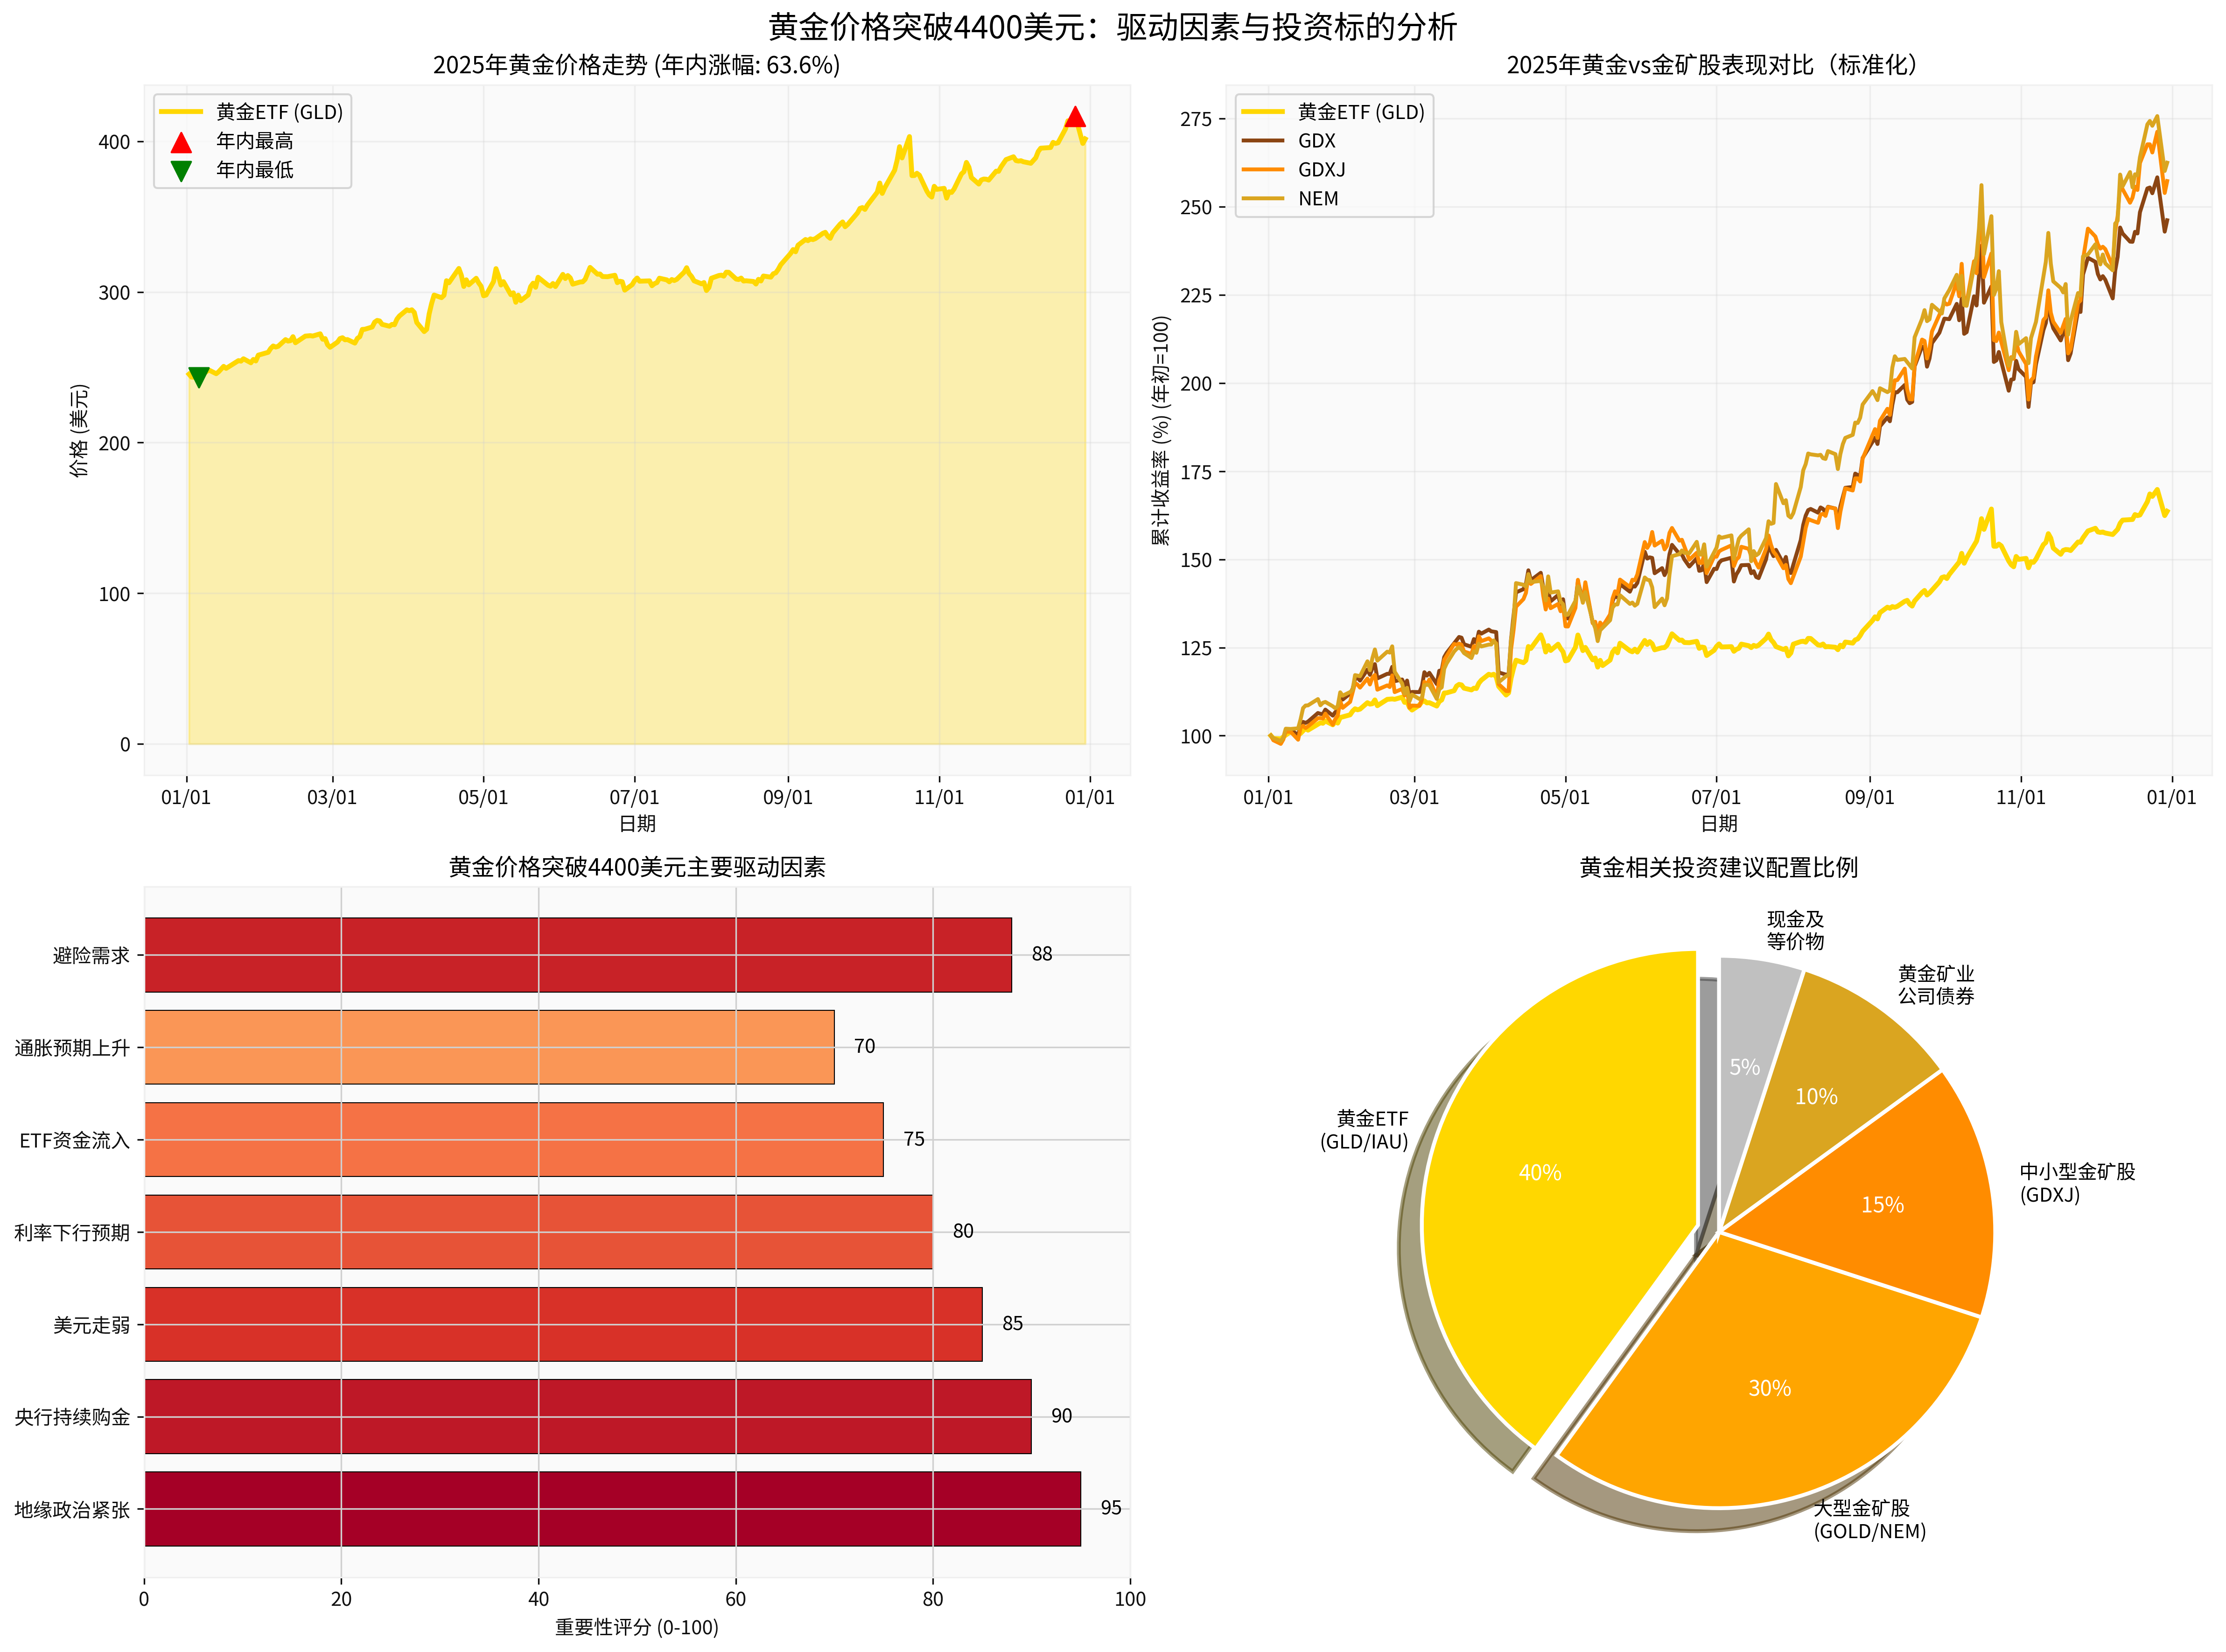
According to the latest market data [0], gold achieved a historic breakthrough in 2025:
- GLD Gold ETF up 63.63% YTD: Soared from $245.42 at the start of the year to $401.57 at year-end
- Annual High: $418.45: Hit a record high (December 26)
- Annual Volatility: 72.88%: Indicates strong upward momentum
- NEM (Newmont): YTD gain of 162.47%
- GDXJ (Junior Gold Miners ETF): YTD gain of 157.26%
- GDX (Gold Miners ETF): YTD gain of 146.15%
Geopolitical risks continued to rise in 2025:
- Russia-Ukraine conflictcontinued to ferment, boosting market risk aversion
- Middle East situationwas turbulent, increasing supply concerns
- Global trade frictionsescalated, adding tariff uncertainty
JPMorgan analysis pointed out [1] that geopolitical tensions are the primary factor driving gold to a historic high. A Russian poll shows that most people expect the conflict to end in 2026, but risk aversion demand will remain strong until then [2].
The global central bank gold-buying spree is a
- Q3 Gold Purchases: ~220 tons: Central bank buying accelerated again in Q3’25 [3]
- 2025 Full-Year Gold Purchases: 1,200 tons: Hit a record high [3]
- Led by Emerging Market Central Banks: China, India and other countries continued to increase gold reserves
World Gold Council data shows that global gold demand reached 1,313 tons in Q3 2025, the strongest quarterly record in history, mainly driven by strong central bank purchases [3]. JPMorgan predicts that central bank quarterly gold demand will remain around 190 tons in 2026 [1].
Expectations of a Fed monetary policy shift are strong:
- Interest rate cut expectations: The market expects the Fed to continue cutting interest rates
- Weakening Dollar Index: Reduces gold holding costs
- Negative real interest rates: Enhances gold’s attractiveness
UBS Wealth Management pointed out that against the background of the Fed’s loose monetary policy, the credibility of the dollar and U.S. bonds is weakening, which provides long-term support for gold [4].
Gold ETF holdings continued to grow:
- GLD+IAU+GLDM Holdings Increased by 26.8%: Reached a peak of 4.9 billion shares [4]
- Holding Market Value: $173.9 Billion: Hit a record high [4]
- Investors Still Underweight Gold: UBS believes investors are “underweight” gold [4]
- Inflation expectations heating up: The market is worried about inflation rebound
- Ultimate Safe-Haven Asset: Plays a key role in economic and financial uncertainty
- Debt Concerns: Global debt levels continue to climb
| ETF | Code | YTD Return | Features |
|---|---|---|---|
| SPDR Gold Shares | GLD |
63.63% | World’s largest gold ETF with best liquidity |
| iShares Gold Trust | IAU |
~62% | Lower fee, suitable for long-term holding |
| abrdn Physical Gold | GLTR |
71.45% | Physical precious metal ETF, including multiple precious metals |
- Conservative Investors: AllocateGLD or IAUto enjoy gold price gains with lower volatility
- Aggressive Investors: ConsiderGLTR, which includes silver and other precious metals with higher volatility but potential for higher returns
- Allocation Ratio Recommendation:5-10%of the portfolio allocated to gold ETFs [4]
UBS recommends “buying gold on dips”, believing that gold is still an effective portfolio hedge tool at current prices [4].
- Gold ETF (GLD): +63.63%
- Gold Mining ETF (GDX): +146.15%
- Junior Gold Miners ETF (GDXJ): +157.26%
- Newmont (NEM): +162.47%
Gold mining stocks outperformed gold ETFs significantly, mainly due to:
- Operating Leverage Effect: Gold price increases directly boost gold mining companies’ profit margins
- Capacity Expansion: For example, Newmont’s Ahafo North project was put into operation, expected to produce 275,000-325,000 ounces annually [5]
- Cost Control: Companies reduced production costs through automation and technology application
- Debt Optimization: Newmont successfully reduced debt by $2 billion, improving cash flow [5]
| Company | Code | Market Cap | 2025 Expected Growth | Investment Highlights |
|---|---|---|---|---|
Newmont |
NEM | $41 Billion | 74.1% | Strong execution, Ahafo project commissioning, net debt near zero |
Barrick Gold |
GOLD | $37 Billion | 14% | ESG leadership, advanced technology |
Agnico Eagle |
AEM | $25 Billion | 12% | Operational excellence, high ESG compliance |
- Core Holdings: Allocate to large gold mining stocks likeNEM, GOLDfor stability
- Satellite Positions: Allocate toGDXJto capture potential excess returns from high-growth junior gold mining stocks
- Allocation Ratio: In gold investments,30% allocated to gold mining stocks,40% allocated to gold ETFs(see Quadrant 4 in the chart below)
- Fed Hawkish Shift: If inflation rebounds beyond expectations, rising rate hike expectations will weigh on gold prices
- Slowdown in Central Bank Gold Purchases: Some central banks may reduce purchases due to high gold prices
- Technical Correction: Gold prices may experience震荡整理 after breaking $4400
- Economic Recession Concerns: A deep recession may affect physical gold demand
- Gold ETFs (GLD/IAU): 40% - Core allocation for steady returns
- Large Gold Mining Stocks (GOLD/NEM): 30% - Capture operating leverage gains
- Small and Medium Gold Mining Stocks (GDXJ): 15% - Pursue high growth
- Gold Mining Company Bonds: 10% - Enhance fixed income returns
- Cash and Equivalents: 5% - Maintain liquidity for buying on dips
| Institution | Forecast Target Price | Time Node | Core Views |
|---|---|---|---|
JPMorgan |
$5,055 | End of 2026 | Tariff uncertainty + central bank gold purchases + Chinese demand [1] |
UBS |
$4,500 | Mid-2026 | Fiscal deterioration + strong ETF demand [4] |
ING |
$4,000-4,500 | 2026 | Structural bull market continues [3] |
State Street Global Advisors |
$5,000 | Scenario Analysis | May reach if geopolitical risks escalate [3] |
- Central bank quarterly gold demand remains around 190 tons[1]
- Quarterly average ETF and investor demand reaches 585 tons[1]
- Fed continues to cut interest rates, dollar remains weak
- Geopolitical risks do not ease significantly
- Mainly allocate to gold ETFs like GLD, IAU
- Target Allocation Ratio: 5-8%of the portfolio
- Adopt Dollar-Cost Averaging Strategyto分散时点风险
- 40% Gold ETFs + 45% Gold Mining Stocks (including GDXJ) + 15% Cash
- Focus on pullback opportunities for high-quality gold mining stocks like NEM, GOLD
- Use GDXJto capture growth dividends from junior gold mining stocks
- Establish gold strategic allocationas an asset diversification tool
- Focus on gold futures and optionsfor hedging functions
- Timely allocate to gold mining company bondsto enhance fixed income portfolios
[0] Gilin API Data - 2025 Trading Data for Gold-Related Securities like GLD, GDX, GDXJ, NEM
[1] JPMorgan Commodities Research - 《Gold price predictions from J.P. Morgan Global Research》 (https://www.jpmorgan.com/insights/global-research/commodities/gold-prices)
[2] Sina Finance - 《Geopolitical Tensions Impact: Gold’s Annual Gain Exceeds 70%》 (https://finance.sina.com.cn/money/nmetal/hjfx/2025-12-25/doc-inhcyrum5073980.shtml)
[3] ING Think - 《Gold’s bull run to continue in 2026》 (https://think.ing.com/articles/golds-bull-run-to-continue-in-2026/)
[4] UBS Wealth Management - 《UBS Raises Gold Target Price Again: Will Rise to $5400 Amid Political or Economic Turmoil》 (https://xnews.jin10.com/details/205139)
[5] Nasdaq/Zacks - 《5 Gold Mining Stocks to Buy to Ride the Solid Industry Trends》 (https://www.nasdaq.com/articles/5-gold-mining-stocks-buy-ride-solid-industry-trends)
[6] State Street Global Advisors - 《Gold 2026 Outlook: Can the structural bull cycle continue to $5,000?》 (https://www.ssga.com/us/en/intermediary/insights/gold-2026-outlook-can-the-structural-bull-cycle-continue-to-5000)
[7] Phoenix New Media Finance - 《Gold Rally Unfinished: JPMorgan Bullish: May Reach $5055 by End of Next Year》 (https://i.ifeng.com/c/8pJQu84WEIG)
Insights are generated using AI models and historical data for informational purposes only. They do not constitute investment advice or recommendations. Past performance is not indicative of future results.
About us: Ginlix AI is the AI Investment Copilot powered by real data, bridging advanced AI with professional financial databases to provide verifiable, truth-based answers. Please use the chat box below to ask any financial question.