Vicor Corp (VICR) Insider Stock Sale Analysis Report
Unlock More Features
Login to access AI-powered analysis, deep research reports and more advanced features

About us: Ginlix AI is the AI Investment Copilot powered by real data, bridging advanced AI with professional financial databases to provide verifiable, truth-based answers. Please use the chat box below to ask any financial question.
Related Stocks
Based on the latest market data and analysis, I provide you with a comprehensive interpretation of the large-scale stock sale by Vicor Corp’s Chairman and CEO Patrizio Vinciarelli.
According to SEC Form 4 disclosure documents, CEO Patrizio Vinciarelli conducted multiple stock sales in December 2025 [1]:
| Date | Number of Shares Sold | Average Price | Transaction Value |
|---|---|---|---|
| Dec 19 | 20,000 shares | $103.02 | $2,060,400 |
| Dec 22 | 20,000 shares | $105.28 | $2,105,600 |
| Dec 24 | 12,400 shares | $108.87 | $1,349,988 |
| Dec 26 | 20,000 shares | $110.12 | $2,202,400 |
Total |
72,400 shares |
- | $7,718,388 |
- After the sale, Vinciarelli still holds approximately 9.736 million shares, worth about$1.12 billion.<br>
- This sale accounts for only 0.74%of his holdings.<br>
- All sales are planned salesexecuted through the 10b5-1 trading plan [2].
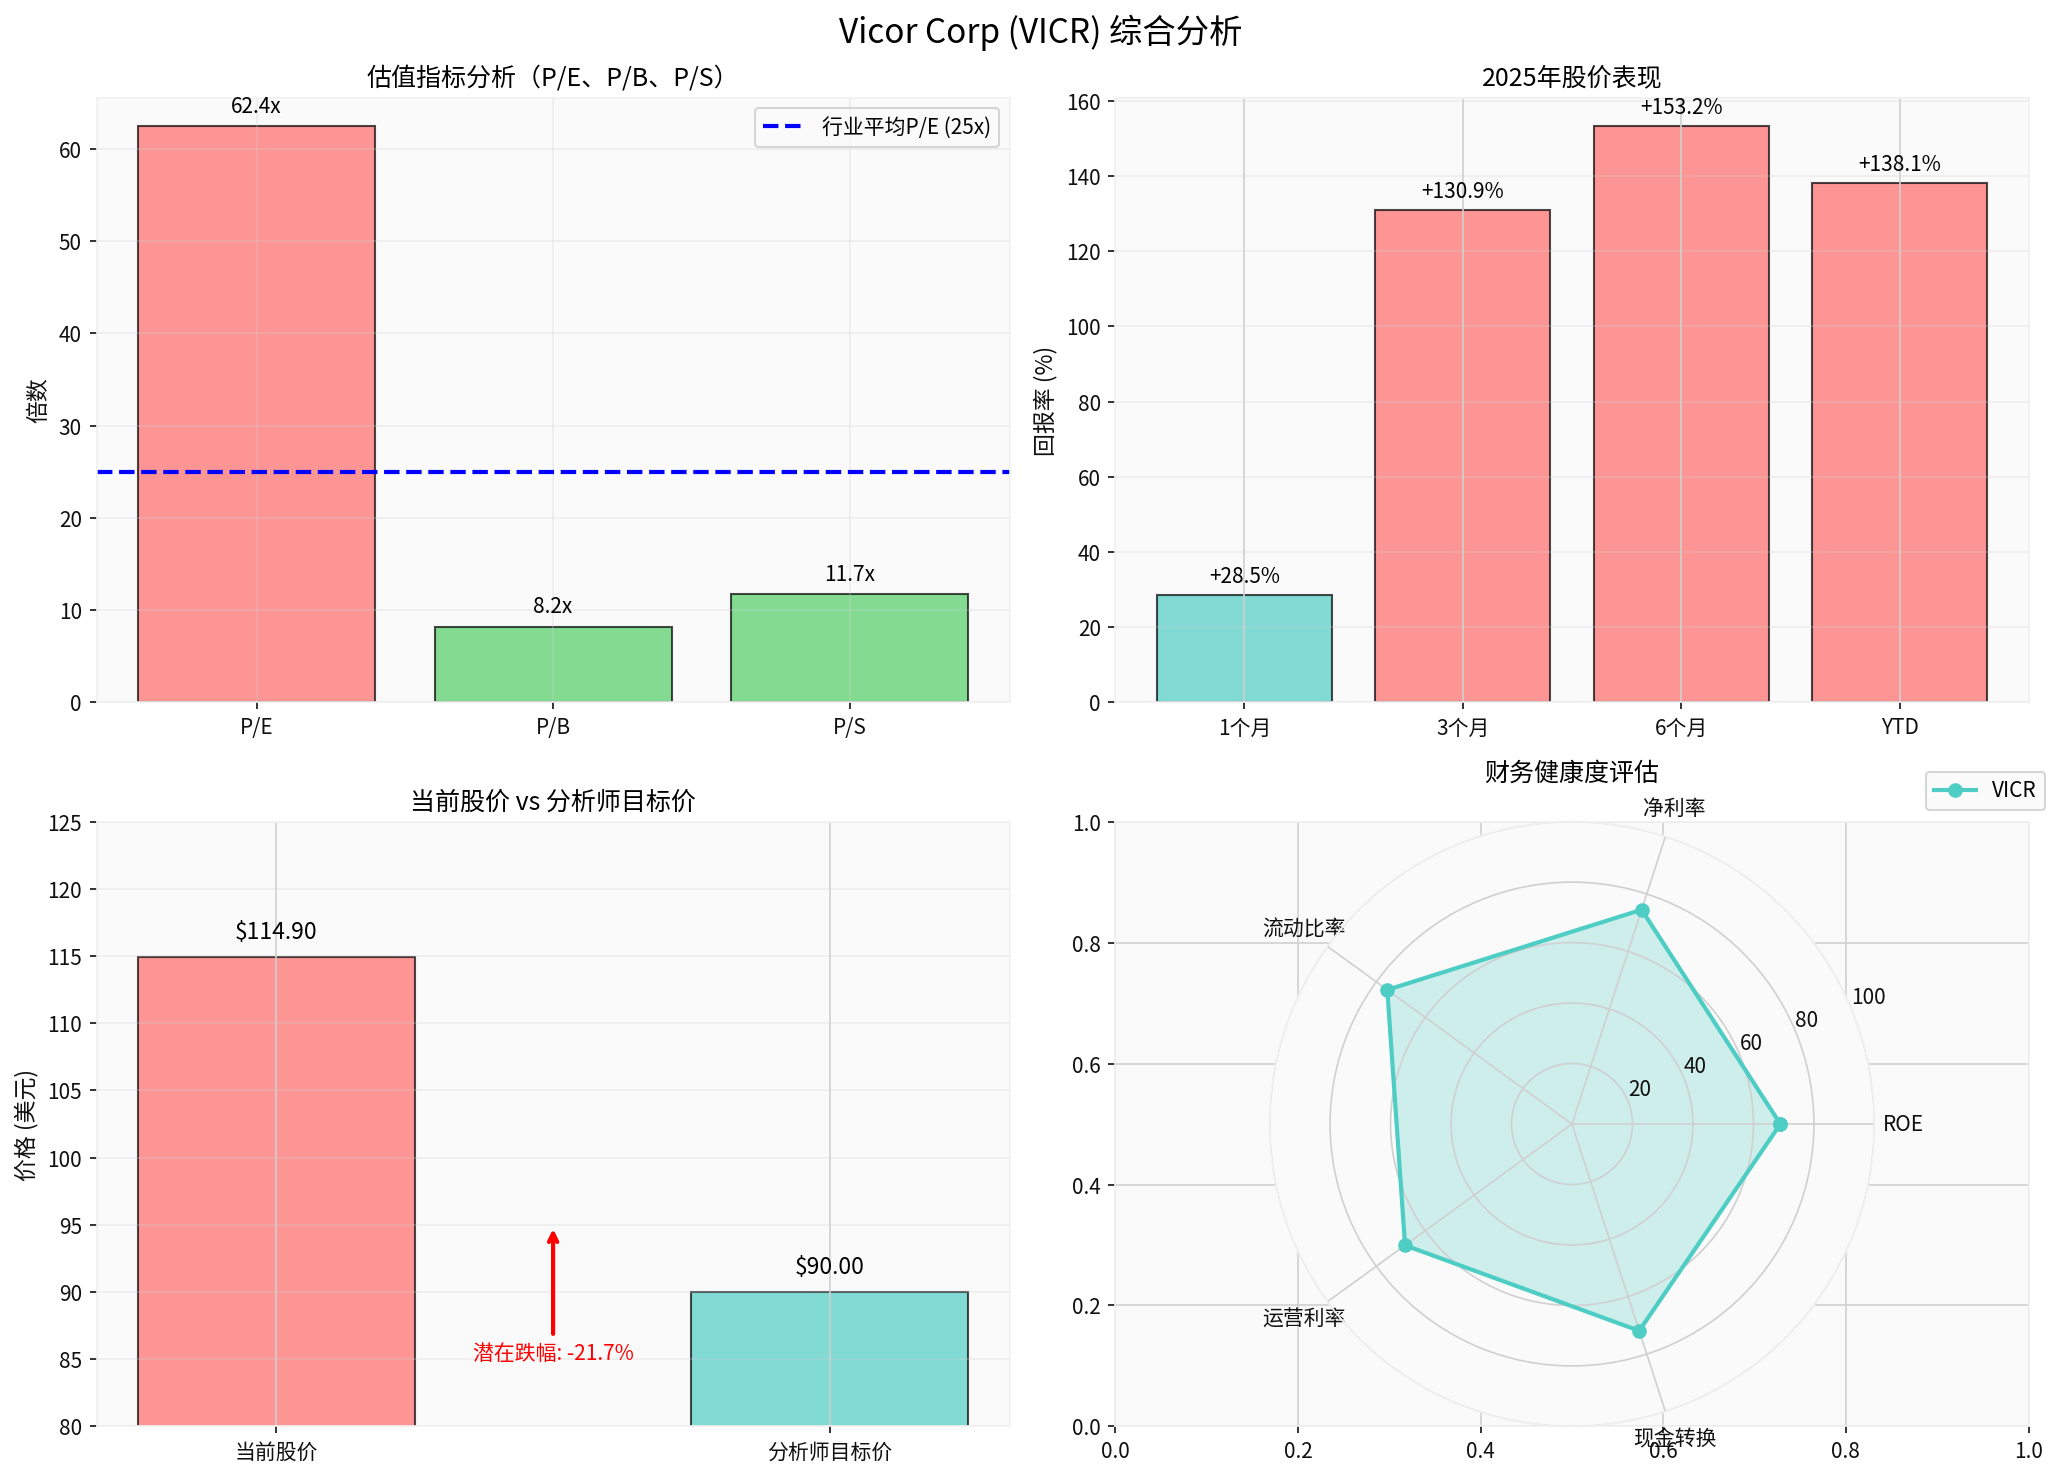
| Time Period | Change |
|---|---|
| 1 Month | +28.52% |
| 3 Months | +130.95% |
| 6 Months | +153.15% |
| Year-to-Date (YTD) | +138.14% |
| 1 Year | +133.87% |
| Metric | VICR Value | Industry Average | Evaluation |
|---|---|---|---|
| P/E Ratio | 62.43x | ~25x | Significantly above industry |
| P/B Ratio | 8.15x | - | High |
| P/S Ratio | 11.71x | - | High |
- Median Target Price: $90.00
- Potential Downside: -21.6%
- Rating Distribution: 66.7% Buy, 33.3% Hold
- Latest Rating: Needham upgraded from Hold to Buy on October 22
###3. Technical Analysis Signals [0]
Based on technical analysis as of December 30, 2025:
| Indicator | Status | Signal |
|---|---|---|
| Trend | Uptrend (to confirm) | Breakout day |
| MACD | - | Bullish |
| KDJ | K:93.2, D:86.5 | Overbought Warning |
| RSI | - | Overbought Risk |
| Beta | 1.95 | High Volatility |
- Support: $105.95<br>
- Resistance: $114.76<br>
- Next Target: $119.70
###4. Financial Health Status [0]
- ROE (Return on Equity):13.78%
- Net Profit Margin:18.63%
- Operating Margin:17.06%
- Current Ratio:7.55 (Very Healthy)
- Quick Ratio:6.25
- Debt Risk: Low Risk
- Financial Stance: Conservative Accounting Policies
- Advanced Products Division:55.0% of Revenue ($197.33M)
- Brick Products Division:45.0% of Revenue ($161.73M)
- Geographic Distribution: US 51.8%, Asia-Pacific36.2%, Europe11.6%
###5. In-depth Interpretation of Insider Sale
####1.
- Vinciarelli still holds over $1.1 billion in VICR stock, selling less than 1% of his holdings.<br>
- For a CEO with highly concentrated holdings, moderate diversification is a rational financial plan.<br>
- Such sales are usually executed through pre-set10b5-1 plans, indicating planned decisions rather than those based on insider information.
- The stock price has risen over138% cumulatively in2025, potentially facing high capital gains taxes.<br>
- Selling before the end of the year may be to manage tax liabilities for the 2025 tax year.
- P/E ratio of 62.43x is significantly higher than the industry average.<br>
- Current price is 21.6% higher than analysts’ target price.<br>
- Technical indicators show overbought status (KDJ and RSI both issue warnings).
####2.
- Financial analysis shows the company’s financial condition is healthy with low debt risk [0].<br>
- Q3 2025 financial report shows strong year-over-year revenue growth (from $96.05M to $110.42M) [0].<br>
- Analysts just upgraded the rating to Buy on October22 [0].<br>
- This sale accounts for only0.74% of the CEO’s holdings.<br>
- It is a small-scale, gradual sale rather than a liquidation-style dump.
###6. Implications for Investors
-
Overvaluation Risk:<br>
- P/E ratio of62.43x is far above industry average; if growth is less than expected, valuation correction pressure will be huge.<br>
- Technical indicators show overbought status; short-term profit-taking pressure may arise.
-
Negative Signal from Insider Selling:<br>
- Even a small-scale sale at an all-time high reflects management’s view that current valuation is sufficient or high.
-
Volatility Risk:<br>
- Beta of 1.95 means stock price volatility is almost twice that of the market.<br>
- High-valued stocks are more sensitive to negative news.
-
Strong Fundamentals:<br>
- Net profit margin of18.63%, ROE of13.78%: strong profitability.<br>
- Current ratio of7.55: very sound financial condition.<br>
- Technological leadership in high-power power converter field.
-
Growth Potential:<br>
- Products applied in high-growth fields like high-performance computing, aerospace, defense.<br>
- AI and data center demand growth may bring long-term benefits.
-
Institutional Recognition:<br>
- 66.7% of analysts give Buy rating.<br>
- Institutions like Needham upgraded ratings recently.
###7. Investment Recommendations
Based on the above analysis, insider stock sales
- Technical indicators show overbought status; short-term correction risk is high.<br>
- Overvaluation: lack of safety margin.<br>
- Support level at $105.95; breaking below may lead to further decline.
- Company fundamentals are healthy; long-term growth logic remains unchanged.<br>
- Wait for stock price to pull back to reasonable valuation range (P/E 40-45x) before considering adding positions.<br>
- Pay attention to Q1 2026 financial report (expected to be released on February19) to verify growth sustainability.
- Current price has 21.6% downside space from analysts’ target price.<br>
- Consider establishing short positions in the $115-118 range with stop-loss at $120.<br>
- Target price: $90 (analysts’ target price).
###8. Risk Warnings
- Valuation Pullback Risk: If future quarterly earnings are less than expected, high valuation cannot be sustained.
- Industry Competition Risk: Increased competition in power converter market may compress profit margins.
- Macroeconomic Risk: Macroeconomic downturn may affect capital expenditure and downstream demand.
- Liquidity Risk: Average daily trading volume of338,000 shares; large-scale transactions may cause slippage.
###9. Key Monitoring Indicators
Investors are advised to focus on the following indicators:
| Indicator | Importance | Explanation |
|---|---|---|
| Q1 2026 Financial Report | ★★★ | Verify growth sustainability; expected release date: February19 |
| Stock Price Support $105.95 | ★★★ | Technical support; breaking below may reverse trend |
| Further Insider Transactions | ★★ | Watch for additional sales by executives or directors |
| Industry Competition Dynamics | ★★ | Monitor competitors’ moves and market share changes |
[0] Jinling API Data - Real-time stock quotes, company profiles, financial analysis, technical analysis, historical price data
[1] MarketBeat - “Vicor (NASDAQ:VICR) CEO Patrizio Vinciarelli Sells 20,000 Shares” (December29,2025)
https://www.marketbeat.com/instant-alerts/vicor-nasdaqvicr-ceo-patrizio-vinciarelli-sells-20000-shares-2025-12-29/
[2] InsiderScreener - US Stock Insider Transaction Database, Vicor Corp (VICR) Insider Transaction Records
https://www.insiderscreener.com/en/explore/us
[3] Investing.com - “Vicor (VICR) chairman Vinciarelli sells $2.06 million in stock” (December22,2025)
https://www.investing.com/news/insider-trading-news/vicor-vicr-chairman-vinciarelli-sells-206-million-in-stock-93CH-4420002
Insights are generated using AI models and historical data for informational purposes only. They do not constitute investment advice or recommendations. Past performance is not indicative of future results.
About us: Ginlix AI is the AI Investment Copilot powered by real data, bridging advanced AI with professional financial databases to provide verifiable, truth-based answers. Please use the chat box below to ask any financial question.