In-depth Analysis of Investment Value in the Container Shipping Industry in 2026: The Game Between Supply-side Surplus and Effective Capacity Gap
Unlock More Features
Login to access AI-powered analysis, deep research reports and more advanced features

About us: Ginlix AI is the AI Investment Copilot powered by real data, bridging advanced AI with professional financial databases to provide verifiable, truth-based answers. Please use the chat box below to ask any financial question.
Related Stocks
The container shipping industry will face
- Mid-term (H2 2026-2027): Effective capacity release after geopolitical easing + tighter environmental regulations =accelerated industry differentiation
- Long-term: Green transition costs + ship large-scale trend =increased head concentration
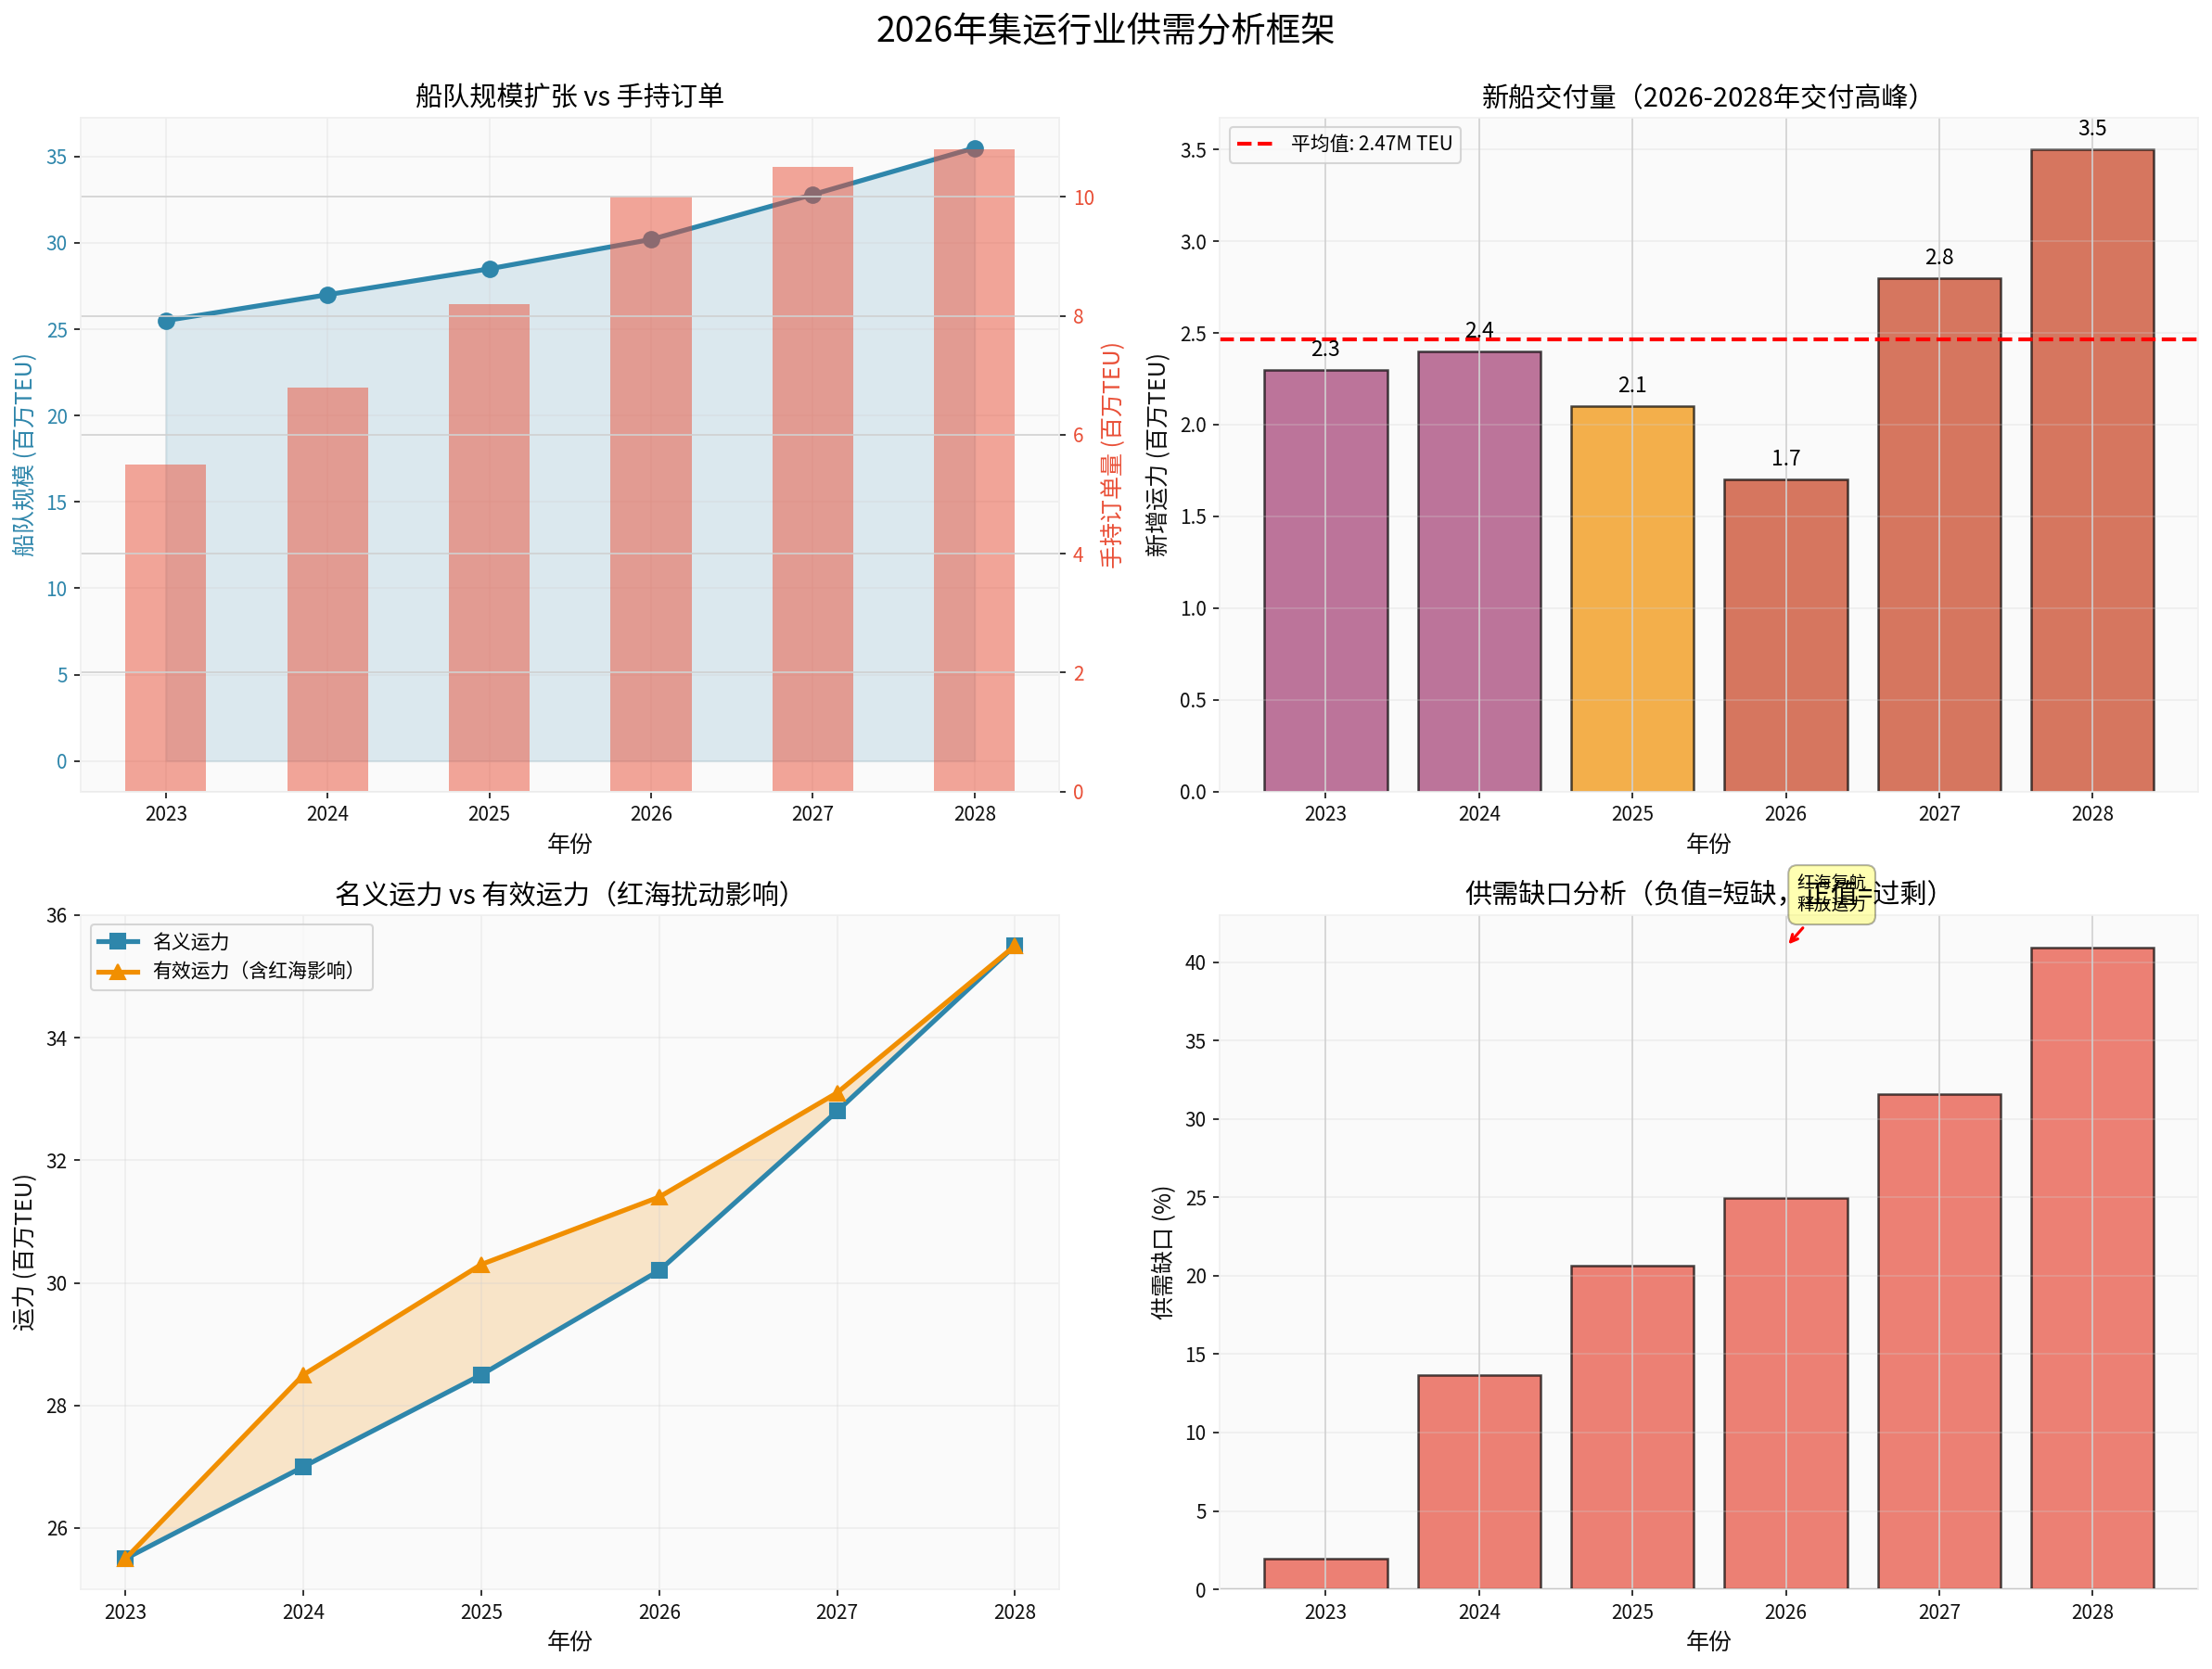
According to Clarksons Securities data, global container ship handheld orders have exceeded
- 2025: 2.1 million TEU (already entered the market)
- 2026: 1.7 million TEU (delivery pressure slightly eased)
- 2027: 2.8 million TEU (new round of delivery peak)
- 2028: 3.5 million TEU (historical peak)
Notably, the cumulative delivery from 2025 to 2028 will exceed
The impact of the Red Sea crisis on capacity is becoming the industry’s biggest variable:
-
Capacity consumption from detouring the Cape of Good Hope:
- Equivalent to 1.5-2 million TEUof global capacity being “locked” (accounting for 6-7% of global capacity) [3]
- Voyage increased by about 3,000 nautical miles, sailing time extended by 10-14 days
- Extra fuel cost per voyage increased by $200k-$300k[4]
- Equivalent to
-
Time window for Red Sea resumption:
- CMA CGM has announced the resumption of Red Sea routes on January 15, 2026, becoming the first carrier to resume the east-west main route [4]
- Voyage can be shortened by about 14 days, cycle time compressed to 77 days
- The industry expects the Red Sea passage may fully recover in mid-2026, releasing8-10%of effective capacity [3]
- CMA CGM has announced the resumption of Red Sea routes on
-
Chain reaction mechanism:
- Once leading carriers resume routes first, other companies will probably have to follow, otherwise they will lose competitiveness in timeliness and cost
- Port congestion and empty container flow disorders may occur in the initial stage of resumption as “secondary impacts”
- In the long run, capacity release will significantly impact freight rates [4]
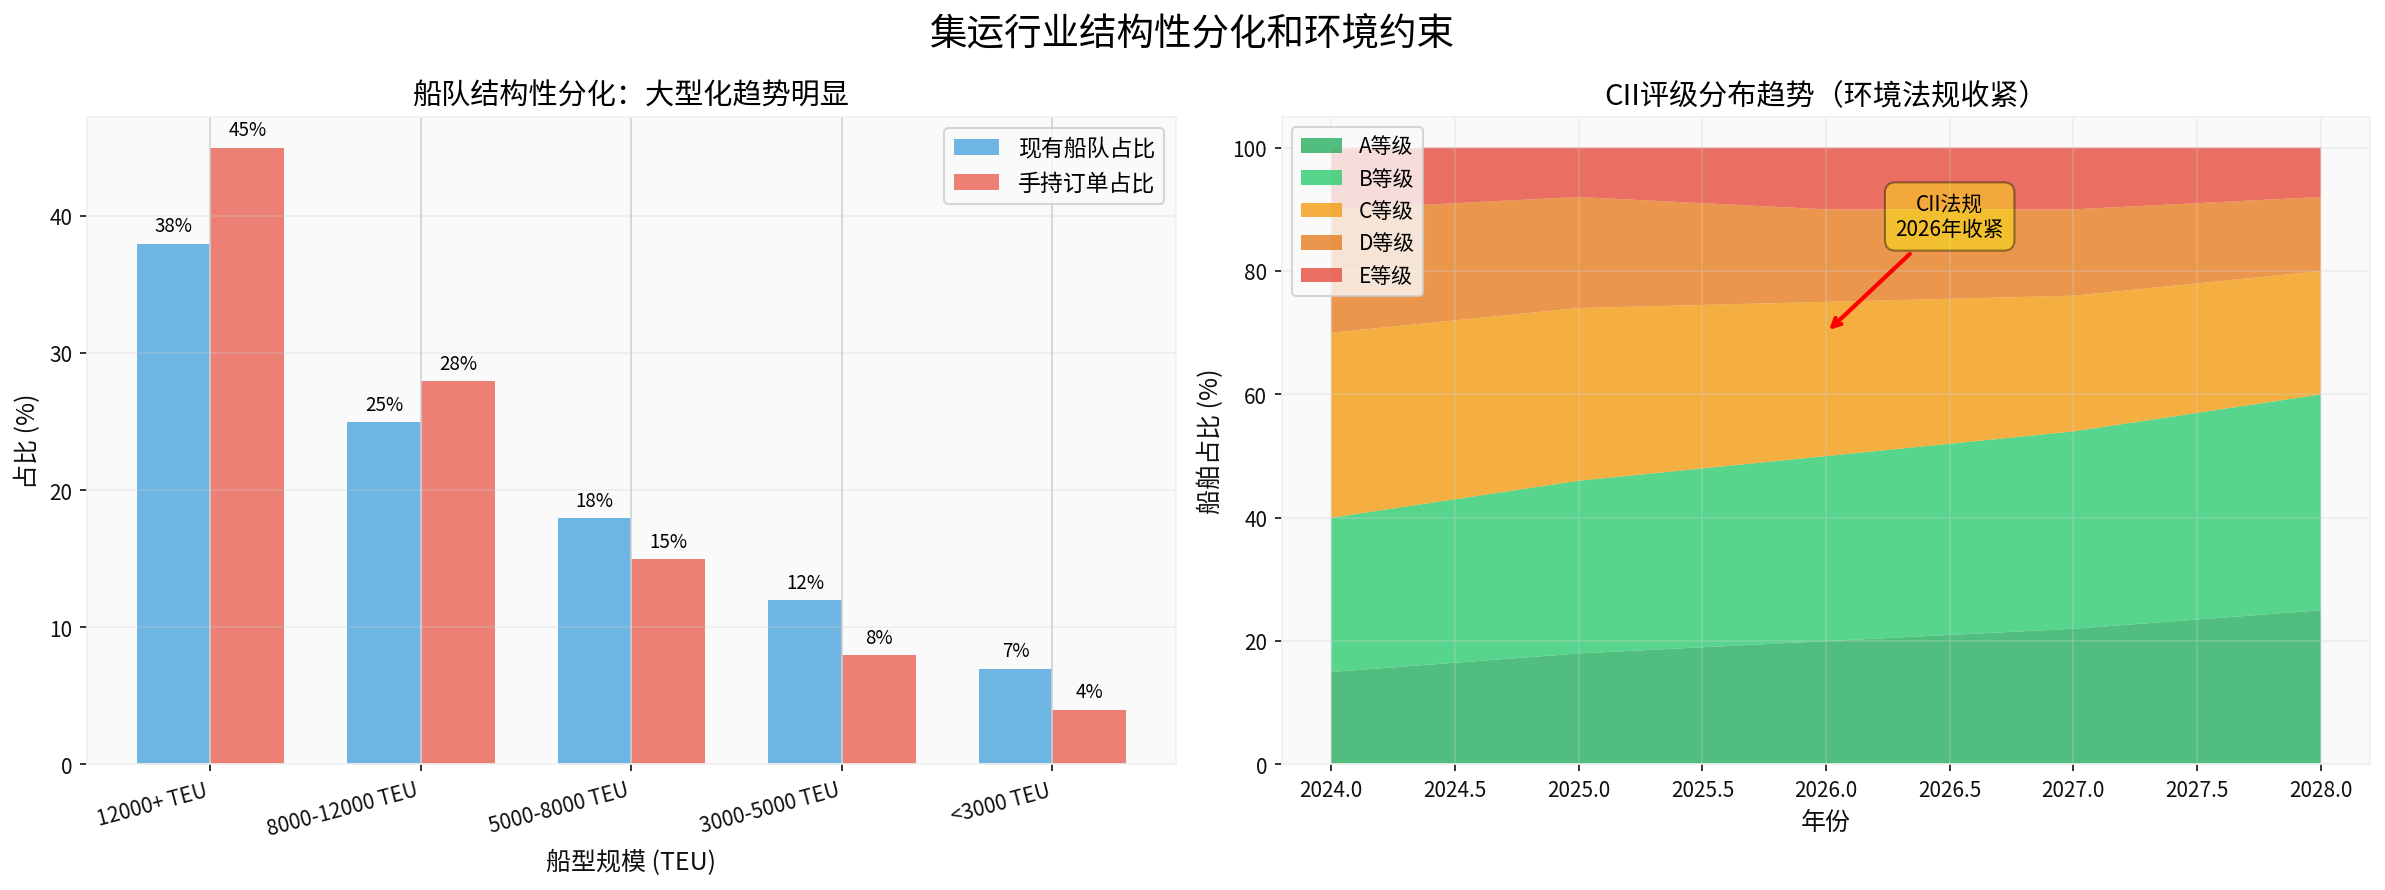
CII and EEXI regulations will further tighten from 2026, becoming an “invisible constraint” on the supply side [5][6]:
-
CII regulation tightening:
- CII rating requires about 2% improvement annually from 2026 to 2028
- It will further tighten from 2027 to 2030 (Z factor up to 21.5%)
- Ships with D/E ratings will face mandatory speed reduction, route change or even elimination
-
Impact on operational efficiency:
- Carriers may actively reduce speed to meet standards, offsetting 10-15% of effective capacity
- Green fuel ships account for over 70%, but operational costs rise significantly
- EU ETS coverage expands to 100%, fully implemented in 2026
- Carriers may actively reduce speed to meet standards,
-
Environmental protection investment burden:
- New ships generally adopt dual-fuel or methanol power, increasing shipbuilding costs by 30-40%
- Modifying existing ships with EEXI compliance equipment costs about $1-3 million per ship
According to BIMCO forecasts, container transport demand is expected to grow by
| Region | 2026 Demand Forecast | Key Drivers |
|---|---|---|
| North America | 1.5-2.5% growth | Tariff policy disturbance, destocking cycle |
| Europe | 2.0-3.0% growth | Weak economic recovery, energy transition |
| Asia | 3.5-4.5% growth | Export-oriented economy, regional trade agreements |
| Emerging Markets | 4.0-5.0% growth | Manufacturing transfer, consumption upgrade |
Need to be alert that the “rush shipment” at the end of 2025 may透支 (overdraw) early 2026 demand:
- U.S. tariff policy led to early shipment by shippers, with Q4 2025 cargo volume growing by 4.7%(vs expected 3%)
- National Retail Federation predicts U.S. import cargo volume will decline in Q1 2026
- Nominal capacity: +3.0% (new ship delivery)
- Effective capacity: +0.5% (new ship - Red Sea detour consumption - environmental regulation constraints)
- Demand growth: +3.0%
- Result: Basic balance, freight rates maintain moderate growth
- Recommended: ZIM (high elasticity), Matson (regional market)
- Shipping companies enjoy sustained high freight rate dividends
- Fuel cost pressure is borne by shippers
- Q1-Q2: Capacity tight (Spring Festival + Red Sea detour)
- Q3-Q4: Concentrated capacity release (resumption + new ship delivery)
- Annual effective capacity: +4.5% (nominal +3.0% + resumption release +1.5%)
- Demand growth: +3.0%
- Result: H1 supply-demand tight, H2明显过剩
- Strategy: Long H1, Short H2
- Focus: Freight rate futures (SCFI/CCFI), Forward Freight Agreements (FFA)
- Spot market freight rates under pressure, contract freight rates relatively stable
- Effective capacity: +6.0% (resumption release 2.0% + new ship3.0% + environmental constraints1.0%)
- Demand growth: +3.0%
- Result: Severe surplus, freight rates plummet
- Risk: Rising bankruptcy risk for small and medium carriers
- Opportunity: Merger integration, capacity scrapping, second-hand ship price plummet
- Leading carriers may accelerate market clearing through scale advantages
###5.1 Ship Large-scale Matthew Effect
- 12000+TEUships: Existing fleet accounts for38%, handheld orders account for45%
- 8000-12000TEUships: Existing fleet accounts for25%, handheld orders account for28%
- Below5000TEUships: Handheld orders account for only12%
- Economies of scale: Unit cost of large ships is 25-35% lower than small and medium ships
- Route adaptation: Far East-Europe/US West main routes are suitable for 12000+TEU ships
- Port restrictions: Some ports cannot handle ultra-large ships, forming structural barriers
- MSC: Most handheld orders (about1 million TEU), 12000+TEU ships account for over50%
- CMA CGM: Expected to surpass Maersk to become the world’s second-largest carrier in2026 through order expansion [2]
###5.2 Differentiation Opportunities from Green Transition
According to industry data, green fuel ships (methanol, LNG, ammonia) account for
| Ship Type | CII Compliance Ability | 2026 Operational Cost | 2030 Competitiveness |
|---|---|---|---|
| Traditional Fuel Ship | D/E rating | Benchmark | Low (facing elimination) |
| LNG Dual-fuel Ship | B/C rating | +15-20% | Medium |
| Methanol Power Ship | A/B rating | +20-30% | High |
| Ammonia Fuel Ship (Future) | A/A+ rating | +30-40% | Extremely High |
- Green Ship Premium: Ships with CII rating A/B can charge 5-10% green freight premium
- Carbon Quota Trading: Under EU ETS system, efficient ships can profit from selling carbon quotas
- Financing Cost Advantage: Green ships can obtain lower financing costs (interest rate difference 50-100bp)
###6.1 ZIM (Israel ZIM Integrated Shipping)
- Extremely Low Valuation: P/E only1.27x, P/B0.66x (market pessimistic expectations fully priced)
- Strong Profitability: Net profit margin 23.37%, operating profit margin29.22%, ROE50.68%
- Financial Stability: Current ratio1.20, quick ratio1.11
- High Elasticity Game: ZIM has the largest performance elasticity under the scenario of continued Red Sea crisis
- Regional Market Advantage: Middle East and Mediterranean routes benefit from geopolitical premium
- Risk Tip: Analyst consensus rating is “Sell”, target price $11.70 (down44.8% from current)
###6.2 Matson (Matson Shipping)
- Buy Rating: Analyst target price $136.00 (+8.6%)
- Regional Barrier: Monopoly advantage in Hawaii, Guam and Alaska routes
- Stable Performance: Net profit margin12.70%, operating profit margin14.89%
- Defensive Allocation: Not dependent on main routes, less affected by global capacity surplus
- Logistics Integration: Logistics business accounts for17.9%, smoothing shipping cycle fluctuations
- U.S. Market: Benefits from nearshoring trend
###6.3 CMA CGM (CMA CGM)
According to online search information [2][4]:
- 2026 Outlook: Management publicly stated “2026 will face difficulties”
- Risk Factors: Trade uncertainty, freight rate decline, Red Sea resumption uncertainty
- Freight Rate Performance: Q3 average freight rate $1,452/TEU (higher than Maersk $1,146 and Hapag-Lloyd $1,391)
###7.1 Base Scenario Strategy (Red Sea Gradual Resumption, Probability50%)
- Targets: ZIM (high elasticity), Forward Freight Agreements (FFA)
- Logic: Spring Festival peak + continued Red Sea detour, freight rates maintain high level
- Target Return:20-30%
- Strategy: Short shipping stocks, buy inverse ETFs
- Targets: ZIM (take profit), short Maersk, CMA CGM and other large carriers
- Logic: Concentrated capacity release + Red Sea resumption + demand decline
- Target Return:15-25%
###7.2 Defensive Strategy (Risk Averse Investors)
- Matson: Regional market monopoly, less affected by global capacity surplus
- Logistics Service Providers: Flexport, Expeditors (benefit from supply chain complexity)
- Green Ship Leasing: Invest in ship leasing companies with CII rating A/B
- Port Operators: Benefit from throughput growth, not affected by freight rate fluctuations
###7.3 Aggressive Strategy (Risk Preference Investors)
- Red Sea Resumption Game: Short shipping stocks before resumption news is confirmed, close positions after confirmation
- Merger Integration Opportunity: If the industry has a bankruptcy wave, high-quality assets may be sold at a discount
- Capacity Scrapping: If second-hand ship prices plummet, ship scrapping enterprises may benefit
- Geopolitical Risk: Red Sea crisis lasts longer than expected, or conflict expands to other routes
- Economic Recession Risk: Major global economies fall into recession, trade demand drops sharply
- Environmental Policy Risk: CII/EEXI regulations further tighten, exceeding market expectations
- Industry Competition Risk: Leading carriers launch price wars to seize market share
- Diversified Investment: Do not bet on a single scenario, allocate multiple strategies
- Dynamic Adjustment: Closely track Red Sea situation, new ship delivery progress, freight rate indices
- Strict Stop-loss: Set clear take-profit and stop-loss points (e.g., ±15%)
2026 will experience a
[1] Lloyd’s List - "The rise and fall of container spot rates — and what it means for
Insights are generated using AI models and historical data for informational purposes only. They do not constitute investment advice or recommendations. Past performance is not indicative of future results.
About us: Ginlix AI is the AI Investment Copilot powered by real data, bridging advanced AI with professional financial databases to provide verifiable, truth-based answers. Please use the chat box below to ask any financial question.