Accel Entertainment (ACEL) Insider Stock Sale Comprehensive Analysis
Unlock More Features
Login to access AI-powered analysis, deep research reports and more advanced features

About us: Ginlix AI is the AI Investment Copilot powered by real data, bridging advanced AI with professional financial databases to provide verifiable, truth-based answers. Please use the chat box below to ask any financial question.
Related Stocks
According to SEC filings, Derek Harmer, Chief Compliance Officer (CCO) of Accel Entertainment (ACEL), sold 10,000 common shares on the New York Stock Exchange on December 15, 2025, with a total value of approximately $110,700 (selling price around $11.07 per share)[1].
- Stock Source: These shares were restricted stocks acquired by Harmer in cash on November 20, 2024[1]
- Trading Frequency: This is his second sale of 10,000 shares in the past three months[1]
- Trading Channel: Executed through Merrill Lynch[1]
- Sale Timing: The stock price was in the upper-middle range of its 52-week interval ($9.02-$13.28)[0]
As can be seen from the chart[0], the closing price on the day of Harmer’s sale (December 15) was $11.26, while the closing price as of December 29 was $11.61, representing a 3.11% increase after the sale. This indicates that the market did not react negatively to this insider sale.
- 1-month performance: +13.38%[0]
- 3-month performance: +2.56%[0]
- Year-to-date: +9.84%[0]
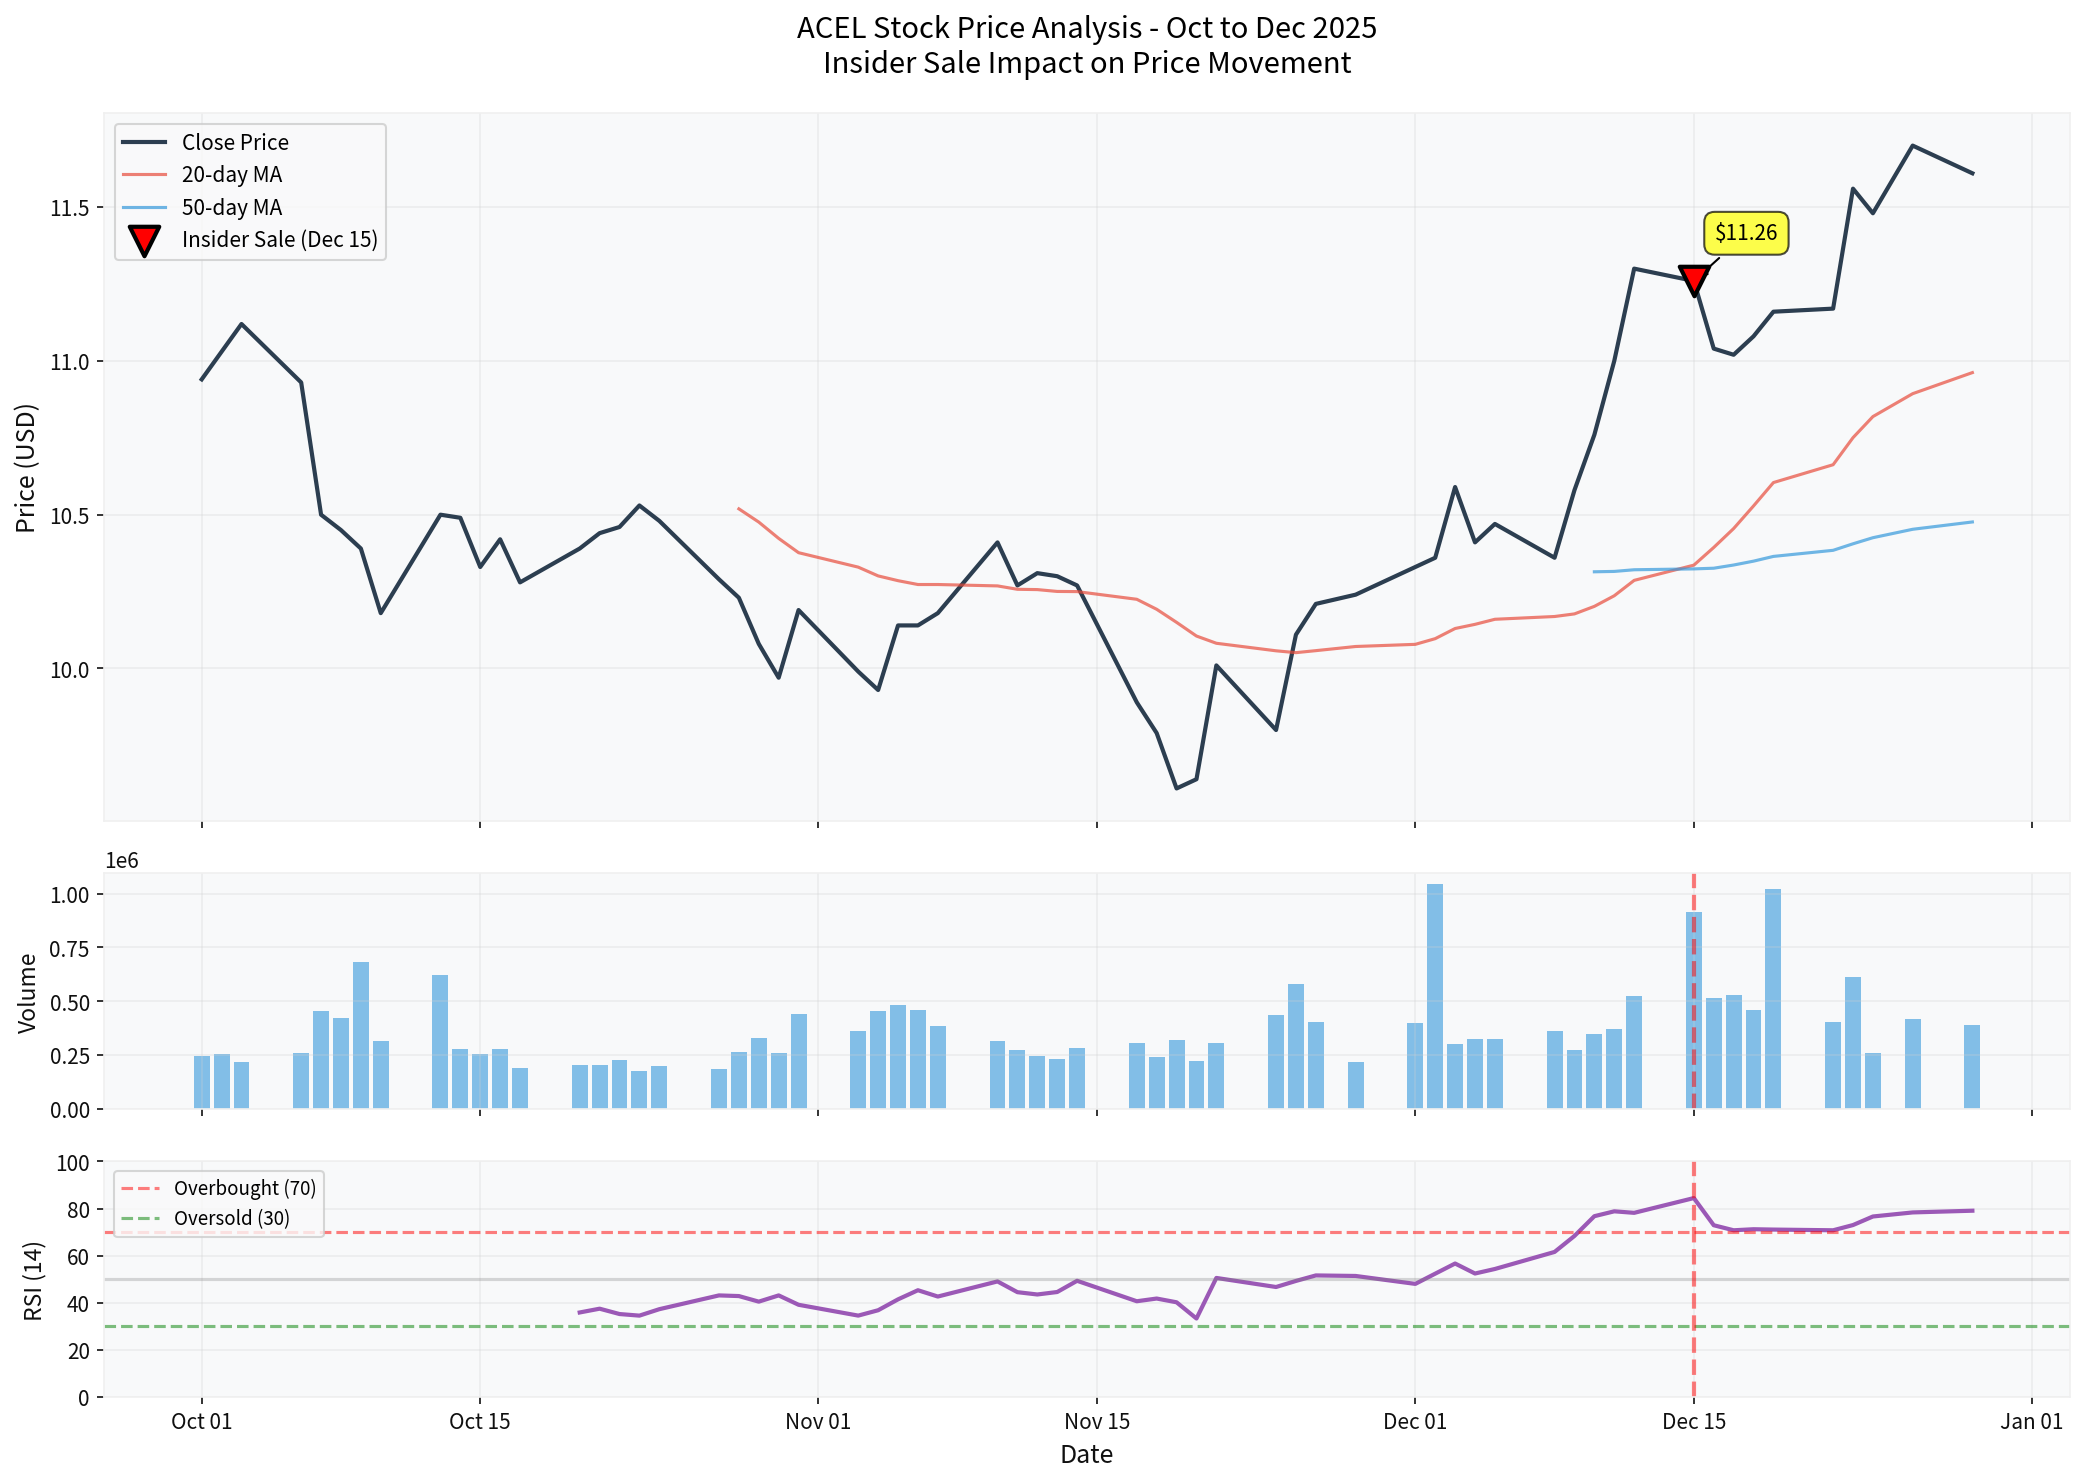
The chart shows ACEL’s price trend, trading volume, and RSI indicator from October to December 2025, with the red inverted triangle marking the specific date (December 15) when CCO Harmer sold shares
According to technical analysis data from the brokerage API[0]:
| Technical Indicator | Value | Signal |
|---|---|---|
Trend |
Sideways Consolidation | No Clear Direction |
Support Level |
$10.96 | - |
Resistance Level |
$11.74 | Current price is close to resistance level |
Beta |
1.08 | Slightly higher than market volatility |
KDJ |
K:88.0, D:84.7 | Overbought Warning |
- The stock price is currently in a sideways consolidation state, trading between $10.96 and $11.74
- The KDJ indicator shows an overbought state, indicating potential pullback pressure in the short term
- The current price of $11.61 is already close to the resistance level of $11.74, leaving limited upside space
| Indicator | Value | Assessment |
|---|---|---|
Return on Equity (ROE) |
16.77% | Excellent |
Net Profit Margin |
3.34% | Moderate |
Operating Profit Margin |
7.57% | Good |
Current Ratio |
2.57 | Healthy |
Quick Ratio |
2.50 | Healthy |
Market Capitalization |
$986 million | Small-cap Stock |
- Price-to-Earnings Ratio (P/E):22.52x - Slightly higher than industry median
- Price-to-Book Ratio (P/B):3.68x
- Price-to-Sales Ratio (P/S):0.75x - Relatively Reasonable
- The company’s financial risk rating is “Medium Risk”[0]
- Both current ratio and quick ratio exceed 2.5, indicating very healthy liquidity
- ROE reaches 16.77%, showing high capital utilization efficiency
According to the latest data[0]:
- Buy:3 analysts (75%)
- Hold:1 analyst (25%)
- Consensus Target Price:$13.00
- Upside Potential: +12.0% compared to current price of $11.61
- November5,2025: Macquarie maintained “Outperform” rating[0]
- May6,2025: Macquarie maintained “Outperform” rating[0]
- May9,2024: Deutsche Bank maintained “Buy” rating[0]
- The shares sold by Harmer were restricted stocks acquired a year ago; selling part of them to lock in gains is a rational financial management behavior
- 10,000 shares account for only a tiny proportion (about 0.012%) of the company’s total shares outstanding (83,207,946 shares)[1]
- Insiders may sell shares for personal financial planning (e.g., home purchase, education expenses, tax planning)
- Such sales do not necessarily reflect a pessimistic view of the company’s prospects
✅
- Insiders buy shares, especially large purchases
- Multiple insiders buy simultaneously
- Buy when stock price is low
⚠️
- Insiders sell shares (like this case)
- Core executives like CEO/CFO sell heavily
- Sell when stock price is high
❌
- Multiple executives sell heavily simultaneously
- Insiders sell heavily before earnings release
- Company announces negative news after insiders sell heavily
###3. Comprehensive Assessment of This ACEL Insider Sale
- Extremely small sale proportion: Only 0.012% of total shares
- Position nature: CCO (Chief Compliance Officer) rather than CEO or CFO, with relatively lower understanding of daily operations
- Sale timing: Stock price is in upper-middle range of 52-week interval, rational profit-taking
- Market reaction: Stock price did not fall after sale; instead, it rose by3.11%
- Analyst attitude: Analysts still maintain Buy ratings
- Technical indicators show overbought state; short-term pullback pressure possible
- KDJ indicator is overbought; need to be alert to technical adjustments
- Current price is close to resistance level of $11.74
##7. Investment Recommendations and Strategies
- Reason: Solid fundamentals; analyst target price of $13.00 still offers12% upside potential
- Risk Control: It is recommended to set a stop-loss at$10.50(near the 20-day moving average of $10.96)
- Ideal Buy Range: $10.50-$11.00 (near the 20-day moving average support level)
- Strategy: Current price of $11.61 is close to resistance level of $11.74; chasing higher is not recommended
- Dollar-Cost Averaging: If bullish on long-term prospects, consider buying in batches during pullbacks
⚠️
- 2025 Q4 Earnings Report(expected to be released in February2026): Watch revenue growth rate and profitability[0]
- Other insider trades: If more executives sell, need to be more alert
- Technical indicators: If RSI remains overbought and KDJ forms a death cross, significant pullback pressure may occur
##8. Best Practices for Using Insider Trading as Investment Decision Reference
###1. Establish an Insider Trading Monitoring System
Investors should:
- Regularly check SEC Form4 (Insider Trading Report)
- Follow the investor relations section on the company’s website
- Use professional insider trading tracking tools
###2. Combine with Other Analysis Dimensions
Insider trading should not be the only basis for investment decisions; it should be combined with:
- Fundamental analysis: Financial statements, valuation levels
- Technical analysis: Price trends, technical indicators
- Industry analysis: Industry prosperity, competitive landscape
- Macroeconomics: Interest rate environment, policy changes
###3. Distinguish Between Different Types of Insiders
| Insider Type | Attention Level | Reason |
|---|---|---|
CEO/CFO |
⭐⭐⭐⭐⭐ | Most knowledgeable about company operations and prospects |
Chairman/Director |
⭐⭐⭐⭐ | Knowledgeable about strategic direction |
Other Executives |
⭐⭐⭐ | Knowledgeable about their respective areas |
Major Shareholders |
⭐⭐⭐ | May know about company situation |
###4. Focus on Trading Patterns
A single transaction has limited reference value, but consistent trading patterns are more meaningful:
- Continuous reduction: May indicate insiders think the stock is overvalued
- Continuous increase: Strong bullish signal
- Regular sales(e.g.,10b5-1 plan): Low reference value
Currently, ACEL has solid fundamentals, and the analyst target price of $13.00 provides a12% upside potential, but technical indicators show short-term overbought.
Insider trading is one of the important reference signals for investment decisions, but by no means the only standard. Wise investors should combine insider trading with other analysis dimensions to form a comprehensive judgment framework.
[0] Gilin API Data - Including company overview, real-time quotes, technical analysis, financial analysis and historical price data
[1] StockTitan - “ACEL (ACEL) shareholder files amended notice to sell 10000 shares” (https://www.stocktitan.net/sec-filings/ACEL/144-a-accel-entertainment-inc-sec-filing-27e60fe431e5.html)
[2] SEC.gov - “Accel Entertainment, Inc.: Form 144 - Report of proposed sale of securities” (https://www.sec.gov/Archives/edgar/data/1698991/000162828025057853/0001628280-25-057853-index.htm)
[3] The Globe and Mail - “3 Reasons to Sell ACEL and1 Stock to Buy Instead” (https://www.theglobeandmail.com/investing/markets/stocks/ACEL/pressreleases/36815100/3-reasons-to-sell-acel-and-1-stock-to-buy-instead/)
[4] Zacks Investment Research - “Implied Volatility Surging for Accel Entertainment Stock Options” (https://www.zacks.com/stock/news/2809053/implied-volatility-surging-for-accel-entertainment-stock-options)
[5] CNN Money - “ACEL Stock Quote Price and Forecast” (https://www.cnn.com/markets/stocks/ACEL)
Insights are generated using AI models and historical data for informational purposes only. They do not constitute investment advice or recommendations. Past performance is not indicative of future results.
About us: Ginlix AI is the AI Investment Copilot powered by real data, bridging advanced AI with professional financial databases to provide verifiable, truth-based answers. Please use the chat box below to ask any financial question.