S&P 500 Concentration Analysis: AI Mega-Cap Dominance and Market Risk Assessment
Unlock More Features
Login to access AI-powered analysis, deep research reports and more advanced features
About us: Ginlix AI is the AI Investment Copilot powered by real data, bridging advanced AI with professional financial databases to provide verifiable, truth-based answers. Please use the chat box below to ask any financial question.
Related Stocks
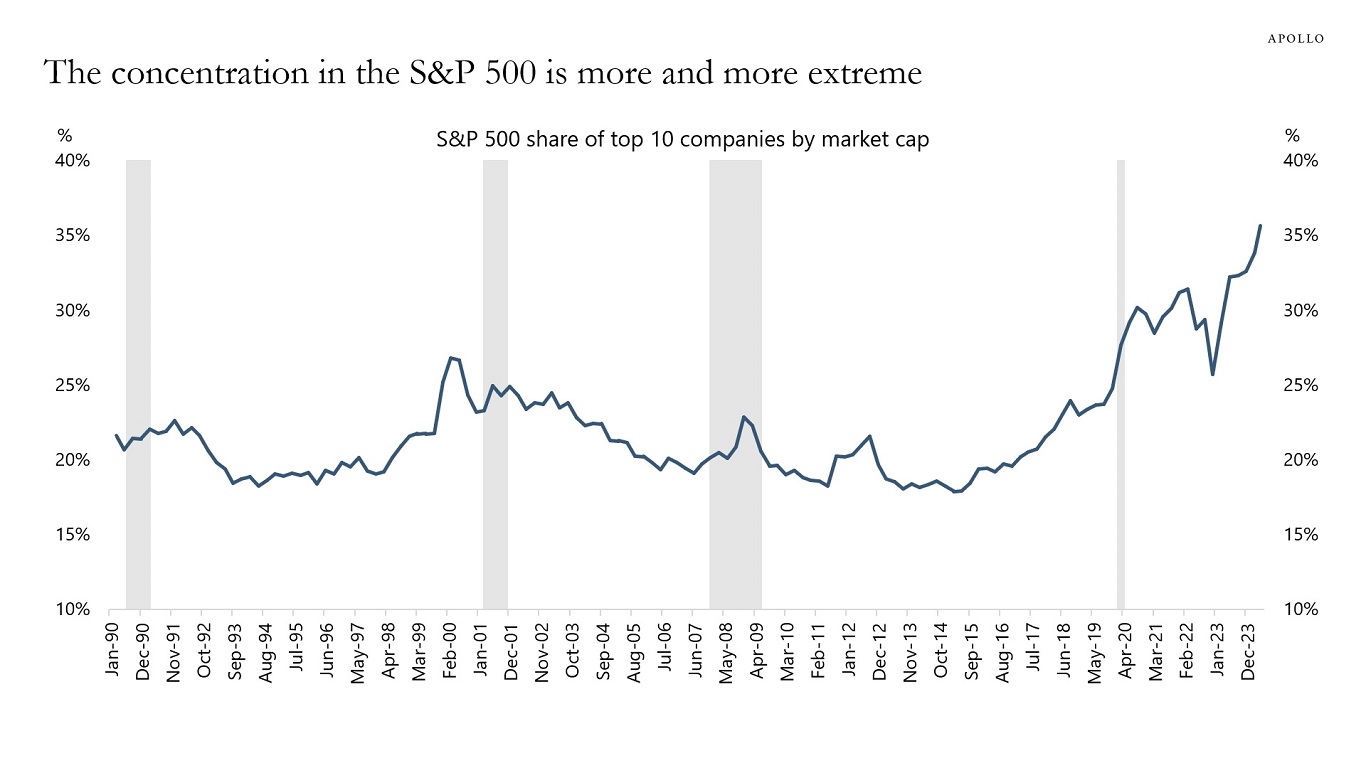
This analysis examines the Reddit post’s concerns about S&P 500 composition, which reflects a fundamental shift in market structure. The S&P 500 has evolved from broad market representation to what analysts now characterize as a “10-stock show,” with unprecedented concentration in AI-related mega-cap technology companies [0][1][2].
Current market data reveals extreme concentration levels:
- S&P 500: +1.01% over past 30 days, trading at $6,728.81 [0]
- Top 10 holdings: Now representover 40%of the entire index - the highest concentration on record [1][2]
- Top 3 stocks(Nvidia, Microsoft, Apple): Representover 22%of the index [1]
- NVIDIA alone: Comprises8.6%of the S&P 500 - the highest single-stock weighting ever recorded [1]
The concentration has created significant market divergence. While the cap-weighted S&P 500 has gained 86% over the past three years, the average S&P 500 stock has only risen 42% during the same period [1]. The equal-weight vs. cap-weighted ratio has reached its lowest level since 2003, indicating unprecedented market narrowness [1].
The “Magnificent Seven” tech giants (Apple, Microsoft, Alphabet, Amazon, Nvidia, Meta, Tesla) now represent
AI-related companies have dominated recent market performance:
- 75% of S&P 500 returnssince ChatGPT’s launch in late 2022 [2]
- 80% of earnings growthduring the same period [2]
2025 year-to-date performance among the Magnificent Seven shows continued dominance: NVIDIA (+50.8%), Alphabet (+48.5%), Microsoft (+22.9%), Tesla (+13.1%), Meta (+10.7%), Amazon (+11.3%), and Apple (+8.0%) [3].
The Reddit post’s concerns highlight a critical issue: investors buying S&P 500 index funds are essentially making a concentrated bet on AI mega-cap stocks rather than gaining broad market exposure. This creates several implications:
- Misaligned Expectations: Index investors may unknowingly have 40%+ exposure to just 10 stocks [1][2]
- Performance Dependency: Index returns now heavily dependent on AI sector performance [2]
- Valuation Risk: Extended valuations in mega-caps could lead to sharp corrections [4]
Current valuation levels raise concerns about potential bubble conditions:
- Magnificent Seven average P/E: 30x forward earnings (34% premium to S&P 500) [4]
- NVIDIA P/E: 53.45x (significantly above market average) [0]
- Market concentration risk: Top 10 companies now control nearly$19 trillionin combined value [2]
The concentration now exceeds even the dot-com era peaks, with over 30% of AI stocks trading at extreme multiples [2].
Recent sector performance reveals the narrowness of the current rally:
- Technology: +0.05% (underperforming despite mega-cap strength) [0]
- Communication Services: +1.06% [0]
- Financial Services: +2.26% (strong performer) [0]
- Utilities: +4.68% (best performer, possibly defensive rotation) [0]
The technology sector’s modest performance despite mega-cap gains suggests the rally is narrowly concentrated rather than broadly based.
- Concentration Risk: Three companies (Nvidia, Microsoft, Apple) control nearly 25% of the index [1][2]
- AI Bubble Concerns: Valuations resemble dot-com era levels, with potential for sharp corrections [2]
- Liquidity Risk: If mega-cap stocks stumble, the ripple effect could erase trillions in market value [2]
- S&P 500 Support: $6,550 (recent low) [0]
- S&P 500 Resistance: $6,920 (recent high) [0]
- NVIDIA Critical Level: $212 (52-week high) [0]
- Q4 2025 Earnings Season: Mega-cap results will heavily influence index direction
- Fed Policy Decisions: Interest rate changes could disproportionately affect high-multiple tech stocks
- AI Investment Cycle: Continuation of AI infrastructure spending crucial for sustaining valuations
The Reddit post serves as an important reminder of the current market structure. The S&P 500’s unprecedented concentration in AI mega-cap stocks represents both the opportunity and risk of the current market environment. While these companies have delivered exceptional returns and driven significant innovation, the concentration levels create systemic risk considerations for market participants.
The data suggests that investors seeking true broad market exposure may need to consider alternative approaches such as equal-weight indices, sector diversification, or international exposure to reduce concentration risk while maintaining market participation [1][2][4].
Current market conditions warrant careful monitoring of concentration levels, valuation metrics, and the sustainability of AI-driven growth trends. The divergence between cap-weighted and equal-weight performance indicates that market breadth remains a critical indicator to watch for potential shifts in market leadership.
Insights are generated using AI models and historical data for informational purposes only. They do not constitute investment advice or recommendations. Past performance is not indicative of future results.
About us: Ginlix AI is the AI Investment Copilot powered by real data, bridging advanced AI with professional financial databases to provide verifiable, truth-based answers. Please use the chat box below to ask any financial question.