In-depth Analysis of Pre-Market Decline in Tech Stocks: Short-Term Correction Signal or Structural Change?
Unlock More Features
Login to access AI-powered analysis, deep research reports and more advanced features
About us: Ginlix AI is the AI Investment Copilot powered by real data, bridging advanced AI with professional financial databases to provide verifiable, truth-based answers. Please use the chat box below to ask any financial question.
Related Stocks
According to real-time data from brokerage APIs, the U.S. Tech ‘Magnificent Seven’ (Magnificent 7) showed a differentiated pattern in today’s pre-market and early trading [0]:
- Tesla (TSLA): -2.10% ↘ $475.19 (largest decline)
- Meta (META): -0.64% ↘ $663.29
- Apple (AAPL): -0.15% ↘ $273.40
- Google (GOOGL): -0.18% ↘ $313.51
- Microsoft (MSFT): -0.06% ↘ $487.71
- NVIDIA (NVDA): +1.02% ↗ $190.53 (only significant gain)
- Amazon (AMZN): +0.06% → $232.52 (basically flat)
- The Technology sector fell 0.15% overall today, ranking moderately weak among 11 industries [0]
Based on technical analysis data [0]:
| Stock | Trend Type | Technical Signal | Key Support Level | Key Resistance Level |
|---|---|---|---|---|
NVDA |
Sideways Consolidation | KDJ Overbought Warning (82.3) | $181.31 | $193.37 |
TSLA |
Sideways Consolidation | KDJ Bearish Signal (61.3) | $460.99 | $484.05 |
AAPL |
Sideways Consolidation | RSI Normal Range | $271.18 | $276.94 |
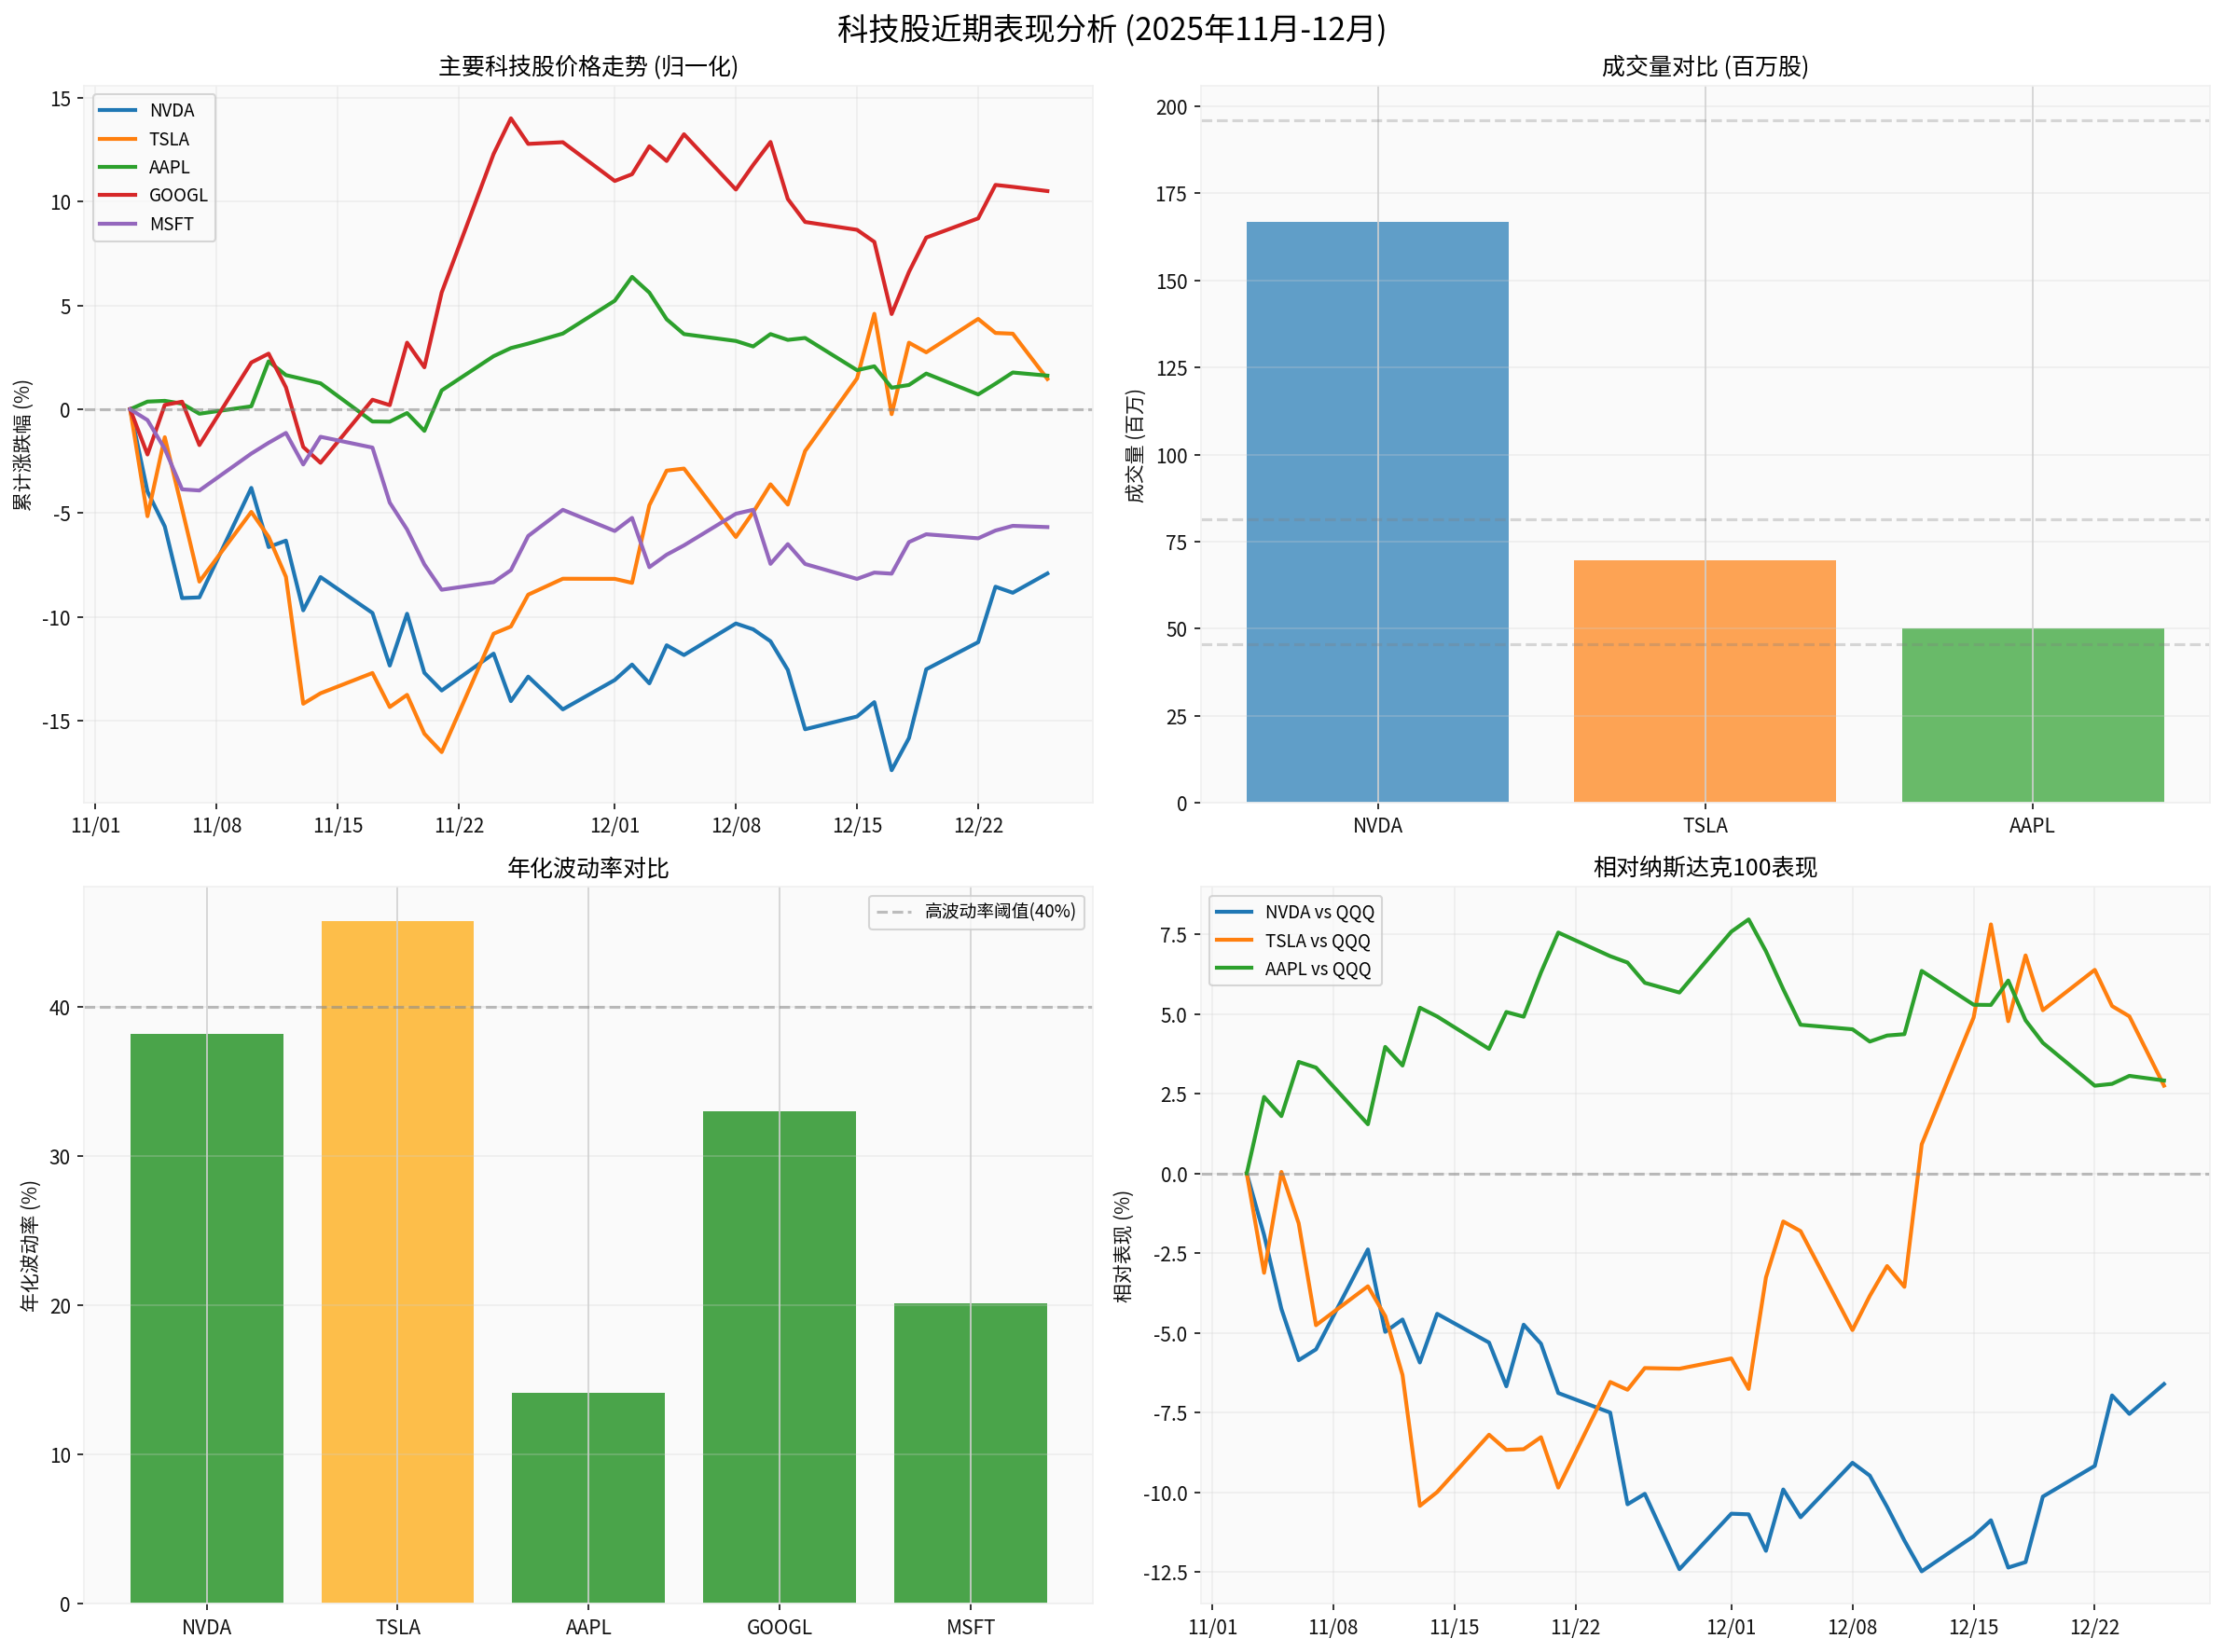
The chart shows normalized price trends, volume comparisons, annualized volatility, and relative performance against the Nasdaq 100 for major tech stocks from November to December 2025.
Based on brokerage API data analysis [0]:
- Best Performer: GOOGL (+10.50%), significantly outperforming the market
- Moderate Performers: META (+4.01%), TSLA (+1.46%), AAPL (+1.62%)
- Poor Performers: MSFT (-5.67%), NVDA (-7.90%), AMZN (-8.46%)
- Nasdaq 100 ETF (QQQ): -1.30%
- Obvious differentiationwithin tech stocks, no longer rising in sync
- NVDA, as an AI leader, experienced a significant pullback (-7.90%) in November
- GOOGL rose 10.50% against the trend, showing signs of capital rotation
- High Risk: TSLA (45.76%), NVDA (38.20%)
- Medium Risk: GOOGL (33.03%), META (25.40%), AMZN (25.03%)
- Low Risk: MSFT (20.15%), AAPL (14.11%)
From the relative performance lines in the chart [0]:
- NVDA vs QQQ: Significantly underperformed in November, narrowed in December but still weaker than the market
- TSLA vs QQQ: Overall flat, recent relative performance improved
- AAPL vs QQQ: Relatively stable, slightly outperforming the market
- Supply Chain Issues: News shows Tesla supplier contracts were significantly cut, with battery material contracts reduced by 99%, reflecting potential production difficulties for Cybertruck [1]
- Raw Material Cost Pressure: Elon Musk publicly warned about soaring silver prices, which hit a record £58/ounce at the end of December. Each electric vehicle contains 25-50 grams of silver. China will implement silver export restrictions starting January 1, 2026, further pushing up costs [1]
- Valuation Pressure: TSLA’s P/E ratio is as high as 250.10, far exceeding other tech stocks [0]
- Low Year-End Volume: Market volume is light after the Christmas holiday, asset price movements are easily amplified, and year-end portfolio adjustments may also bring volatility [1]
- Profit-Taking Pressure: Tech stocks performed strongly in 2025 (Nasdaq Composite Index rose 22% year-to-date), some investors chose to lock in profits at the end of the year [1]
- NVDA’s KDJ indicator shows an overbought warning (K-value 82.3) [0]
- Many tech stocks entered overbought territory after recent rebounds, increasing demand for technical correction
- NVDA faces resistance around $193.37 [0]
- TSLA is under pressure around $484.05 [0]
According to market analysis from web searches [1][2]:
- AI Valuation Concerns: Well-known value investment institution GMO predicts that the S&P 500 Index will have weak returns in 2026 due to high concentration in expensive AI stocks. Overvalued AI stocks will start to underperform, and investors will shift to other areas
- AI ROI Doubts: Goldman Sachs points out that the market value growth of the 7 tech giants has slowed from $5.4 trillion in 2024 to $3.5 trillion, and market focus is shifting from computing power frenzy to cold thinking about AI return on investment
- Capital Rotation: Funds are flowing from crowded AI infrastructure stocks to discounted targets that use AI to reduce costs and increase efficiency, indicating sector rotation in the market
Insights are generated using AI models and historical data for informational purposes only. They do not constitute investment advice or recommendations. Past performance is not indicative of future results.
About us: Ginlix AI is the AI Investment Copilot powered by real data, bridging advanced AI with professional financial databases to provide verifiable, truth-based answers. Please use the chat box below to ask any financial question.