Lululemon Founder Proxy Fight: Analysis of Corporate Governance & Strategic Impact and Investor Response Strategies
Unlock More Features
Login to access AI-powered analysis, deep research reports and more advanced features

About us: Ginlix AI is the AI Investment Copilot powered by real data, bridging advanced AI with professional financial databases to provide verifiable, truth-based answers. Please use the chat box below to ask any financial question.
Related Stocks
Lululemon founder
- Early December 2025: CEO Calvin McDonald announced resignation by January 31, 2026
- Mid December 2025: Elliott Management’s shareholding plan exposed; pushing former Ralph Lauren executive Jane Nielsen as new CEO
- Late December 2025: Chip Wilson officially initiated proxy fight, demanding board restructuring [0][1]
###1.2 Core Disputes
- Brand Positioning Strategy: Wilson is dissatisfied with the company’s current marketing strategy, believing LULU needs to return to its roots ashigh-end women’s yoga apparelinstead of over-expanding [2]
- Product Portfolio Issues: Elliott points out LULU’s North American product portfolio fails to reflect the company’s future vision, especially deviating from core customer groups [2]
- Performance: Since the stock price hit a high of ~$516 at the end of 2023, LULU has fallen by ~60%, which is the direct trigger for the founder and activist investors to take action [0][4]
###2.1 Stock Price Performance & Valuation
- Current Stock Price: $208.97 (as of December 26, 2025 close)
- YTD Performance: -43.87%
- 52-Week Range: $159.25 - $423.32
- Market Cap: $23.44B
- P/E Ratio (TTM):14.53x (far below 10-year average of 41.6x)
- P/B Ratio:5.21x
- Beta:1.01 (equivalent to market volatility)
###2.2 Latest Performance (Q3 2025) [0][2]
- Total Revenue: $2.566 billion (7% YoY growth)
- U.S. Market: -3% decline (same-store sales down 5%)
- Canadian Market: -1% decline
- International Market:33% growth (Mainland China up46%, same-store sales up24%)
- Gross Margin:55.6% (290 basis points YoY decline)
- Operating Margin:17.0% (350 basis points YoY decline)
- EPS: $2.59 (vs. $2.87 YoY, down9.8%)
- Tariff Impact: U.S. canceled duty-free policy for imported goods under $800 (de minimis rule)
- Higher Promotional Discounts: Q3 discount rate increased by ~90 basis points YoY
- Exchange Rate Factors: Minor negative impact (10 basis points)
Management expects tariff impact to reduce 2025 fiscal year operating profit by ~
###2.3 Financial Health
- Strong ROE:39.22%
- Healthy Net Margin:15.72%
- Operating Margin:22.04%
- Free Cash Flow: $1.58 billion
- Balance Sheet: No corporate debt, cash over $1 billion
- Current Ratio:1.51 (good short-term solvency)
- Stagnant or shrinking growth in North American market
- Sustained pressure on gross margin
- Inventory growth of11% (unit growth of4%), need to manage inventory levels
###3.1 Corporate Governance Structure Faces Restructuring
- Wilson and Elliott are likely to demand more independent director representation, especially directors with retail and brand transformation experience
- May promote diversification of board skill sets, strengthening expertise in brand management, supply chain optimization, and cost control
- Board may become more shareholder-oriented, focusing more on operational efficiency and shareholder returns
- CEO transition period (early 2026) will be a key turning point
- Jane Nielsen, the candidate supported by Elliott, if elected, may bring:
- Cost Discipline: Experience at Ralph Lauren and Coach shows expertise in cost control
- Brand Focus: Return to core customer groups and product lines
- Operational Efficiency: Optimize supply chain and inventory management
###3.2 Positive Impact of Governance Mechanisms
- Strengthened Accountability: Activist investor involvement will enhance board oversight of management
- Strategic Reassessment: Force the company to re-examine brand positioning, product portfolio, and market strategy
- Shareholder Value Orientation: May drive more aggressive capital allocation (stock repurchases, dividends, etc.)
- Performance Culture: Establish clearer performance metrics and accountability mechanisms
###3.3 Potential Governance Risks
- Strategic Disruption: Proxy fight may distract management and affect daily operations
- Short-Termism: Activist investors may overfocus on short-term financial indicators, harming long-term brand building
- Talent Drain: Unstable executive team may lead to loss of core talent
- Decision Efficiency: Board disagreements may reduce decision speed and efficiency
###4.1 Brand Positioning & Product Strategy
-
Return to Core: Refocus on high-end women’s yoga and athletic apparel
- Streamline product lines, reduce non-core categories
- Strengthen brand uniqueness and premium positioning
- Reduce excessive promotions to protect brand value
-
Market Strategy Adjustment:
- North American Market: Need to regain core customer groups, possibly through product innovation and store experience enhancement
- Chinese Market: Continue to accelerate expansion, plan to enter 6 new markets in 2026 (including India and 5 European markets) [5]
- Supply Chain: May need to adjust supply chain layout to address tariff challenges
###4.2 Cost Structure & Operational Efficiency
- SG&A Optimization: Cut general administrative expenses to improve operational efficiency
- Supply Chain Optimization: Reduce costs through supplier negotiations and distribution center efficiency improvements
- Pricing Strategy: Strategic price increases to pass on tariff costs
- Inventory Management: Strictly control inventory levels to reduce discount demand
###4.3 Rebalancing Growth Strategy
- International markets (especially China) are main growth drivers
- North American market faces structural challenges
- Accelerated Internationalization: Continue to expand international market coverage, reduce dependence on North America
- Digital Investment: Strengthen e-commerce capabilities and digital transformation
- Cautious Category Expansion: May slow expansion of men’s and other non-core categories
- Customer Experience: Reinvest in store experience and community building, return to LULU’s “tribe culture”
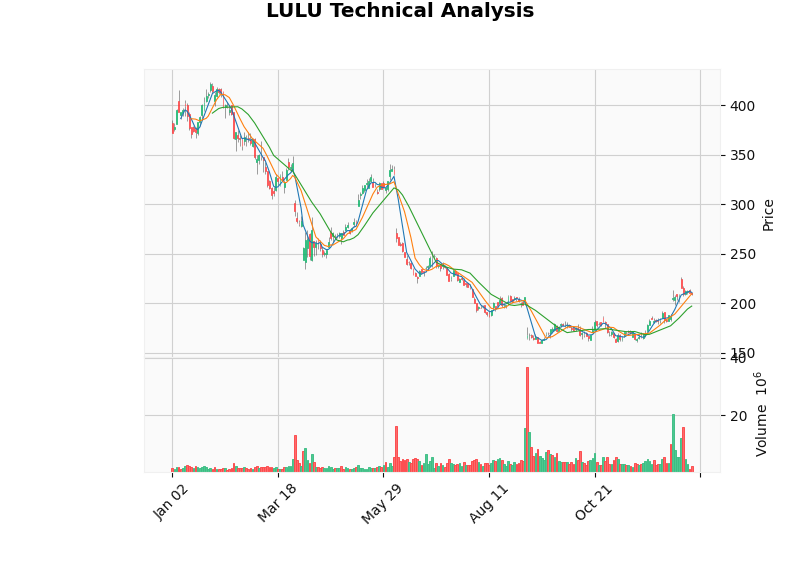
###5.1 Technical Analysis
According to technical analysis [0]:
- Trend Status: Sideways
- Support Level: $196.99
- Resistance Level: $212.67
- Trading Range: Recommended to trade within $196.99-$212.67
- Technical Indicators:
- MACD: No crossover (bullish bias)
- KDJ: Bearish
- RSI: Normal range
- Beta:1.01 (equivalent to market volatility)
###5.2 Analyst Ratings
- Consensus Target Price: $183.00 (12.4% below current price)
- Target Range: $146.00 - $303.00
- Analyst Distribution:
- Buy:32 (46.4%)
- Hold:33 (47.8%)
- Sell:4 (5.8%)
- Jefferies: Maintain Hold
- Barclays: Maintain Neutral
- BTIG: Maintain Buy
- Stifel: Maintain Hold (target price上调 from $205 to $210)
- UBS: Maintain Neutral
###6.1 Short-Term Investors (3-6 Months)
-
Upside Catalysts:
- CEO appointment confirmation (especially Jane Nielsen) may boost market confidence
- Board restructuring agreement reduces uncertainty
- Q4 performance exceeds expectations
- Stock repurchases support share price
-
Downside Risks:
- Proxy fight escalation leads to governance chaos
- North American market continues to weaken
- Tariff impact exceeds expectations
- New CEO’s strategic adjustments take time
- Wait & See: Stay cautious until governance uncertainty is resolved
- Range Trading: Trade within the $196.99-$212.67 range
- Strict Stop-Loss: Consider stopping loss if breaking below $196.99 support
- Focus on Event Drivers: Monitor board restructuring progress, CEO appointment, Q4 performance
###6.2 Mid-Term Investors (6-18 Months)
-
Governance Improvement Signals:
- Qualifications and strategic vision of new CEO
- Completion of board restructuring and consensus building
- Management team stability
-
Performance Inflection Point Confirmation:
- Stabilization and recovery of North American same-store sales
- Stable or improving gross margin
- Sustained international growth
-
Valuation Recovery Potential:
- Current 14-15x P/E is significantly discounted vs. historical levels
- Valuation may recover to 20-25x if governance improves and performance recovers
| Scenario | Stock Price Target | Action Recommendation |
|---|---|---|
Optimistic (Governance improvement + performance recovery) |
$260-$300 | Gradually build positions, target holding until mid-2026 |
Baseline (Progressive improvement) |
$220-$240 | Appropriate allocation at current price or below $200 |
Pessimistic (Continuous deterioration) |
$150-$180 | Avoid or light position, wait for clearer signals |
- Dollar-Cost Averaging: Build positions in 3-4 tranches within the $195-$210 range
- Event-Driven加仓: Add positions when positive catalysts emerge (e.g., CEO appointment, better-than-expected performance)
- Risk Control: Single position should not exceed 5-10%, set $180 stop-loss
###6.3 Long-Term Investors (18+ Months)
- Brand Assets: LULU remains a iconic brand in high-end yoga apparel with strong brand awareness and customer loyalty
- Financial Quality: Strong ROE (39.22%), healthy cash flow, debt-free balance sheet [0]
- International Potential: Strong performance in Chinese market, huge space for international expansion
- Free Cash Flow: $1.58 billion FCF supports stock repurchases and reinvestment [0]
- Brand Aging: Faces competition from emerging brands like Vuori and Alo Yoga
- North American Saturation: Growth ceiling in core market
- Tariff Structure: Long-term pressure on supply chain costs
- Governance Uncertainty: Disagreements between founder and management may persist
- Valuation Recovery: If the company can resume growth, valuation may recover from current 14x to historical range of25-30x
- Business Transformation: Strategic adjustments by new CEO and board may reshape competitiveness
- International Dividend: Chinese and other international markets provide long-term growth drivers
- Shareholder Returns: Under activist investor pressure, capital allocation may become more shareholder-friendly (repurchases, dividends)
- Value Investment: Current price may provide attractive entry point for long-term value investors
- Patience: Business transformation takes time (18-24 months), investors need sufficient patience
- Regular Evaluation: Assess transformation progress and performance inflection points quarterly
- Portfolio Allocation: Allocate as a consumer/retail sector holding, weight 5-15%
###7.1 Governance-Related Indicators
- Board restructuring progress and timeline
- New CEO appointment and background
- Public statements by Chip Wilson and Elliott
- Management changes (executive turnover rate)
###7.2 Business Operations Indicators
- North American same-store sales growth rate
- Gross margin trend (especially tariff impact mitigation)
- Inventory turnover rate
- Sustained growth momentum in Chinese market
- Progress in entering new markets
###7.3 Financial Indicators
- Operating margin
- Free cash flow
- Capital expenditure efficiency
- Stock repurchase execution
###7.4 Market Indicators
- Relative valuation (vs. Nike and peers)
- Short interest rate changes
- Institutional holdings changes
- Analyst rating adjustments
###8.1 Core Views
Lululemon is at a
###8.2 Key Risk Warnings
- Governance Risk: Proxy fight may escalate, leading to strategic chaos and talent drain
- Operational Risk: North American market recovery slower than expected, sustained tariff impact
- Competition Risk: Emerging brands continue to erode market share
- Valuation Risk: Even if performance improves, valuation may not fully recover to historical highs
###8.3 Summary of Investment Recommendations
| Investor Type | Recommended Action | Target Price | Stop-Loss Price | Time Frame |
|---|---|---|---|---|
| Short-Term Trader | Wait & see or range trade | $213 | $197 | 3-6 months |
| Mid-Term Investor | Gradually build positions ($195-$210) | $240-$260 | $180 | 6-18 months |
| Long-Term Investor | Value investment, hold patiently | $300+ | $160 | 18+ months |
[0] Gilin API Data - LULU real-time quotes, company profile, financial analysis, technical analysis and historical price data
[1] Bloomberg - “Stock Movers: DigitalBridge, Lululemon, Airbus” (2025-12-29) - Report on Chip Wilson’s proxy fight initiation
Insights are generated using AI models and historical data for informational purposes only. They do not constitute investment advice or recommendations. Past performance is not indicative of future results.
About us: Ginlix AI is the AI Investment Copilot powered by real data, bridging advanced AI with professional financial databases to provide verifiable, truth-based answers. Please use the chat box below to ask any financial question.