Market Analysis: Record-High Shiller CAPE Ratio and Extreme Fear Signal Historical Risk Pattern
Unlock More Features
Login to access AI-powered analysis, deep research reports and more advanced features
About us: Ginlix AI is the AI Investment Copilot powered by real data, bridging advanced AI with professional financial databases to provide verifiable, truth-based answers. Please use the chat box below to ask any financial question.
Related Stocks
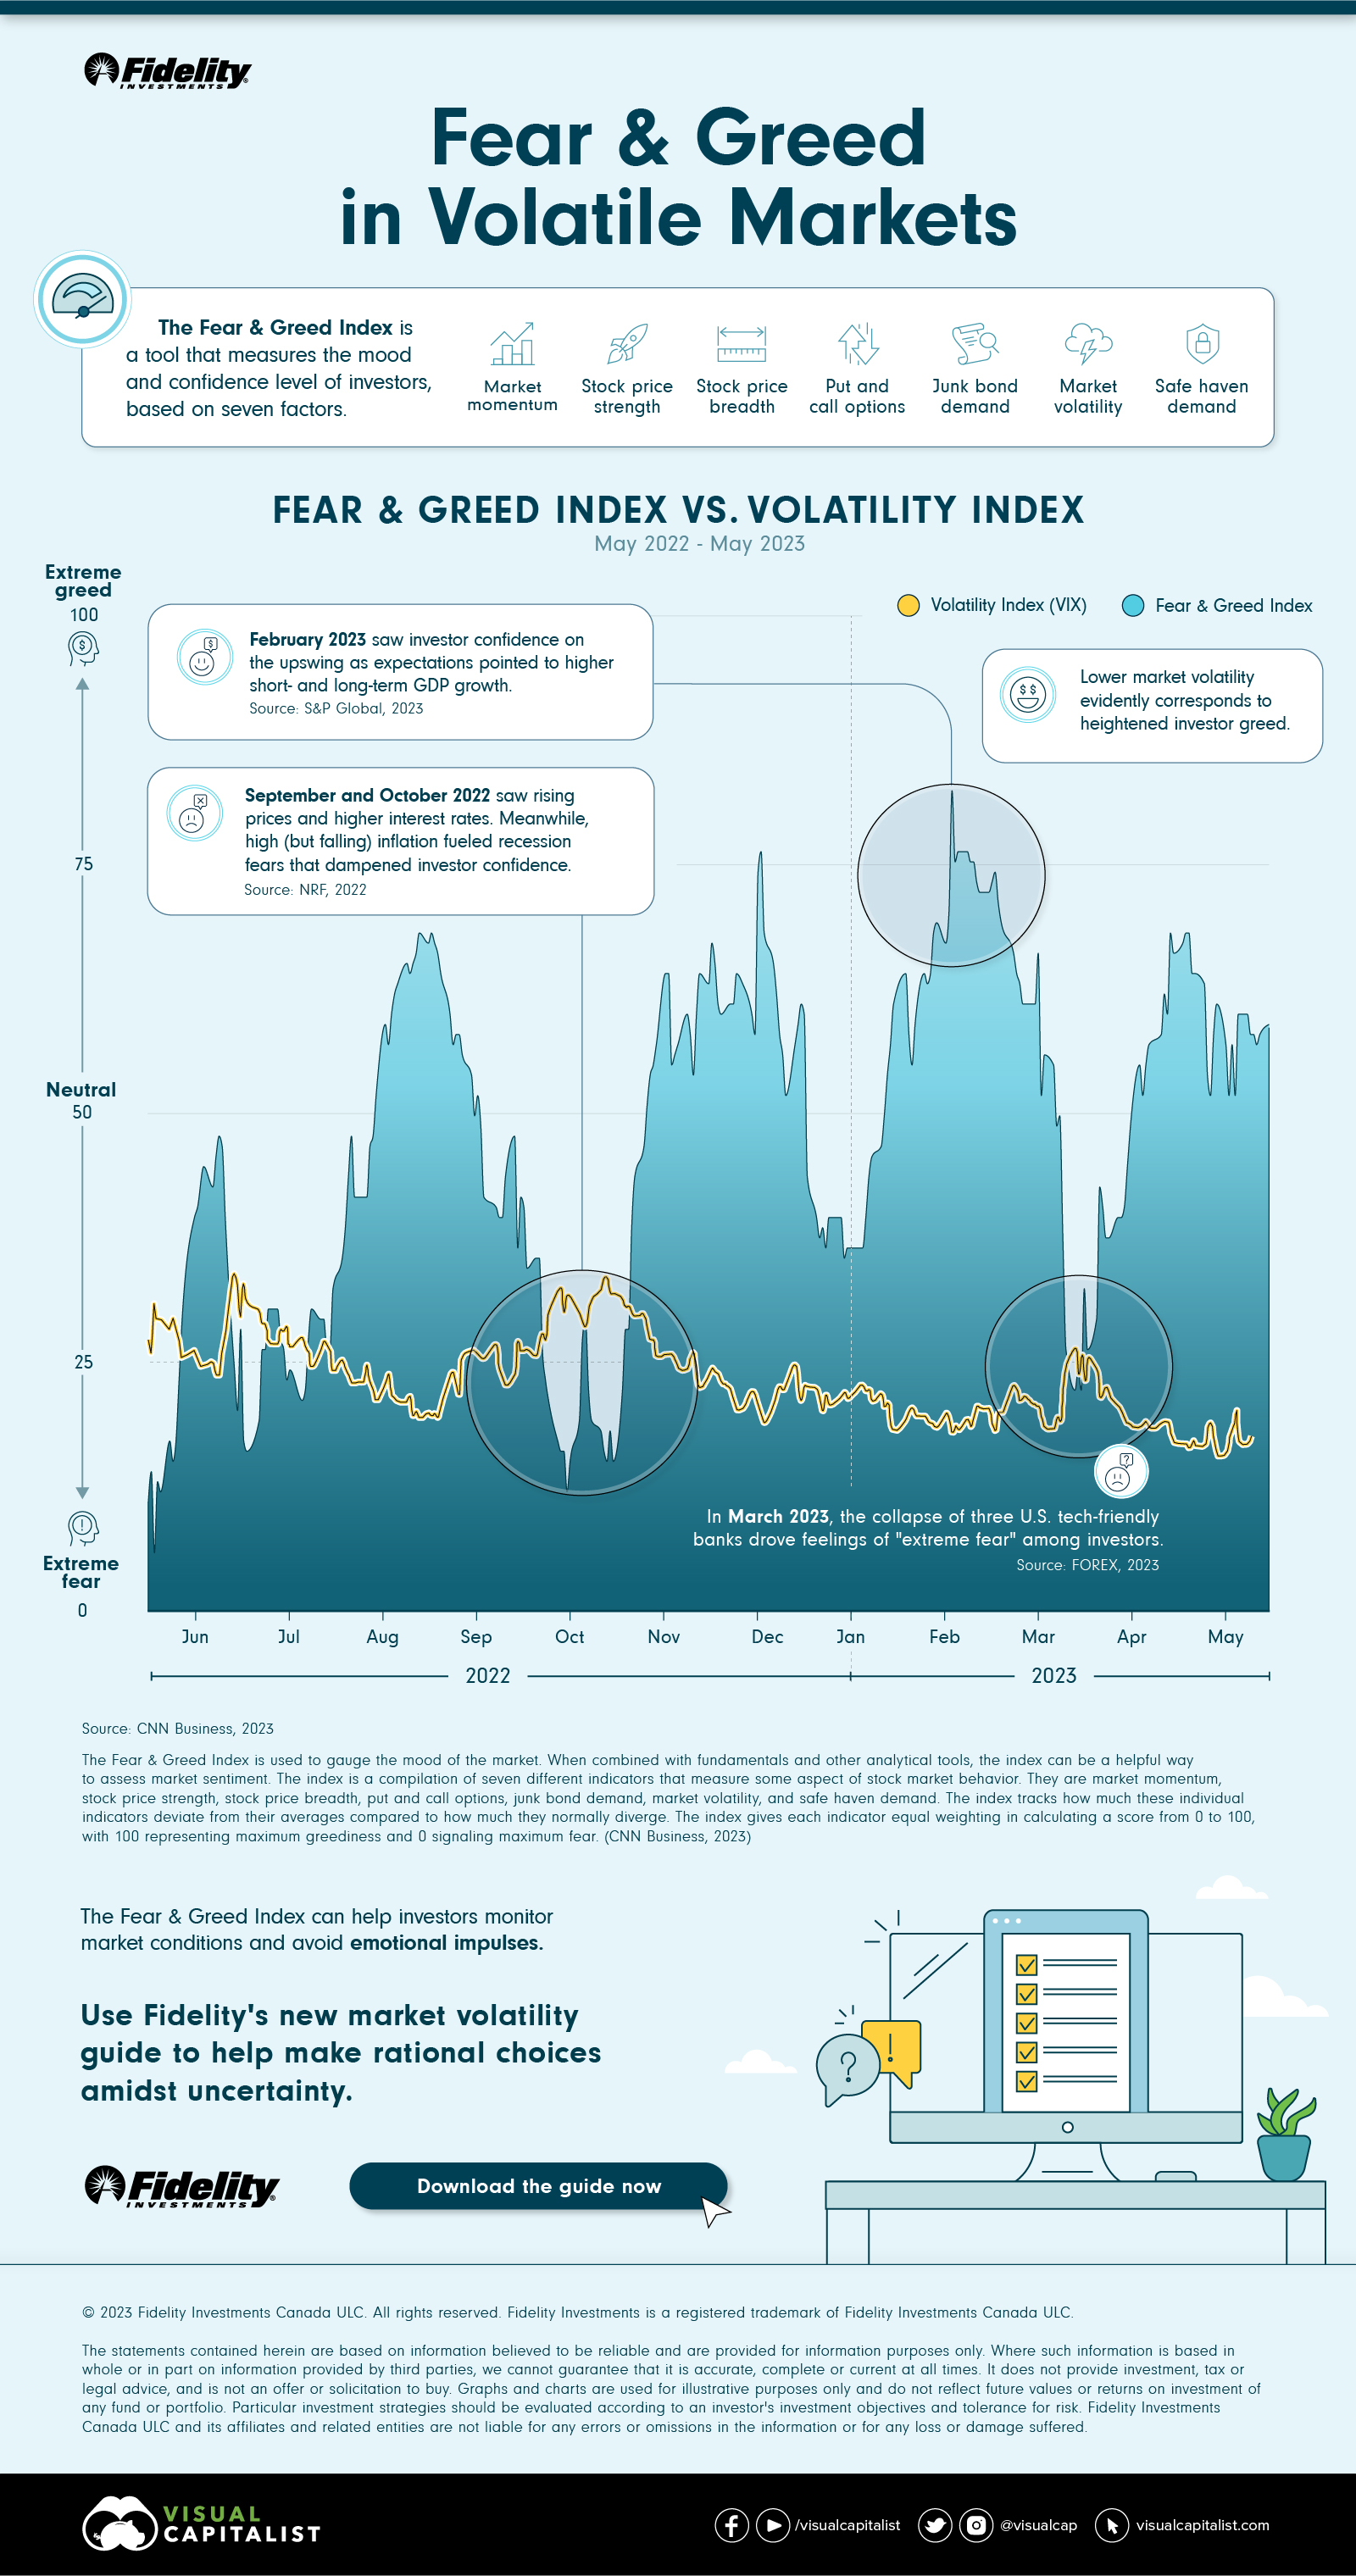
This analysis is based on a Reddit post [0] published on November 7, 2025, which warned that record-high Shiller CAPE valuations alongside extreme market fear have historically preceded major crashes like 1929, the early 1970s, and 2000.
The S&P 500 Shiller CAPE Ratio currently stands at
The fear-valuation divergence is particularly concerning:
- CNN Fear & Greed Index: 21 (Extreme Fear) as of November 7, 2025 [3]
- VIX Volatility Index: 19.08 (up 25.53% from 15.20 one year ago) [4]
This unusual combination of record valuations with extreme fear suggests market instability and potential turning point conditions [0].
The current combination mirrors dangerous historical periods that preceded major market declines:
Based on Morningstar analysis, CAPE peaks have consistently preceded severe market declines, including 1936, 1966, 1972, and 1987, all followed by significant losses [6].
Despite the warning signals, recent market action shows mixed performance:
- S&P 500: Up 1.01% over the past 30 trading days (6728.81) [0]
- NASDAQ: Up 1.77% (23004.54) [0]
- Dow Jones: Up 1.47% (46987.11) [0]
- Russell 2000: Down 0.40% (2432.82), showing small-cap weakness [0]
Sector performance reveals defensive positioning with Utilities leading (+4.68%) and Financial Services strong (+2.26%), while Technology lagging (+0.05%) and Consumer Cyclical weak (+0.08%) [0].
The combination of record-high valuations with extreme fear represents one of the most reliable warning signals in market history. This divergence suggests that market participants are increasingly concerned about valuation sustainability, even as prices remain elevated [0].
The pattern of high CAPE ratios followed by corrections has been remarkably consistent across different market cycles and economic environments [5][6]. The current CAPE of 39.51 places markets in historically dangerous territory that has preceded major declines in multiple decades.
The Russell 2000’s underperformance (-0.40%) while major indices show gains could be an early warning sign of broader market weakness, as small-cap stocks often lead market turns [0].
Key risk indicators include:
- Valuation Extremes: Current CAPE more than double historical average [5]
- Fear-Valuation Divergence: Unusual combination suggesting instability [0]
- Historical Pattern: Major declines followed similar CAPE peaks [5][6]
- CAPE Ratio Trend: Watch for continued acceleration or stabilization
- Fear & Greed Index: Monitor for persistence below 25
- VIX Movements: Sustained levels above 20 would increase concern
- Earnings Reports: Q4 2025 results will be critical for valuation justification
- Fed Policy: Any hawkish surprises could trigger corrections
Critical missing information includes:
- Earnings Growth Sustainability: Analysis of whether current earnings justify valuations
- Interest Rate Environment: Impact of Fed policy on valuation metrics
- Sector-Specific Risks: Which industries driving the high valuations
- Accounting Changes: Potential post-1990s accounting changes affecting CAPE accuracy [5]
The current market environment presents a historically significant warning signal. The combination of record-high Shiller CAPE valuations (39.51) with extreme fear (Fear & Greed Index at 21) mirrors conditions that preceded major market crashes in 1929, 2000, and other significant downturns. While markets can remain overvalued for extended periods, the historical precedent suggests elevated risk of a significant correction in the medium term.
Defensive sector outperformance (Utilities +4.68%) and small-cap weakness (Russell 2000 -0.40%) suggest some market participants are already positioning for potential volatility [0]. Careful risk management and defensive positioning appear warranted given the current valuation extremes.
Insights are generated using AI models and historical data for informational purposes only. They do not constitute investment advice or recommendations. Past performance is not indicative of future results.
About us: Ginlix AI is the AI Investment Copilot powered by real data, bridging advanced AI with professional financial databases to provide verifiable, truth-based answers. Please use the chat box below to ask any financial question.