2026 Container Shipping Industry Investment Guide: Opportunity and Risk Assessment Under Structural Supply-Demand Imbalance
Unlock More Features
Login to access AI-powered analysis, deep research reports and more advanced features

About us: Ginlix AI is the AI Investment Copilot powered by real data, bridging advanced AI with professional financial databases to provide verifiable, truth-based answers. Please use the chat box below to ask any financial question.
Related Stocks
Now I will prepare a comprehensive 2026 Container Shipping Industry Investment Guide for you.
The 2026 container shipping industry presents
According to industry data, the container shipping industry will迎来
- Order backlog: Exceeds 10 million TEU, accounting for about 30% of the existing fleet [0]
- 2026 new ship deliveries: Approximately 2.6 million TEU expected
- Scrapping volume: Only about 0.2 million TEU (delayed scrapping of aging ships)
- Net capacity increase: About 2.4 million TEU
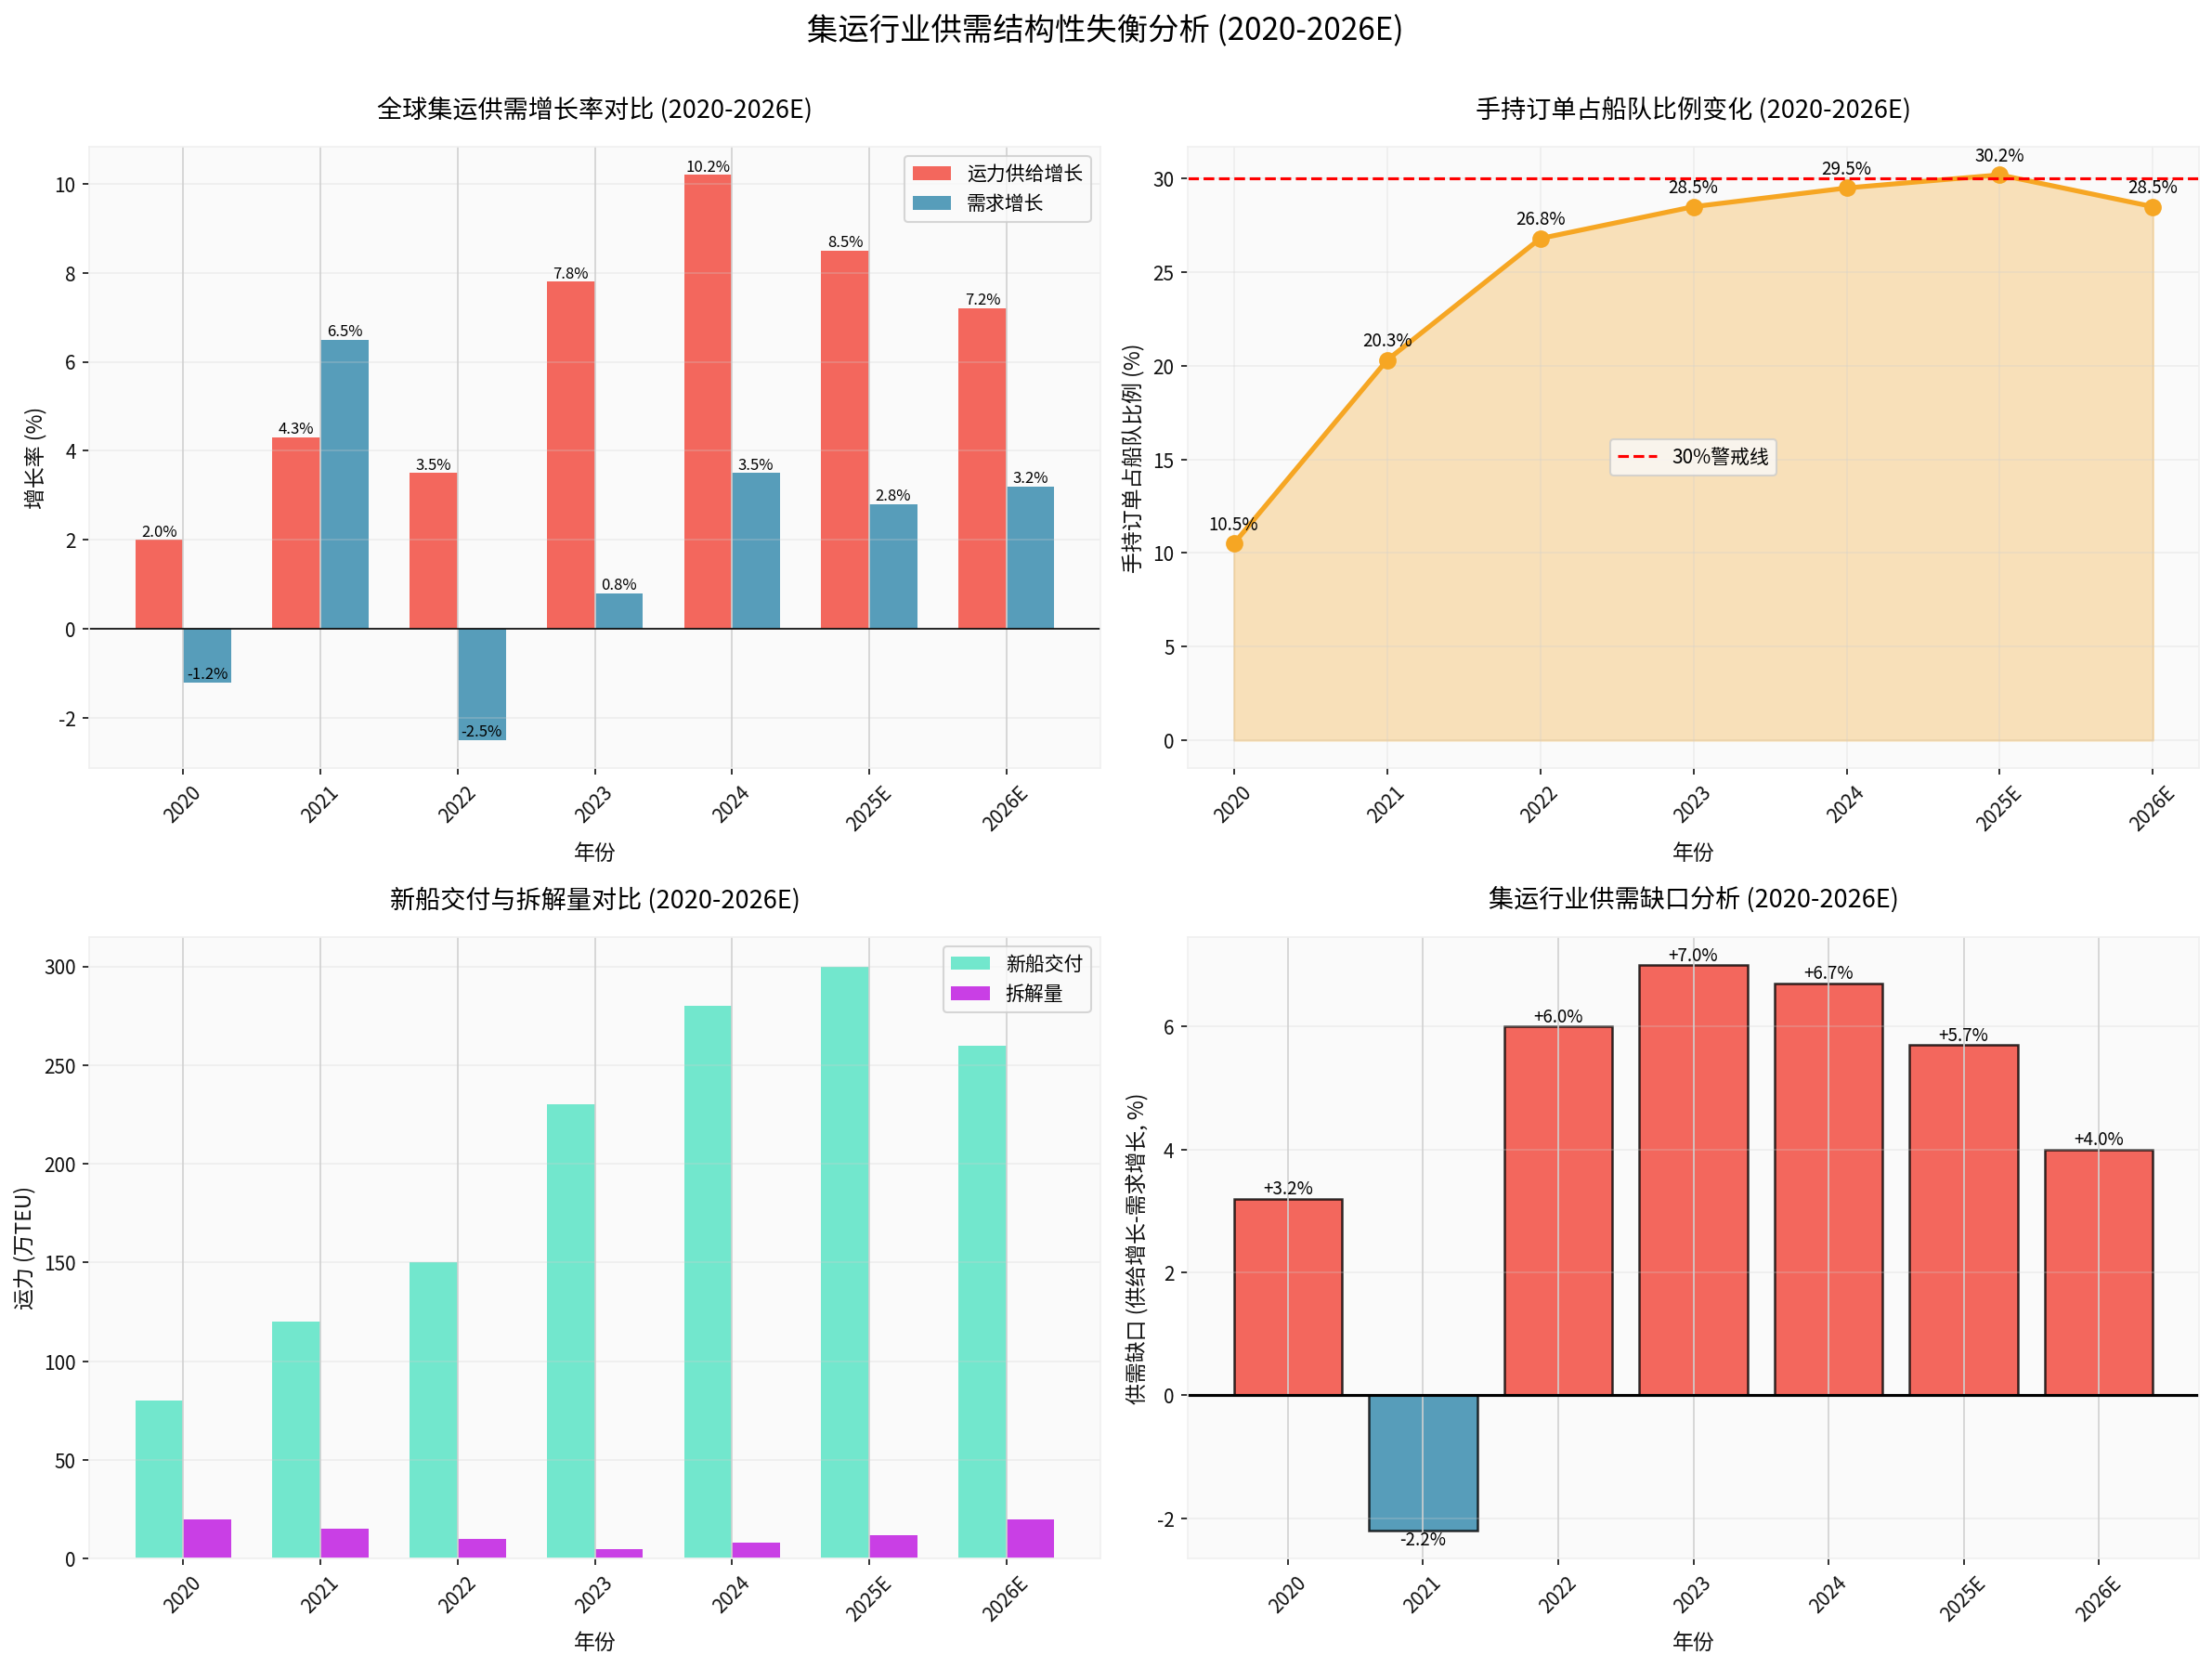
- 2025: Capacity growth 8.5%, demand growth 2.8%, supply-demand gap +5.7%
- 2026E: Capacity growth 7.2%, demand growth 3.2%, supply-demand gap +4.0%
Although there is nominal overcapacity pressure, the actual supply of effective capacity needs to consider multiple constraints.
The order backlog to fleet ratio is expected to remain at a high level of
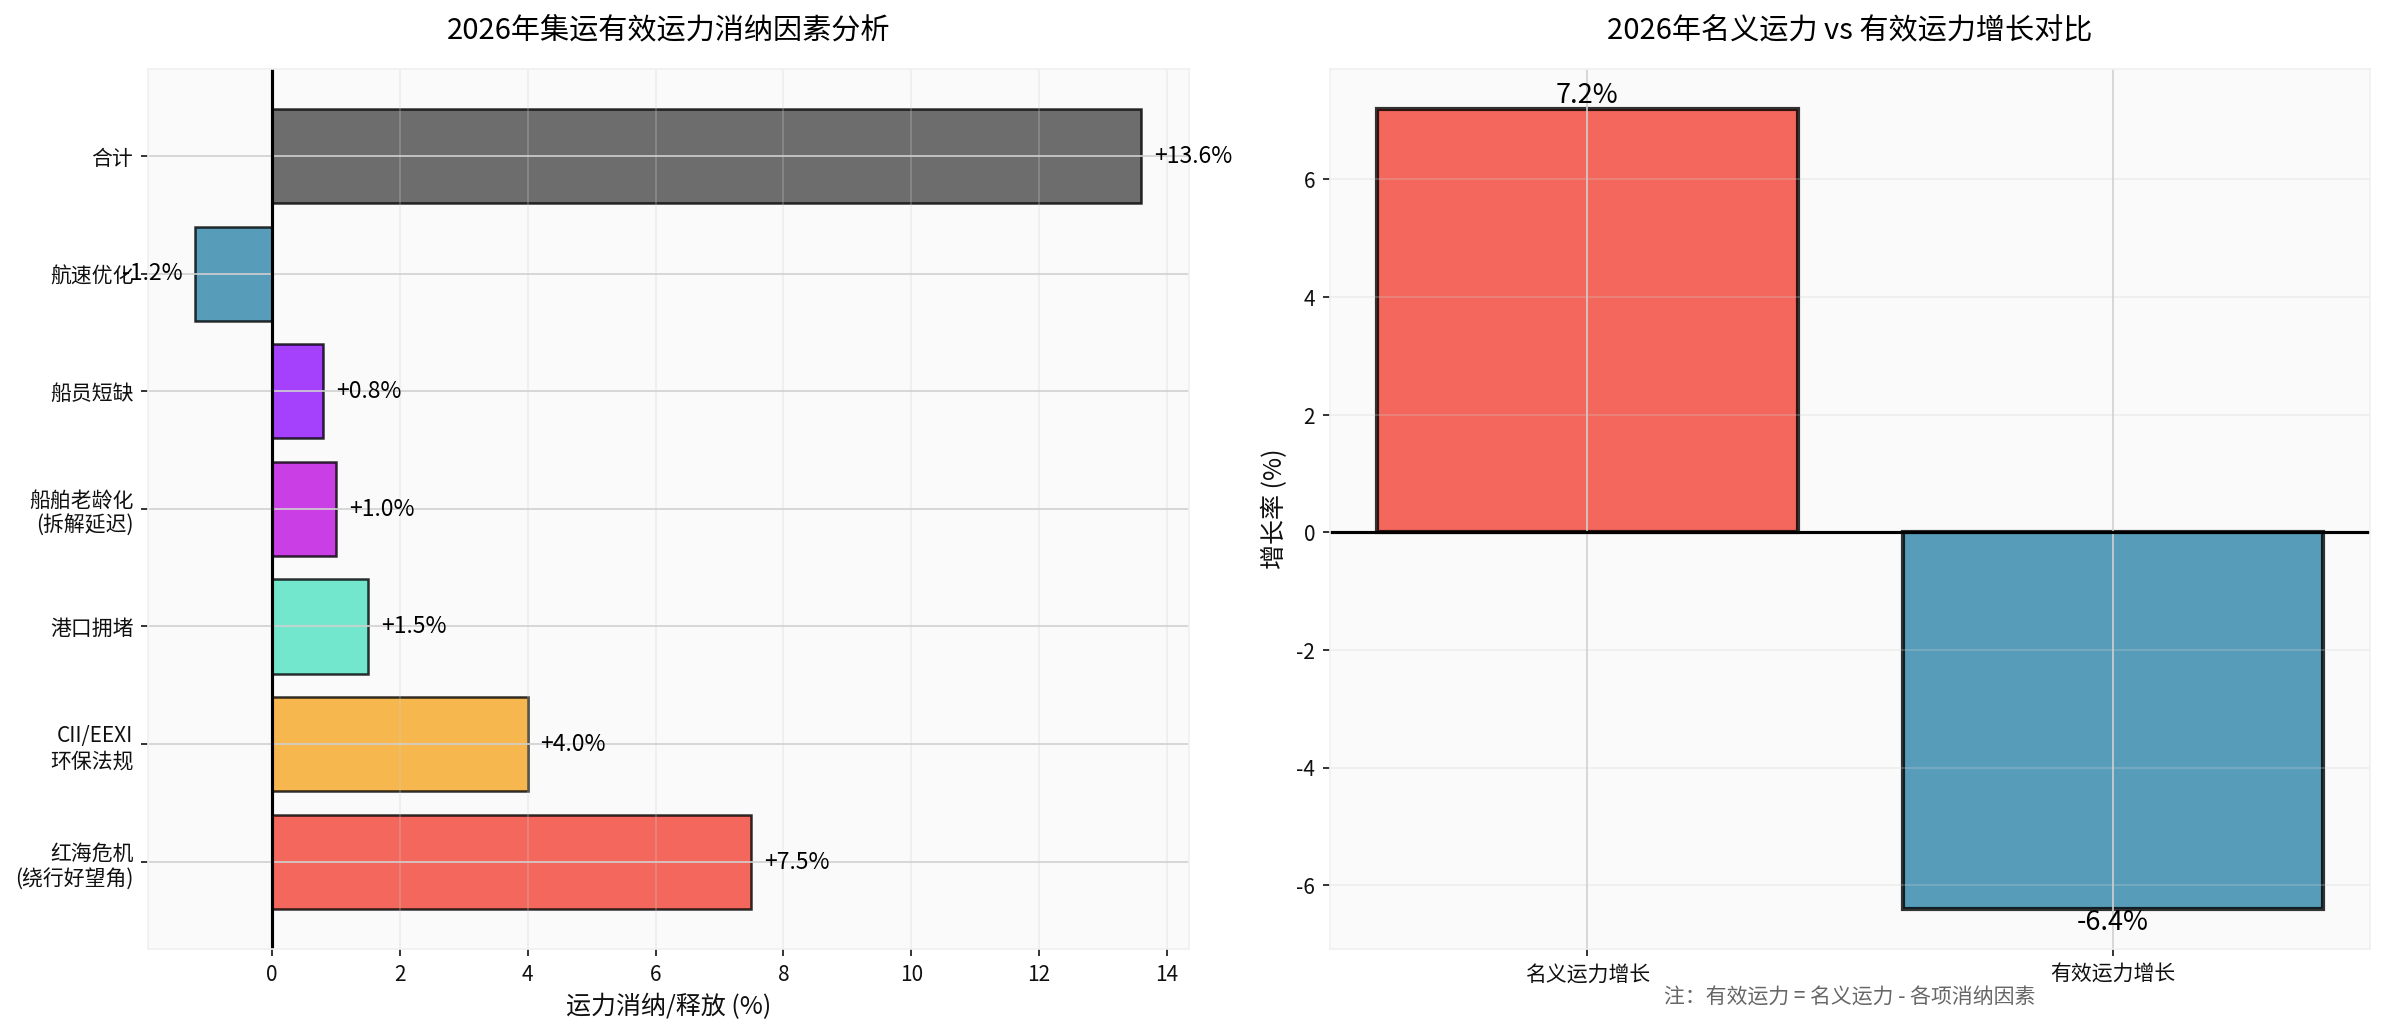
- Detour via Cape of Good Hope: Since November 2023, the Red Sea crisis has forced major shipping companies to detour around Africa’s Cape of Good Hope. The Asia-Europe route voyage increases by about 30-40%, and sailing time increases by 10-14 days
- Passive Capacity Absorption: According to industry analysis, this detour is equivalent toeffectively absorbing 7-9% of global capacity
- Sustained Uncertainty: Geopolitical situation in 2026 remains highly uncertain, and the timeline for the Red Sea route to return to normal is difficult to predict [1]
Environmental regulations from the International Maritime Organization (IMO) have a significant impact on ship operations:
- CII (Carbon Intensity Indicator): Requires ships to reduce carbon emission intensity; ships with D/E ratings need to formulate rectification plans
- EEXI (Energy Efficiency Existing Ship Index): Limits main engine power and enforces speed reduction
- Slow Steaming: To meet carbon emission requirements, ships generally reduce speed by 10-15%, equivalent toabsorbing 3-5% of excess capacity
- Scrapping volume lower than expected: Only 0.2 million TEU is expected to be scrapped in 2026, far below the historical cycle high
- Aging capacity remains in operation: Due to high new ship construction costs and improved freight rate expectations, shipowners tend to extend the service life of aging ships
- 2027-2028 scrapping peak: A real scrapping peak is expected in 2027-2028
- Port Congestion: Absorbs about 1.5% of capacity
- Crew Shortage: Absorbs about 0.8% of capacity
- Speed Optimization: Releases about 1.2% of capacity (partially offset)
About
- LNG (Liquefied Natural Gas): Mature technology, relatively complete infrastructure, but faces methane leakage controversy
- Methanol: Green methanol path led by Maersk, lower carbon emissions, but higher cost
- Ammonia: Zero carbon emission potential, but technology not yet mature; safety and cost remain challenges
- LPG (Liquefied Petroleum Gas): Transitional fuel option
- New ship cost premium: Dual-fuel ships cost15-25%more than traditional ships
- Fuel cost difference: Green methanol price is2-3 timeshigher than traditional fuel oil
- Extended investment return cycle: The investment return cycle of green ships extends from the traditional 8-10 years to 12-15 years
Green transformation is not only an environmental requirement but also a
- Customer preference change: Large shippers (such as Walmart, Amazon) require supply chain carbon reduction
- Increasing regulatory pressure: EU Carbon Border Adjustment Mechanism (CBAM) will gradually cover the shipping industry
- Financing cost difference: Green ships can obtain lower financing costs
| Risk Factor | Potential Impact | Probability |
|---|---|---|
| Red Sea crisis eases, Suez Canal resumes navigation | 7-8% capacity released, freight rates drop sharply | Medium |
| Global economic growth lower than expected | Demand growth below 2% | High |
| New ship deliveries exceed expectations | Capacity growth exceeds 10% | Medium |
| Ship scrapping accelerates | Supply-demand improves, freight rates rise | Low |
- China-US trade friction: Tariff policy changes may affect trans-Pacific route demand [2]
- Trump administration’s trade policy: May impact the global trade system in 2026; experts expect “more trade turmoil” [3]
- Regional conflicts: The duration of geopolitical events such as the Red Sea crisis and Russia-Ukraine conflict is highly uncertain
The container shipping industry has
- Cycle position: Adjustment period after the 2021-2022 super cycle
- Freight rate level: SCFI index rebounded to 1656.32 points in December 2025, but still far below the 2021 high (about 5000 points) [4]
- Profitability: COSCO Shipping Holdings’ 2025 ROE was 16.14%, a significant drop from the 2021 high but still at a healthy level [0]
- High leverage risk: Some shipping companies accumulated large debts during the new ship order peak
- Cash flow pressure: Large payments are required after new ship delivery, which may affect cash flow
- Asset impairment risk: If freight rates remain low, ship assets may face impairment pressure
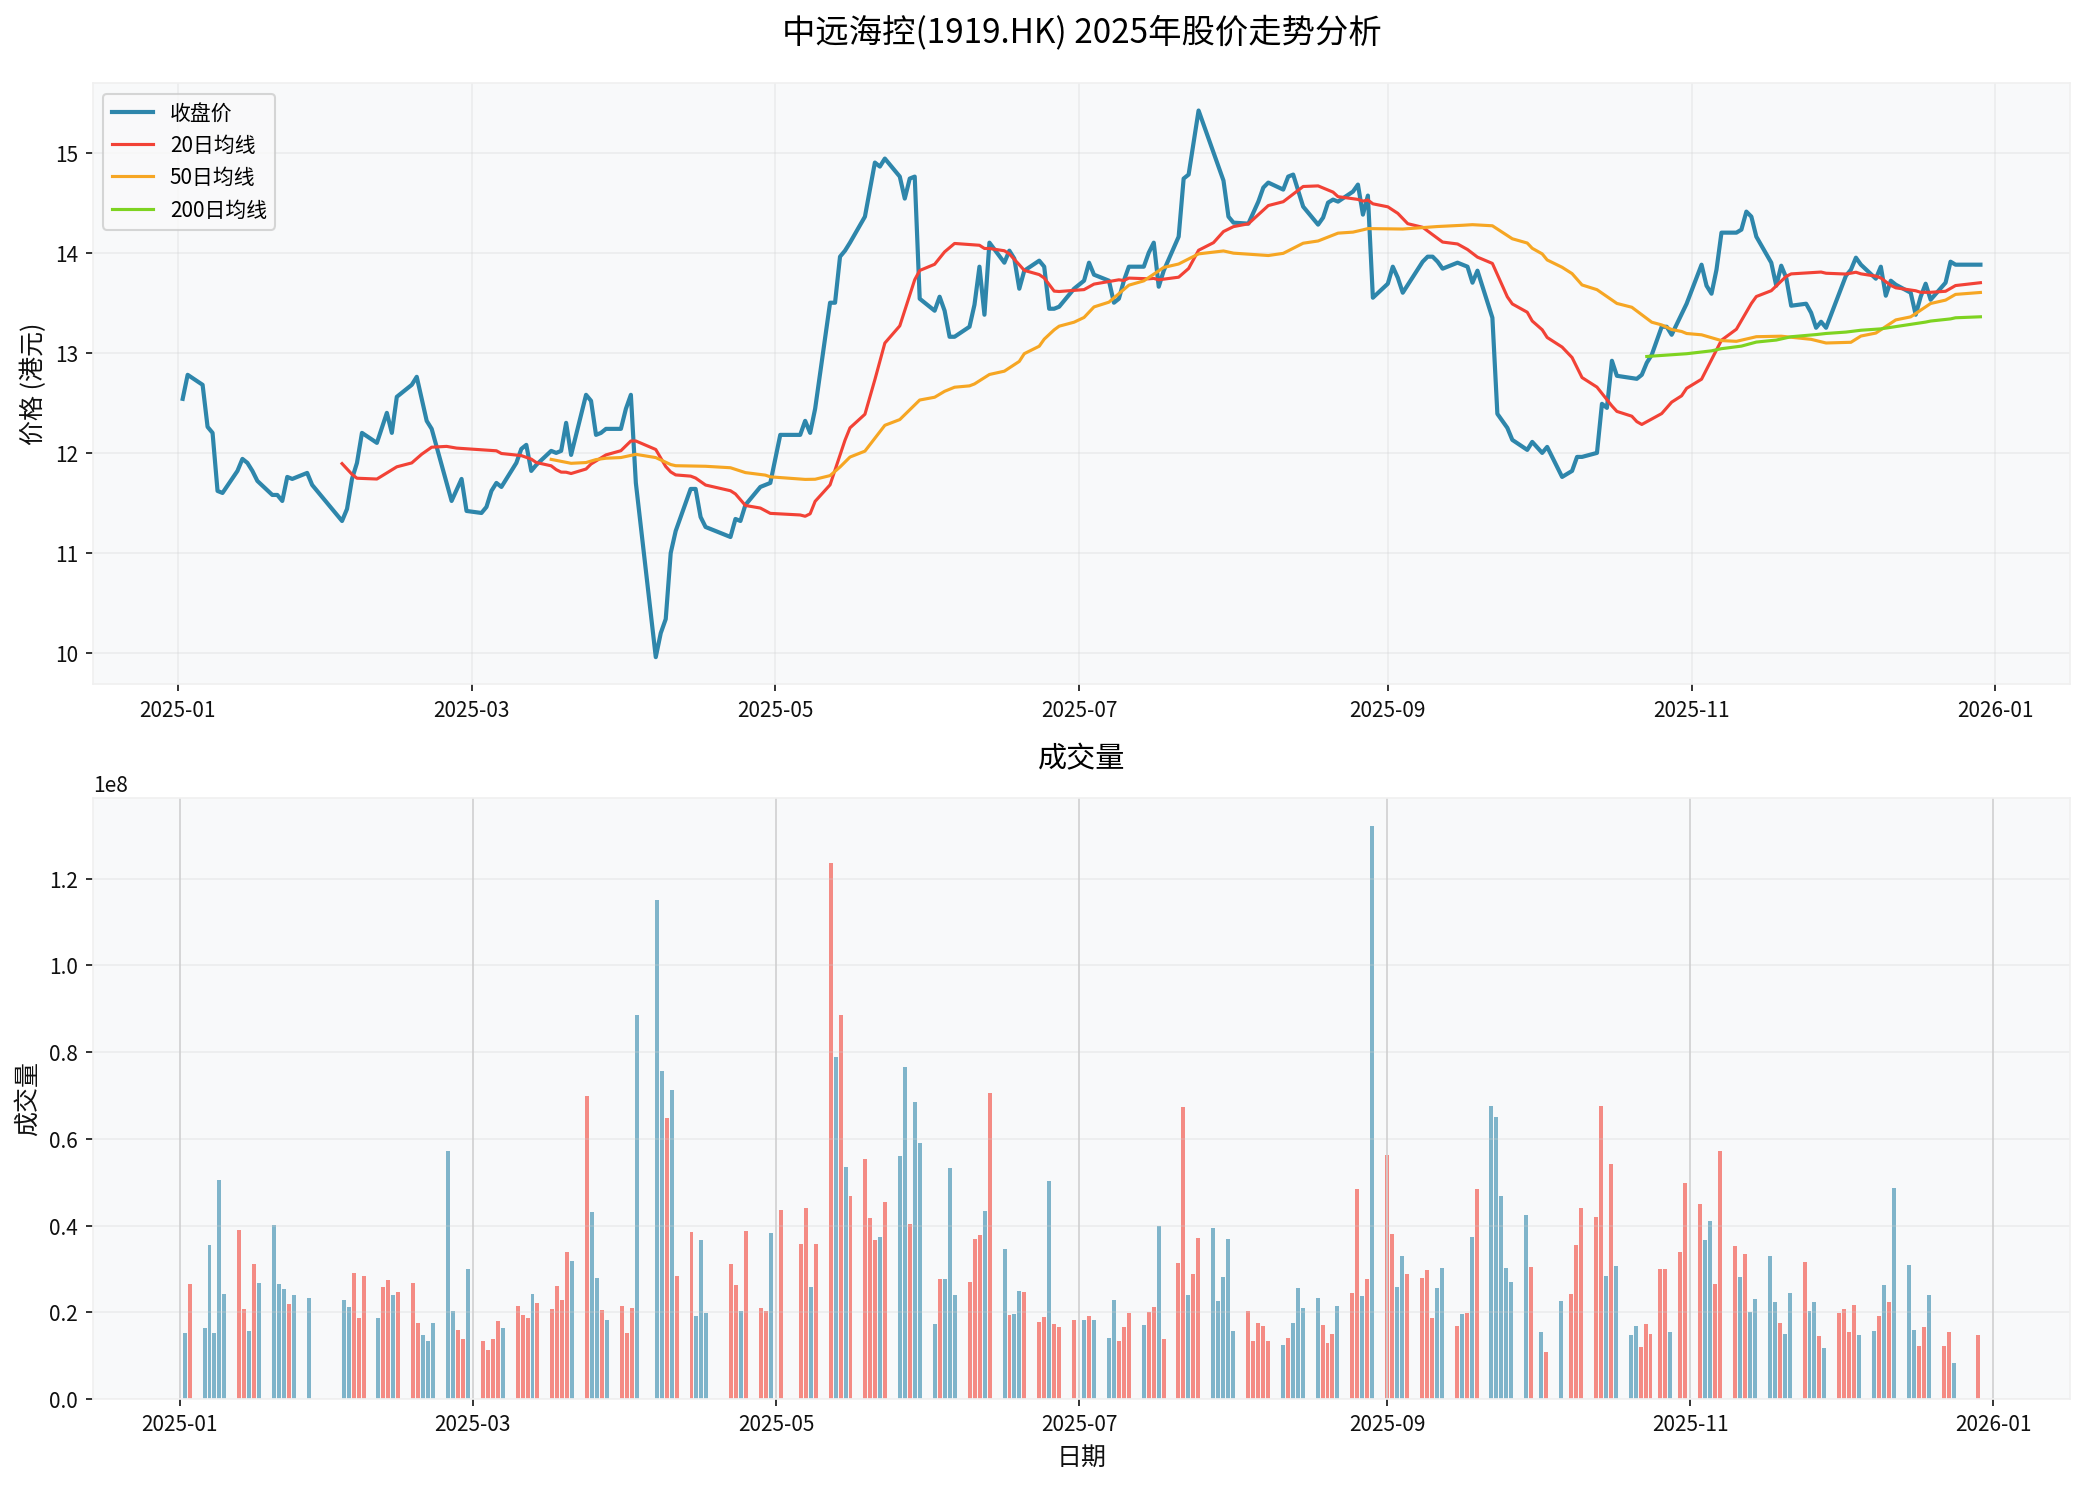
- Stock price: HK$13.91
- P/E ratio: 6.19x (far below historical average)
- P/B ratio: 1.01x (close to book value)
- ROE: 16.14% (strong profitability)
- Net profit margin: 16.78%
- Current ratio: 1.50 (financially sound)
- Current P/E is in the historical low range, reflecting market concerns about 2026 freight rate decline
- P/B close to 1.0x provides a certain margin of safety
- High ROE (16.14%) indicates strong profitability
- Risks: New ship delivery peak + demand uncertainty
- Strategy: Wait for clearer signals, focus on:
- Whether the Red Sea situation eases
- Freight rate trend after the Spring Festival
- Global economic data
- Opportunities: Effective capacity decline + demand recovery
- Strategy: Gradually build positions during market panic
- Targets:
- Industry leaders: COSCO Shipping Holdings (1919.HK), Maersk, CMA CGM
- Regional leaders: SITC International (1308.HK), Hapag-Lloyd
- Green transformation pioneers: Companies with high proportion of green ship orders
- Long-term logic:
- Supply-demand structure will improve due to scrapping peak in 2027-2028
- Green transformation will raise industry entry barriers, and concentration of leading enterprises will increase
- Geopolitics will become long-term, and route restructuring will become normal
| Evaluation Dimension | Key Indicators | Weight |
|---|---|---|
| Financial Health | Debt ratio, cash flow, interest coverage ratio | 25% |
| Profitability | ROE, net profit margin, EBITDA margin | 25% |
| Fleet Quality | Average ship age, green ship ratio, order-to-fleet ratio | 20% |
| Cost Control | Cost per TEU, fuel efficiency | 15% |
| Strategic Layout | Route diversification, port assets, logistics integration | 15% |
##7. Risk Hedging Strategies
###7.1 Portfolio Diversification
- Regional diversification: Allocate companies in different route markets (Asia-Europe, trans-Pacific, intra-regional routes)
- Scale diversification: Balance allocation of industry leaders and regional small and medium-sized shipping companies
- Industrial chain diversification: Allocate shipowners, ports, and logistics service providers simultaneously
###7.2 Dynamic Adjustment Strategy
- Freight rate monitoring: Closely follow changes in freight rate indices such as SCFI and CCFI [4]
- Order tracking: Regularly update the delivery progress of order backlogs
- Geopolitical monitoring: Track the situation in key regions such as the Red Sea and Russia-Ukraine
###7.3 Stop-Loss Discipline
- Technical stop-loss: Reduce positions when breaking key support levels (e.g., 200-day moving average)
- Fundamental stop-loss: Adjust in time when core assumptions (such as sustained Red Sea crisis) are falsified
- Time stop-loss: Set a clear holding period (e.g., 3-6 months) and re-evaluate upon expiration
##8. Core Conclusions and Action Recommendations
###8.1 Core Conclusions
-
Structural supply-demand imbalance will continue until the first half of 2026: Nominal overcapacity is 7.2%, but effective capacity actually declines by6.4%
-
An inflection point is expected in the second half of 2026: Factors such as the Red Sea crisis and environmental regulations continue to absorb capacity, and the supply-demand relationship gradually improves
-
Valuation provides a margin of safety: Industry leaders have a P/E ratio in the range of5-8x, P/B close to1.0x, and limited downside risk
-
Green transformation is a long-term investment theme: Enterprises with first-mover advantages will enjoy valuation premiums
###8.2 Action Recommendations
- Conservative investors: 0-10% position, wait for clearer signals in Q2 2026
- Balanced investors:10-20% position, build positions in batches over 6-12 months
- Aggressive investors:20-30% position, left-side layout, bear short-term volatility
- SCFI freight rate index (focus on post-Spring Festival trend)
- Red Sea situation and Suez Canal navigation status
- Actual new ship delivery volume in Q1/Q2 2026
- Global manufacturing PMI and trade data
[0] Gilin API Data - COSCO Shipping Holdings (1919.HK) financial data, stock price analysis, industry statistics
[1] Yahoo Finance - “Factbox-What are shipping companies’ plans for return to Suez Canal?” (December19,2025) - https://finance.yahoo.com/news/factbox-shipping-companies-plans-return-132220954.html
[2] Bloomberg - “Trump Tariffs, USMCA: Global Trade Poised for Rocky2026” (December24,2025) - https://www.bloomberg.com/news/articles/2025-12-24/trump-tariffs-usmca-global-trade-poised-for-rocky-2026
[3] Yahoo Finance - “Reduced demand for US retail imports to continue into2026” - https://finance.yahoo.com/news/reduced-demand-us-retail-imports-122019328.html
[4] Yahoo Finance - “SCFI four major routes freight rates rise 6-10% together,有望温和上行 before the Lunar New Year” (December29,2025) - https://hk.finance.yahoo.com/news/
[5] Wall Street Journal - “Tariff threat forces U.S. ports to rethink upgrade plans” (December6,2025) - https://cn.wsj.com/articles/tariff-threat-forces-u-s-ports-to-rethink-upgrade-plans-3c4aeee8
Insights are generated using AI models and historical data for informational purposes only. They do not constitute investment advice or recommendations. Past performance is not indicative of future results.
About us: Ginlix AI is the AI Investment Copilot powered by real data, bridging advanced AI with professional financial databases to provide verifiable, truth-based answers. Please use the chat box below to ask any financial question.