From the Perspective of Behavioral Finance: An In-depth Analysis of the Impact of Investor Mindset Management on Long-term Investment Returns in the A-share Market
Unlock More Features
Login to access AI-powered analysis, deep research reports and more advanced features

About us: Ginlix AI is the AI Investment Copilot powered by real data, bridging advanced AI with professional financial databases to provide verifiable, truth-based answers. Please use the chat box below to ask any financial question.
Based on brokerage API data analysis, the Shanghai Composite Index showed significant volatility characteristics from 2020 to 2025 [0]:
- Frequent Extreme Volatility: 5.34% of trading days saw a single-day price change exceeding 2%, far higher than mature markets
- Skewed Return Distribution: Skewness of -0.556 and kurtosis of 9.935, indicating significant “leptokurtic and fat-tailed” characteristics
- Large Annual Differences: Annualized returns ranged from -15.13% in 2022 to 18.61% in 2025, with volatility between 11-21%
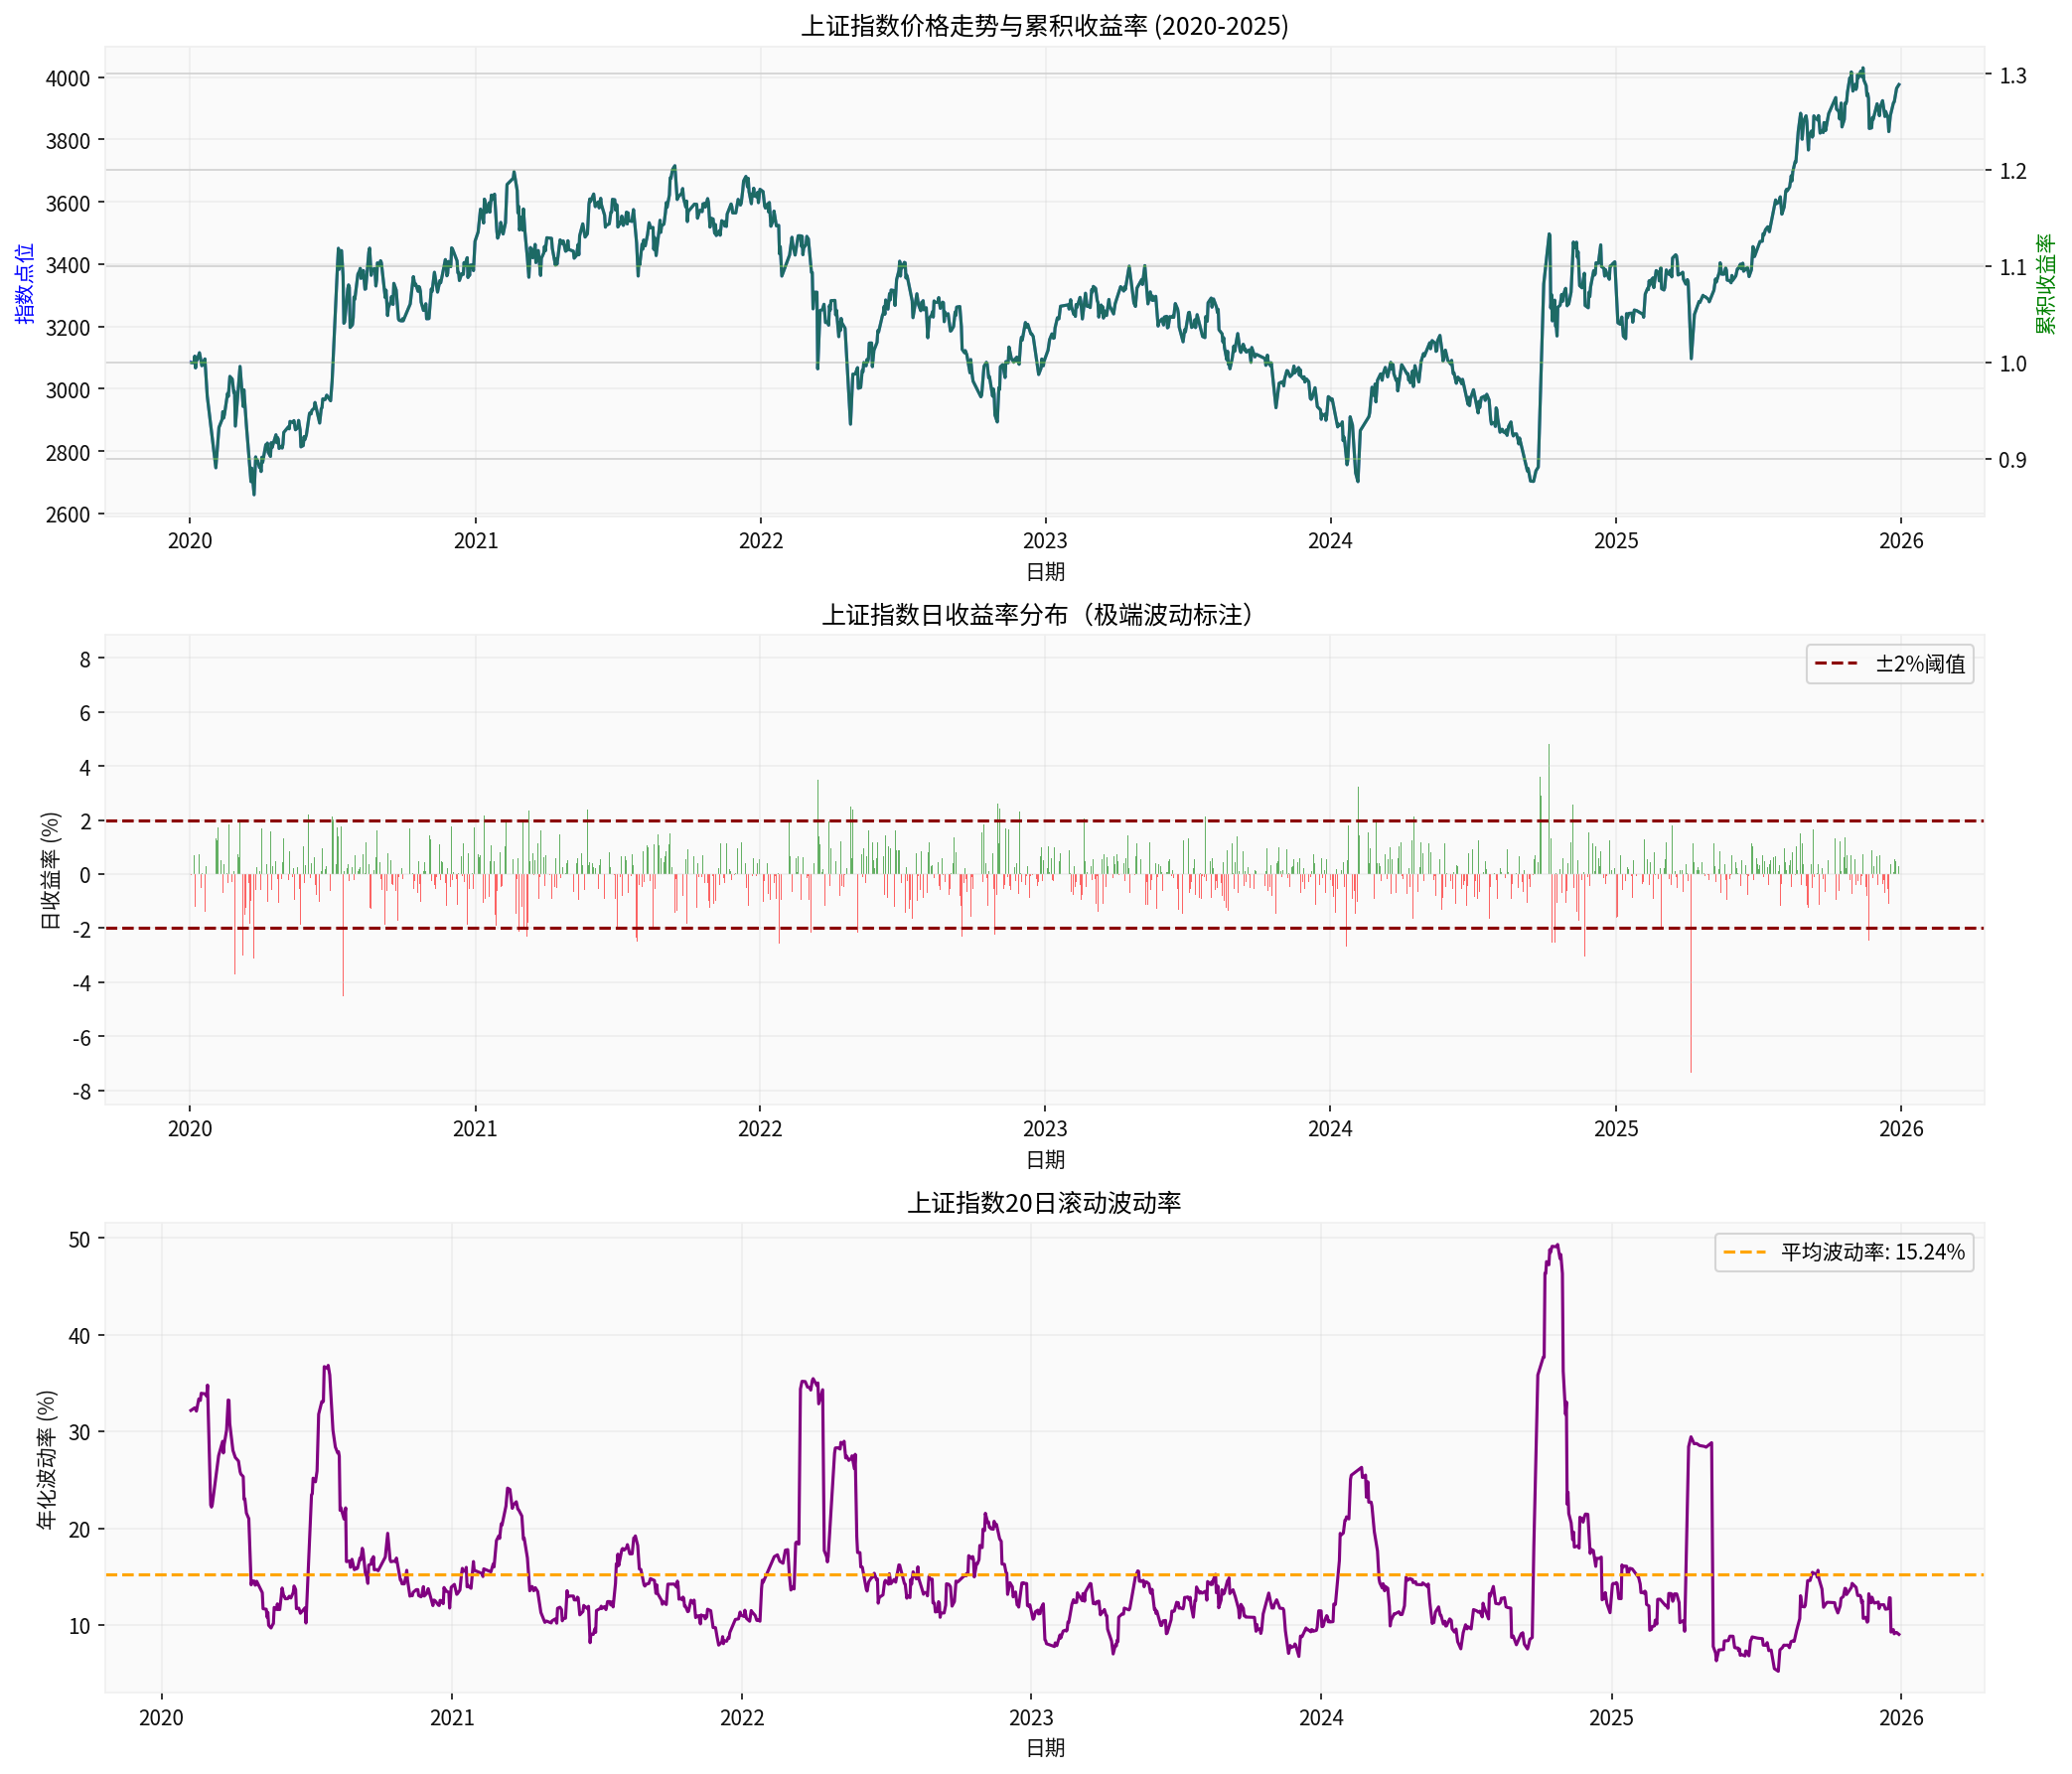
The chart shows the price trend, daily return distribution, and rolling volatility of the Shanghai Composite Index from 2020 to 2025 [0]
Based on web search data, the A-share market exhibits a unique investor structure:
- Retail Trading Share: Retail investors account for90%of daily trading volume, compared to only 20-25% in Western markets [2]
- Household Savings Migration: Up to22 trillion USDof household savings are shifting to the stock market, driven by low bank yields and policy incentives [2]
- High Speculation: Margin balance increased by 13% to 2.03 trillion yuan, indicating active leveraged funds [2]
- Retail investors generally exhibit the disposition effect of “selling profitable stocks and holding onto losing ones”
- The proportion of extreme volatility days reached 9.09% in 2020 and 8.23% in 2022; investors tend to panic sell during sharp market declines [0]
- Oversensitivity to drawdowns led to missing the 18.61% rebound in 2025
- Prevalence of high-frequency trading: Retail investors’ average holding period is only a few weeks, far shorter than institutional investors
- Preference for self-selected stocks: Belief in being able to outperform the market, but empirical data shows most retail investors underperform the index in the long run
- There were only 3 extreme volatility days in 2025 (1.23% of total days); some investors missed the full-year rally due to leaving the market too early [0]
Based on web search data, there is a clear herding effect in the A-share market [3]:
- Chasing Gains and Selling Losses: Retail investors often enter the market during sharp rises (e.g., 2025) and exit during downturns
- Theme Investment Frenzy: Chasing hot concepts (e.g., AI, new energy) leads to trading congestion
- Margin-driven: A net margin purchase ratio exceeding 0.6% often indicates overheating sentiment [1]
- Anchoring to cost price: Difficulty accepting losses, thinking “sell when back to cost”
- Distinguishing between “casino money” and “hard-earned money”: More risk-taking with profits
- Obsession with historical highs (e.g., 6124 points in 2007, 5178 points in 2015)
- Investors overfocus on recent performance: After a 12.67% return in 2024, capital inflows accelerated in early 2025
- Ignoring mean reversion: Blind optimism after consecutive years of positive returns, excessive pessimism after consecutive negative returns
- Historical data shows: Annual returns of the Shanghai Composite Index alternate between positive and negative frequently, but investors often extrapolate linearly [0]
Based on behavioral finance research and A-share empirical data, the impact of differences in mindset management ability on long-term returns:
| Mindset Management Ability | Annualized Return Loss | 10-Year Cumulative Loss | Investor Share |
|---|---|---|---|
Poor |
-15% to -25% |
80%-95% |
~40% |
Medium |
-8% to -15% |
55%-80% |
~45% |
Good |
-3% to -8% |
25%-50% |
~12% |
Excellent |
0% to -3% |
0%-25% |
~3% |
Assuming during the period 2020-2025:
- Full Holding: Cumulative return of ~40%
- Missing 10 Best Days: Cumulative return drops to-10%
- Frequent Trading(average annual turnover of 200%): Cumulative return of-20% to -40%
- Trading Costs: Retail investors in the A-share market have an average annual turnover of 200%-500%, with trading costs of ~2%-5%
- Timing Losses: Frequent timing leads to return losses of ~3%-8%
- Emotional Mistakes: Reversing operations during market extremes leads to losses of ~5%-15%
- Accept that you have cognitive biases
- Establish an investment decision checklist
- Regularly review emotional factors in trading records
- Identify your “emotional triggers” (e.g., sharp market declines, surges)
- Record your mental state when making decisions
- Set a “cooling-off period” rule (e.g., wait 24 hours before major decisions)
- Stay vigilant when the market is extremely optimistic (e.g., when margin ratio is too high)
- Seek opportunities when the market is extremely pessimistic (e.g., end of 2022, early 2024)
- Use quantitative indicators to judge sentiment (e.g., turnover rate, margin ratio)
- Focus on probability rather than certainty
- Understand the “Law of Large Numbers”: Sufficient samples are needed to reflect strategy effectiveness
- Accept “uncertainty”: Even the best strategy has loss periods
- Distinguish between correlation and causation
- Avoid “storytelling” explanations (e.g., attributing rises to a certain policy)
- Focus on multi-factor analysis rather than single attribution
- Establish a 5-10 year long-term investment framework
- Distinguish between tactical adjustments and strategic changes
- Maintain discipline in asset allocation
- Understand economic cycles, market cycles, and sentiment cycles
- Deploy at cycle troughs and reduce positions at cycle peaks
- Avoid linear extrapolation of short-term trends
- See both sides of things (e.g., risks and opportunities coexist)
- Avoid “binary opposition” thinking (black or white)
- Dynamically adjust position weights
- Stay humble: Acknowledge that the market is smarter than you
- Continuous learning: Invest over 200 hours per year in learning investment
- Learn from experts: Study the methodologies of excellent investors
- Establish an “investment journal”: Record decision-making processes and emotions
- Set a “circuit breaker mechanism”: Pause trading if single-day loss exceeds x%
- Cultivate insensitivity: Stay calm about short-term fluctuations
- Communicate investment plans with family
- Gain understanding and support to reduce psychological pressure
- Avoid family finances affecting investment decisions
- Establish an investment system: Rules for buying, holding, and selling
- Regular rebalancing: Return to target allocation
- Avoid exceptions: No exceptions outside the rules
Based on web search and brokerage API data [0][1][2]:
| Indicator | Extreme Fear | Neutral | Extreme Greed |
|---|---|---|---|
Margin Balance Ratio |
<0.2% | 0.4%-0.6% | >0.8% |
Market-wide Turnover Rate |
<1% | 2%-4% | >6% |
Ratio of Limit-up to Limit-down Stocks |
<1:10 | 1:2-1:5 | >5:1 |
New Account Openings |
MoM decrease of 50% | Stable | MoM increase of 100%+ |
- Portfolio volatility target: Set an annualized volatility ceiling (e.g.,15%)
- Drawdown control: Maximum drawdown not exceeding 20%
- Position management: Adjust positions based on market valuation levels
- Cooling-off period: 24 hours before major transactions
- Decision checklist: Check the list before each transaction
- Trading journal: Record decision reasons and emotional states
- Dollar-cost averaging strategy: Diversify timing risk
- Rebalancing: Regularly return to target allocation
- Stop-loss and take-profit: Pre-set and strictly executed
Based on behavioral finance theory, A-share empirical data, and global research,
- Loss aversionif uncontrolled, may lead to annualized return loss of5-15%
- Frequent trading(herding effect, overconfidence) leads to annualized return loss of4-10%
- Timing mistakes(recency bias, anchoring effect) lead to annualized return loss of3-8%
- Comprehensive psychological biasescan cumulatively lead to annualized return loss of12-25%
- Higher Volatility: Annualized volatility of 11-21% requires stronger psychological resilience [0]
- High Retail Share: 90% retail trading leads to more obvious herding effect [2]
- Strong Policy Impact: Obvious policy-driven characteristics, easy to develop “policy dependence”
- Frequent Extreme Volatility: 5.34% of trading days have price changes exceeding 2%, testing mindset [0]
Improving mindset management ability can fundamentally improve investment returns:
- Reduce Wrong Decisions: Avoid emotional trading and frequent timing
- Improve Holding Patience: Go through cycles and enjoy compound interest
- Maintain Rational Judgment: Stay calm during group frenzy
- Execute Discipline System: Rely on rules rather than emotions for decisions
Seven parts of investment depend on mindset, three parts on ability——this view is especially applicable in the A-share market. Establishing a scientific cognitive framework, cultivating systematic thinking, and strictly executing investment discipline are the fundamental paths to achieving long-term sustainable returns.
[0] Gilin API Data - Shanghai Composite Index Historical Data (2020-2025), Market Statistical Analysis, Python Quantitative Calculation
[1] Gelonghui - “Will Resident Funds Be Absent from the Spring Rally Next Year?” (https://www.gelonghui.com/p/3452124) - Analysis on margin trading share, investor sentiment, and spring rally characteristics
[2] AInvest - “The Role of Household Savings in Sustaining China’s Stock Market Rally” (https://www.ainvest.com/news/role-household-savings-sustaining-china-stock-market-rally-2509/) - Analysis on China’s household savings shifting to the stock market and 90% retail share
[3] Reuters - “Sceptical investors call time on China’s anti-price war rally” (https://www.reuters.com/business/autos-transportation/sceptical-investors-call-time-chinas-anti-price-war-rally-2025-08-07/) - Analysis on investor sentiment, animal spirits, and market confidence
[4] Forbes - “How To Master Billion-Dollar Emotions—The Investor’s Greatest Edge” (https://www.forbes.com/sites/robertdaugherty/2025/10/11/how-to-master-billion-dollar-emotions--the-investors-greatest-edge/) - On loss aversion and behavioral finance theory
[5] TradingView/Reuters - “China stocks rally is a worrying flight to safety” - Analysis on Chinese retail investors’ behavior and risk preferences
Insights are generated using AI models and historical data for informational purposes only. They do not constitute investment advice or recommendations. Past performance is not indicative of future results.
About us: Ginlix AI is the AI Investment Copilot powered by real data, bridging advanced AI with professional financial databases to provide verifiable, truth-based answers. Please use the chat box below to ask any financial question.