Dumbbell Strategy Construction & Operation Framework for High Uncertainty Environments
Unlock More Features
Login to access AI-powered analysis, deep research reports and more advanced features
About us: Ginlix AI is the AI Investment Copilot powered by real data, bridging advanced AI with professional financial databases to provide verifiable, truth-based answers. Please use the chat box below to ask any financial question.
Abstract: This reply provides a feasible “dumbbell strategy” construction and operation framework, focusing on risk budgeting and drawdown management in high-uncertainty environments, and offers suggestions for configuration and decision-making mechanisms to improve the Sharpe ratio. The content is a methodological and process guide, not investment advice.
Key Points
- Objectives and Constraints: Pursue a Sharpe ratio >1.0 in high-uncertainty environments, requiring simultaneous control of drawdowns and volatility; suggest target drawdown ≤10%-15% (set based on account constraints), annualized volatility ≤12%-15%, then calculate Sharpe ratio combined with expected returns.
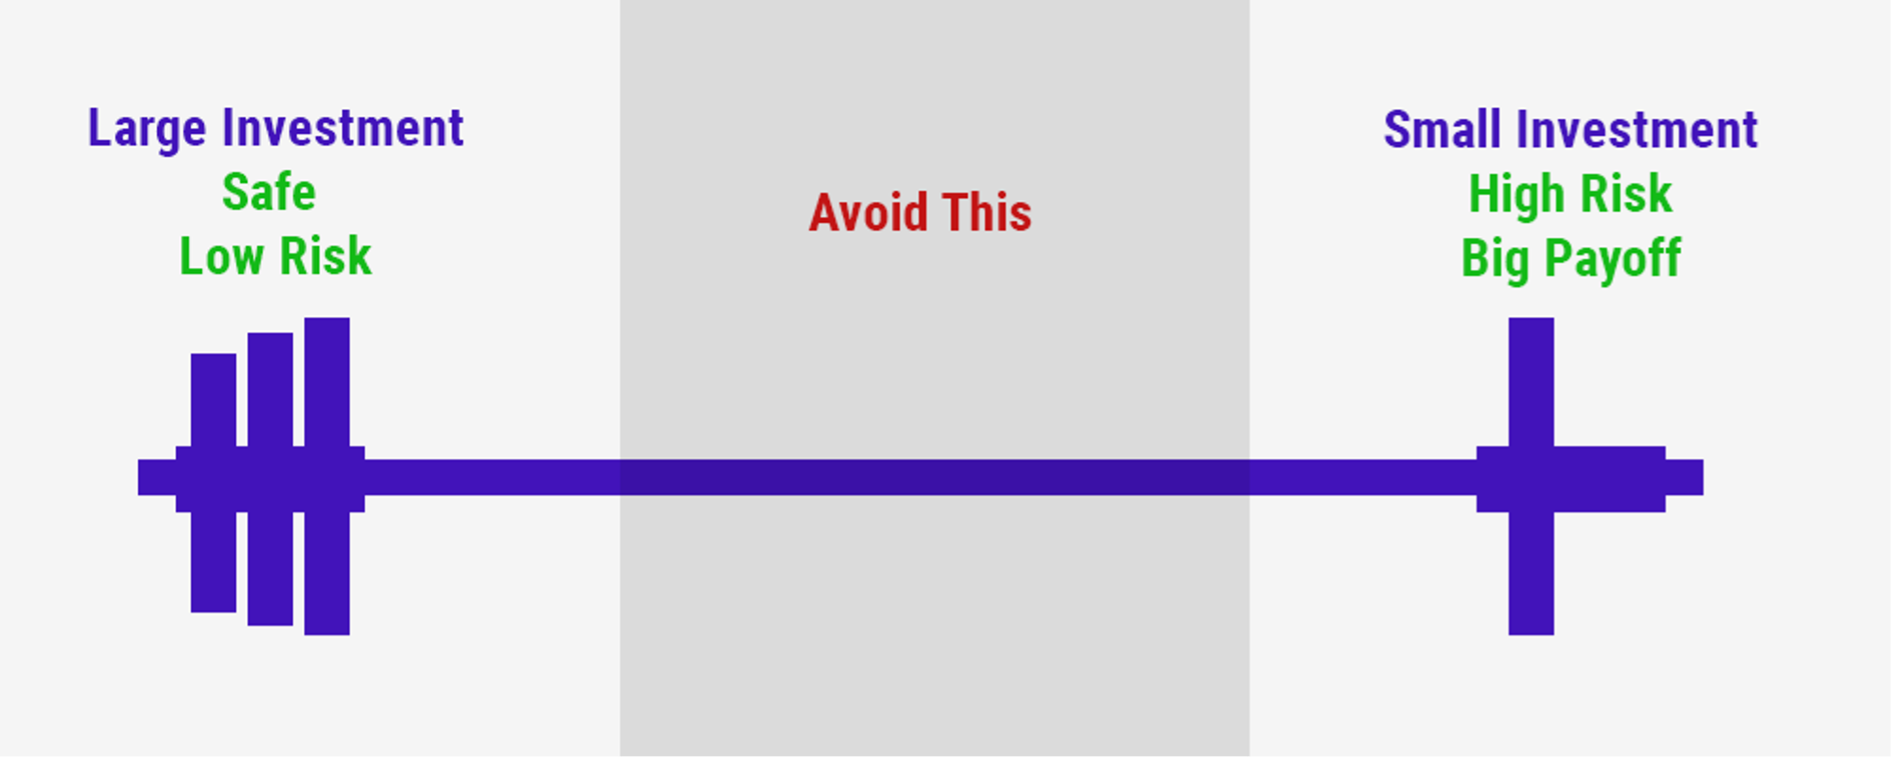
- Dumbbell Structure: One end is high-certainty defense (high dividend, quality factor, essential consumption/utilities, hedging exposure, etc.), the other end is high-odds asymmetric opportunities (growth and option-based expressions). Both ends make independent decisions, with dynamic weights and stop-losses, no position overlap.
- System-Driven: 10% stock selection/target choice,40% betting and capital management,50% psychology and discipline execution; three pillars form a closed loop (configuration—execution—review).
Construction and Operation Framework
- Risk Budgeting and Target Anchoring
- Clarify objectives: Maximum acceptable drawdown (e.g., ≤12%-15%), Sharpe target (>1.0), volatility upper limit (annualized ≤12%-15%).
- Reverse-calculate risk budget: Set risk limits for individual groups (defense/offense) and portfolio level using VaR/ES, group stop-losses, volatility budgeting, etc.
- Align long-term and short-term objectives: Combine quarterly reviews with annual Sharpe ratio to avoid chasing short-term volatility and disrupting long-term risk-return structure.
- Portfolio Structure Design and Characteristics of Both Ends
- Defense end (40%-60% proportion, adjusted based on macro and risk status):
- Prioritize high-dividend, stable ROE, low financial leverage, and abundant cash flow assets.
- Add quality/low volatility factors to reduce idiosyncratic volatility.
- Hedging tools: Option protection, volatility products, currency and interest rate hedging (based on investable domain and regulations).
- Rebalancing and cash flow: Reinvest dividends, dynamically adjust positions to maintain defensive attributes.
- Offense end (20%-40% proportion, adjusted based on market and liquidity):
- Focus on high odds and asymmetry (small sample, high growth, theme and event-driven).
- Clear take-profit and stop-loss, position scaling up in stages (validation/confirmation/expansion phases).
- Risk exposure upper limit: Single asset ≤2%-5% of portfolio, single theme ≤10%-15% of portfolio.
- Liquidity premium: Prioritize high-liquidity assets and tools that allow quick stop-losses.
- Position Size and Portfolio-Level Risk Control
- Kelly and Half-Kelly:
- Estimation based on historical win rate/odds (conservative estimation, downside risk amplified).
- Use half-Kelly or 1/4-Kelly to control overfitting and extreme losses.
- Group Stop-Losses:
- Defense end: Valuation/fundamental deviation triggers position reduction or hedging.
- Offense end: Hard stop-loss (e.g., -10% to -15%) and time stop-loss (validation period expires without fulfillment).
- Correlation Constraints:
- Monitor and diversify correlations within the offense end and between both ends to avoid systemic exposure to the same factor.
- Risk Exposure Budgeting:
- Set limits on industry, style, factor, region, etc., to avoid concentrated exposure.
- Moderate anti-fragility: Add a small number of negatively or lowly correlated assets to smooth portfolio volatility.
- Rebalancing and Scenario Management
- Rebalancing Triggers:
- Time trigger: Monthly/quarterly fixed window, combined with intraday/weekly monitoring.
- Deviation trigger: Weight deviates from preset range (e.g., ±5 percentage points), or volatility/drawdown breaks threshold.
- Macro/liquidity shift: Adjust dumbbell ratio during regime switch.
- Scenario Plans:
- Extreme hedging plans for scenarios like inflation/interest rate rise, credit cycle, geopolitics, liquidity shock, etc.
- Dynamically adjust defense end and hedging exposure; reduce offense end to lower limit if necessary.
- Decision and Execution (10/40/50 Rule Implementation)
- 10% Target Selection:
- Top-down (macro/industry/scenario) + bottom-up (fundamental/valuation/cash flow/governance).
- Establish standardized screening and ranking library to reduce noise and randomness.
- 40% Betting and Capital Management:
- Single order and position building path in stages (observation/first position building/addition/reduction).
- Dynamically adjust win rate/odds parameters to form closed-loop updates.
- Real-time monitoring of volatility and drawdown at the account level.
-50% Psychology and Execution: - Behavior checklist: Pre-event plan/post-event review/deviation log.
- Mandatory cooling-off and review: Enter cooling-off period after consecutive losses/large profits/losses, double review.
- External constraints: Authorization boundaries, risk control countersignature, and automatic trigger of take-profit and stop-loss.
- Data and Model Support (Optional Depth Enhancement)
- Backtesting and Scenario Simulation:
- Backtest the return/drawdown/Sharpe ratio of the dumbbell portfolio in historical cycles and extreme scenarios.
- Cross-validation and parameter sensitivity test (rebalancing frequency, stop-loss threshold, weight boundary).
- Factor and Attribution:
- Factor exposure (dividend, quality, growth, momentum, low volatility) and Brinson style + industry attribution.
- Distinguish Alpha sources (stock selection/timing/factor exposure) and Beta components to provide basis for optimization.
- Quantitative Portfolio Optimization:
- Under risk budget and target Sharpe constraints, solve for optimal weights of both ends via mean-variance/risk parity/multi-objective optimization.
- Add turnover and transaction cost constraints.
- Indicator Dashboard and Check List
- Performance and Risk:
- Sharpe ratio (>1.0), drawdown (≤12%-15%), volatility (annualized ≤12%-15%), maximum consecutive loss count, win rate/profit-loss ratio.
- VaR/ES (1-day/1-week/1-month), downside capture ratio, upside participation rate.
- Structure and Exposure:
- Defense/offense end weight and configuration deviation.
- Industry/style/factor/region exposure deviation.
- Hedging cost and efficiency.
- Process and Behavior:
- Rebalancing execution completion rate, take-profit/stop-loss trigger and execution rate.
- Deviation log and review completion rate, external compliance and risk control checks.
- Check Questions:
- Is it within the risk budget? Are both ends independent? Are rebalancing and stop-loss triggered?
- Is any single exposure exceeding the threshold? Are correlation and liquidity controllable?
- Does it match the account fund term and liquidity requirements?
Tools and Implementation Path (Optional)
- Data and Backtesting: Professional APIs and Python code can be used for historical backtesting and scenario analysis, combined with visualization to evaluate portfolio performance.
- Factor and Attribution: Use style and industry attribution tools to locate Alpha/Beta sources and optimize factor exposure.
- Real-time Monitoring: Use market and portfolio-level monitoring tools to track exposure and stop-loss/rebalancing trigger conditions.
Reference and Tips
- Risk Note: This content is a methodological and process guide, not investment advice or performance commitment. Actual construction requires careful evaluation combined with account constraints, compliance restrictions, liquidity requirements, and personal risk preferences.
- Knowledge Source: This reply is based on common practices of classic risk budgeting, dumbbell portfolio, and behavioral finance, and integrated with the “10/40/50 Rule” framework (no external network or news sources cited).
Follow-up Executable Directions
- If needed, I can use Python to conduct historical backtesting and scenario analysis based on your investable domain and account constraints, compare Sharpe ratio and drawdown performance under different rebalancing frequencies and stop-loss thresholds, and generate a visualization dashboard.
- Alternatively, conduct attribution diagnosis based on existing positions and provide a gradual optimization plan for dumbbell transformation and risk control parameters. All above are optional deepening paths.
Insights are generated using AI models and historical data for informational purposes only. They do not constitute investment advice or recommendations. Past performance is not indicative of future results.
About us: Ginlix AI is the AI Investment Copilot powered by real data, bridging advanced AI with professional financial databases to provide verifiable, truth-based answers. Please use the chat box below to ask any financial question.