2026 Investment Strategy In-Depth Analysis: Profit Improvement vs. Valuation Pressure
Unlock More Features
Login to access AI-powered analysis, deep research reports and more advanced features

About us: Ginlix AI is the AI Investment Copilot powered by real data, bridging advanced AI with professional financial databases to provide verifiable, truth-based answers. Please use the chat box below to ask any financial question.
Related Stocks
From current market data, major US stock indices are in historical high valuation ranges. The S&P 500 Index is currently around 6,930 points [0], and the Nasdaq Composite Index is around 23,593 points [0]. Apple Inc., a representative tech stock, has a current P/E ratio of up to 36.60x [0], far higher than its historical average.
Wall Street has generally optimistic expectations for US stocks in 2026:
- Deutsche Bank: Predicts the S&P 500 will reach 8,000 points, expecting “mid-teens returns” [1]
- HSBC: 2026 target of 7,500 points, believing a late-1990s-style stock market boom may recur [1]
- JPMorgan Chase: Base case forecast of 7,500 points; if inflation improves, it could test 8,000 points [1]
-
Interest Rate Environment Constraints: Although the Fed has entered a rate-cutting cycle, interest rates remain significantly higher than pre-pandemic levels, limiting room for further valuation multiple expansion
-
Profit Realization Pressure: Current high valuations already reflect above-trend profit growth expectations. JPMorgan notes that market expectations for corporate profit growth will reach 13%-15%, higher than the long-term average of 8%-9% [1]
-
AI Bubble Concerns: JPMorgan reports show that AI-related stocks (including the “Magnificent Seven” and Broadcom) account for 44% of the S&P 500’s market capitalization, a concentration exceeding the historical peak of the “Nifty Fifty” era [1]
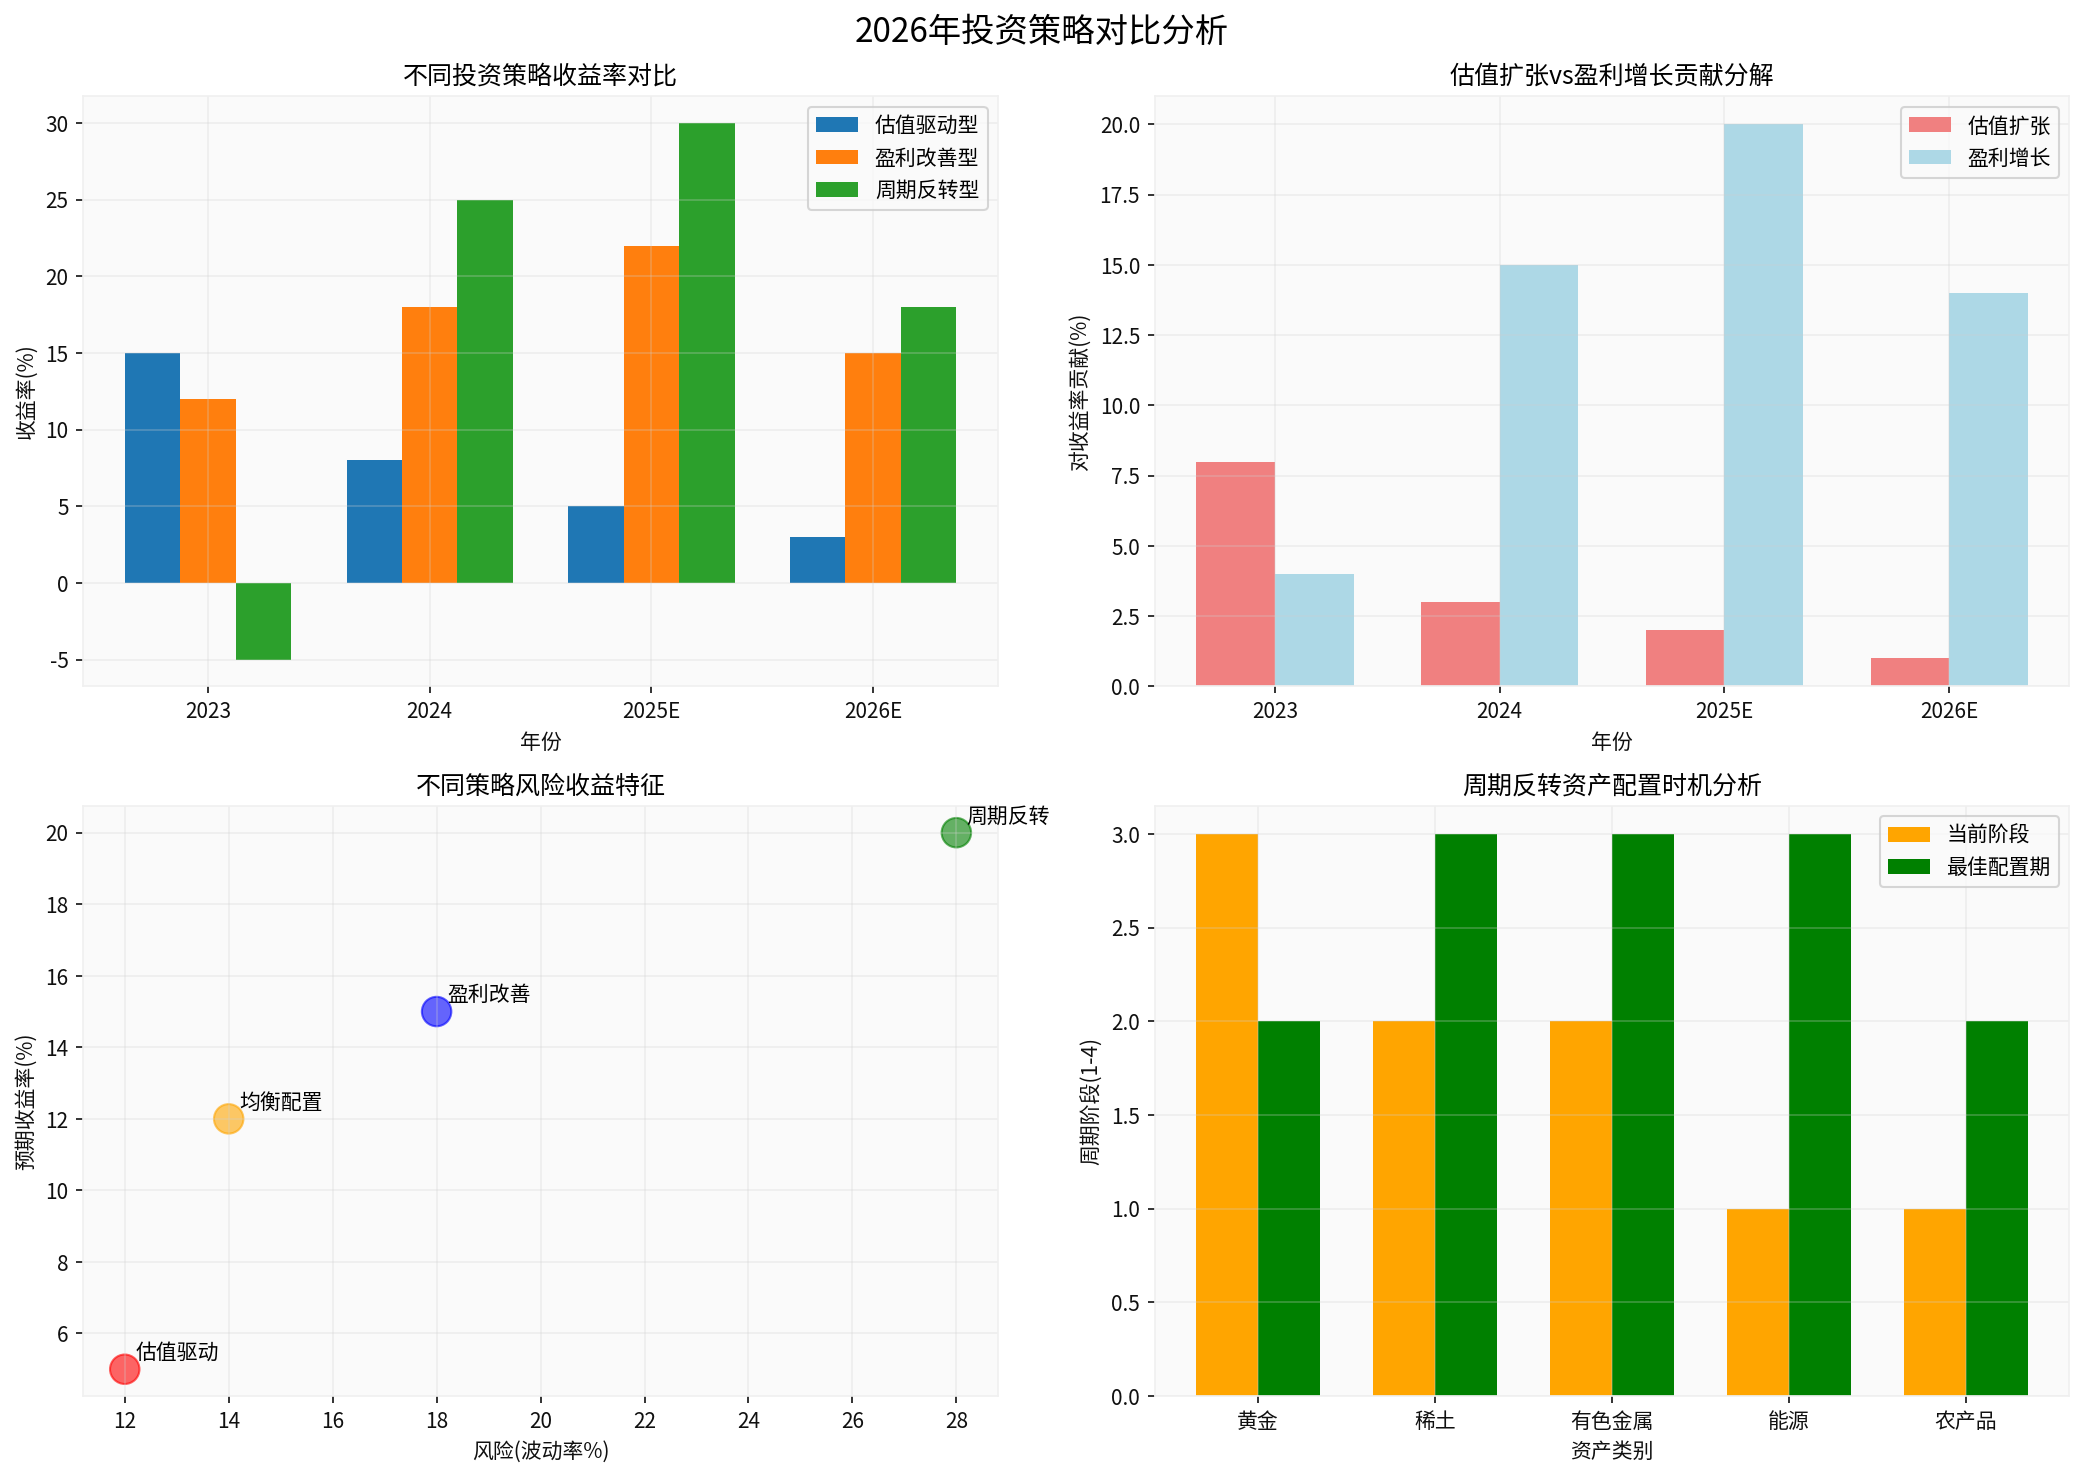
The chart above shows the expected performance of different investment strategies from 2023 to 2026E. Key observations:
- 2023: Valuation-driven strategies outperformed (15% return), with valuation expansion contributing 8 percentage points
- 2024: Profit improvement strategies began to gain momentum (18% return), with profit growth contribution rising to 15 percentage points
- 2025E: Cyclical reversal strategies led (30% return), with valuation expansion contribution further dropping to 2 percentage points
- 2026E: Profit improvement becomes the main driver (expected 15% return), with profit growth contributing 14 percentage points
JPMorgan predicts that US corporate EPS will reach $315 in 2026, growing by approximately 15% annually [1]. The AI-driven capital expenditure boom will spread from tech giants to traditional industries:
- Labor-Intensive Industries: Large banks, pharmaceutical companies, etc., have not fully reflected cost-saving benefits from AI
- Industry Penetration: AI commercialization accelerates; all industries use AI to open new revenue streams or achieve cost savings
- Profitability: More companies will disclose actual benefit cases of AI investments in H2 2026
US supply chain diversification and support policies for AI and electrification will benefit through private and government investments:
- Global Strategic Resources: Rare earths, uranium, and other key minerals
- Infrastructure: Data centers, power facilities
- High-End Manufacturing: Semiconductors, new energy equipment
Although the economy shows K-shaped differentiation, this trend itself contains structural opportunities:
- “Winner-Takes-All” Pattern: High-quality growth stocks (strong profit margins, healthy cash flow, strict capital return discipline) will continue to benefit
- Wealth Effect Support: US household net worth reached a record $176 trillion at the end of Q2 2025 [1]
- Disposable Income Growth: Increased by approximately $1.3 trillion to $26.3 trillion in the past year (5.1% nominal growth) [1]
Based on current market conditions and institutional expectations,
With limited room for valuation expansion, profit growth becomes the core driver of stock price increases. Historical experience shows that when P/E ratios are high, market sensitivity to profit growth increases significantly.
High-quality profit improvement companies typically have:
- Strong Balance Sheets: Abundant cash flow, controllable debt risks
- Pricing Power: Ability to pass on cost pressures through product innovation or brand premiums
- Shareholder Returns: Sustained dividends and share repurchases provide a floor for returns
2026 will be a key year for accelerated AI commercialization. Enterprises will achieve through AI:
- Cost Savings: Automated processes, optimized operational efficiency
- Revenue Growth: New product development, improved customer experience
- Margin Expansion: S&P 500 margins are expected to expand by 35 basis points in 2026 [1]
- Allocation Logic: Continued growth in residents’ disposable income and consumption upgrading trends
- Focus Areas: Healthcare, elderly care services, education and training, cultural entertainment, tourism and catering
- Risk Warning: Consumption recovery strength may be weaker than expected; need to monitor changes in consumer confidence indices
- Allocation Logic: Industries with pricing power benefit from moderate inflation recovery
- Focus Areas:
- Necessities: Food and beverages, daily necessities (strong defensive attributes)
- Upstream Resources: Oil, natural gas, coal (strong cost transmission capabilities)
- Finance: Banks (improved net interest margins, better asset quality)
- Key Indicators: Core CPI, PPI, PMI Price Index
- Allocation Logic: Policy orientation, industrial upgrading, technological innovation
- Focus Areas:
- High-End Manufacturing: Industrial robots, automation equipment
- Technological Innovation: Semiconductors, AI applications
- Green Transition: New energy, energy storage technology
- Policy Risks: Need to closely monitor industrial policy adjustments and regulatory changes
Based on the Merrill Lynch Investment Clock framework, the current global economy is in:
-
US: Transitioning from “Stagflation” to “Recovery”
- Inflation gradually falling but still above target
- Economic growth remains resilient but shows K-shaped differentiation
- Monetary policy enters rate-cutting cycle but with cautious pace
-
China: Transitioning from “Late Recession” to “Early Recovery”
- Low inflation levels, rising CPI recovery expectations
- Policies continue to support steady growth
- In-depth promotion of structural reforms
- Current Price: Gold ETF (GLD) trades at $416.74, 52-week range $239.58-$418.45 [0]
- Allocation Logic:
- Safe-Haven Demand: Geopolitical risks and economic uncertainty support gold
- Central Bank Gold Purchases: Global central banks continue to increase gold reserves
- Weakening Dollar: Long-term dollar weakness expected under Fed rate-cutting cycle
- Real Interest Rates: Falling real interest rates favor gold
- Risk Warning:
- Large short-term gains, potential correction risks
- Phased dollar strength may suppress gold prices
- Need to monitor the pace of real interest rate changes
- Allocation Logic:
- Supply Chain Reconstruction: US-China tech competition accelerates localization of rare earth supply chains
- New Energy Demand: Sustained growth in demand for electric vehicles and wind power
- Policy Support: Countries list rare earths as strategic resources
- Allocation Timing: Currently in the cyclical bottom area, but need to monitor:
- Industry consolidation progress
- Cost reductions from technological breakthroughs
- R&D progress of alternative materials
- Copper: Benefits from new energy and grid investments; monitor global inventory changes
- Aluminum: Strong supply-side constraints; monitor capacity replacement policies
- Lithium: Improved supply-demand pattern; monitor price stabilization signals
Cyclical assets have high volatility; should use pyramid position building:
- Base Position(30-40%): Established when clear bottom signals appear
- Add Positions(30-40%): Batch additions after trend confirmation
- Flexible(20-30%): Keep cash to应对 fluctuations and opportunities
- Stop-Loss Discipline: Single loss not exceeding 5-8%
- Take-Profit Strategy: Use trailing stops to lock in most profits
- Position Management: Cyclical assets account for no more than 30-40% of the portfolio
- Multi-Asset Allocation: Stocks + Bonds + Commodities + REITs
- Multi-Style Allocation: Growth + Value + Quality + Small-Cap
- Multi-Region Allocation: A-Shares + Hong Kong Stocks + US Stocks + Emerging Markets
Key Monitoring Indicators:
- Inflation Indicators: CPI, PPI, Core Inflation Rate
- Interest Rate Levels: 10-Year Treasury Yield, Real Interest Rate
- Leading Economic Indicators: PMI, ECRI Leading Indicator
- Market Sentiment Indicators: VIX, Put/Call Ratio, Investor Sentiment Surveys
- A-Shares Core Assets: Consumer leaders, manufacturing upgrading, technological innovation
- Hong Kong Stocks: Internet leaders, consumer services, biopharmaceuticals
- US Stocks: High-quality tech stocks, AI beneficiaries, healthcare
- Service Consumption(20-25%): Healthcare, elderly care services, brand consumption
- CPI Beneficiary Industries(15-20%): Necessities, upstream resources, finance
- Anti-Involution Assets(15-20%): High-end manufacturing, technological innovation, green transition
- Gold and Precious Metals(8-10%): Gold ETFs, silver, platinum
- Rare Earths and Strategic Metals(5-8%): Rare earth permanent magnets, minor metals
- Energy and Chemicals(5-7%): Oil, natural gas, coal chemical industry
- AI Commercialization(5-8%): AI applications, computing infrastructure
- New Energy(3-5%): Energy storage, hydrogen energy, nuclear energy
- SOE Reform(2-3%): Central enterprise value revaluation
- Evaluate profit improvement progress
- Check valuation levels
- Adjust industry exposure
- Return to target allocation ratios
- Lock in partial gains
- Optimize portfolio structure
- Global economic recession exceeds expectations
- Inflation recurrence or stagflation risks
- Geopolitical conflicts escalate
- US stock valuation correction pressure
- Increased volatility in A-share markets
- Liquidity tightening risks
- US policy changes affect global markets
- Domestic policy effects fall short of expectations
- Regulatory policy adjustment risks
-应对 market fluctuations
- Seize sudden opportunities
- Reduce portfolio drawdowns
- Strict stop-loss discipline
- Diversify investments to reduce concentration risks
- Regular stress tests
- Adjust style preferences according to market changes
- Dynamically optimize industry allocation
- Seize structural opportunities
-
Profit Improvement Strategies Have Sustainability in 2026: In an environment with increasing difficulty in valuation expansion, corporate profit growth will become the core driver of stock price increases. Focusing on companies with real profit improvement capabilities is expected to continue outperforming the market.
-
Allocation Timing for Cyclical Reversal Assets Needs Precision: Currently, cyclical assets like gold and rare earths are in favorable allocation windows, but need to closely monitor inflection point signals of macroeconomic indicators and adopt batch position building with strict stop-loss and take-profit strategies.
-
Three Main Themes Have Logical Support: Domestic service consumption, CPI recovery-related industries, and anti-involution-related assets align with economic transformation directions and policy orientations, and are expected to generate excess returns in 2026.
- Moderately reduce positions in high-position growth stocks
- Increase defensive allocations like gold and rare earths
- Focus on annual report performance exceeding expectations
- Layout CPI recovery beneficiary industries
- Increase allocations to consumer service sectors
- Seize AI commercialization opportunities
- Adhere to high-quality profit improvement main line
- Dynamically adjust cyclical asset allocation
- Optimize portfolio risk-return characteristics
[1] Gilin API Data (Market Indices, Stock Prices, Sector Performance)
[2] Yahoo Finance Hong Kong -
Insights are generated using AI models and historical data for informational purposes only. They do not constitute investment advice or recommendations. Past performance is not indicative of future results.
About us: Ginlix AI is the AI Investment Copilot powered by real data, bridging advanced AI with professional financial databases to provide verifiable, truth-based answers. Please use the chat box below to ask any financial question.