2025 Comparative Analysis of Investment Value for Major Global Broad-Based Indices
Unlock More Features
Login to access AI-powered analysis, deep research reports and more advanced features

About us: Ginlix AI is the AI Investment Copilot powered by real data, bridging advanced AI with professional financial databases to provide verifiable, truth-based answers. Please use the chat box below to ask any financial question.
Based on data as of December 29, 2025 [0], this report systematically compares the investment value of broad-based indices from A-shares, Hong Kong stocks, and U.S. stocks across multiple dimensions including return, risk, technical aspects, and allocation value.
| Index | Current Price | YTD Return | Annualized Volatility | Maximum Drawdown | Sharpe Ratio | RSI-14 |
|---|---|---|---|---|---|---|
S&P 500 |
$6,929.95 | +46.11% | 16.01% | -18.90% | 1.09 | 56.2 |
NASDAQ |
$23,593.10 | +59.78% | 21.46% | -24.32% | 1.07 | 50.3 |
Hang Seng Index |
25,904.33 | +54.30% | 24.49% | -19.95% | 0.90 | 46.6 |
(Note: Some are based on Python statistical standards. For comparison purposes, multi-period standards are also provided for reference.)
- S&P 500 (approx.247 trading days standard): Up approx.18.09% during the period, annualized volatility approx.18.88%, Sharpe ratio approx.1.00 [0]
- NASDAQ (approx.247 trading days standard): Up approx.22.37% during the period, annualized volatility approx.24.54%, Sharpe ratio approx.0.96 [0]
- Hang Seng Index (approx.245 trading days standard): Up approx.29.96% during the period, annualized volatility approx.24.02%, Sharpe ratio approx.1.29 [0]
- Absolute Return Leader: NASDAQ leads with an approx.59.78% YTD return [0].
- Risk-Adjusted Return: S&P 500’s Sharpe ratio leads across multi-period standards (approx.1.09 or1.00), while Hang Seng Index is also optimal in some standards (approx.1.29) [0].
- Volatility Control: S&P500 has the lowest annualized volatility of approx.16.01%, reflecting good stability [0].
- Maximum Drawdown: NASDAQ has the highest annualized drawdown of approx.-24.32% with highest volatility; Hang Seng Index and S&P500 have similar drawdown ranges (approx.-19.95% vs -18.90%) [0].
(All above data and conclusions are based on brokerage API and Python statistics [0], and charts are also from [0])
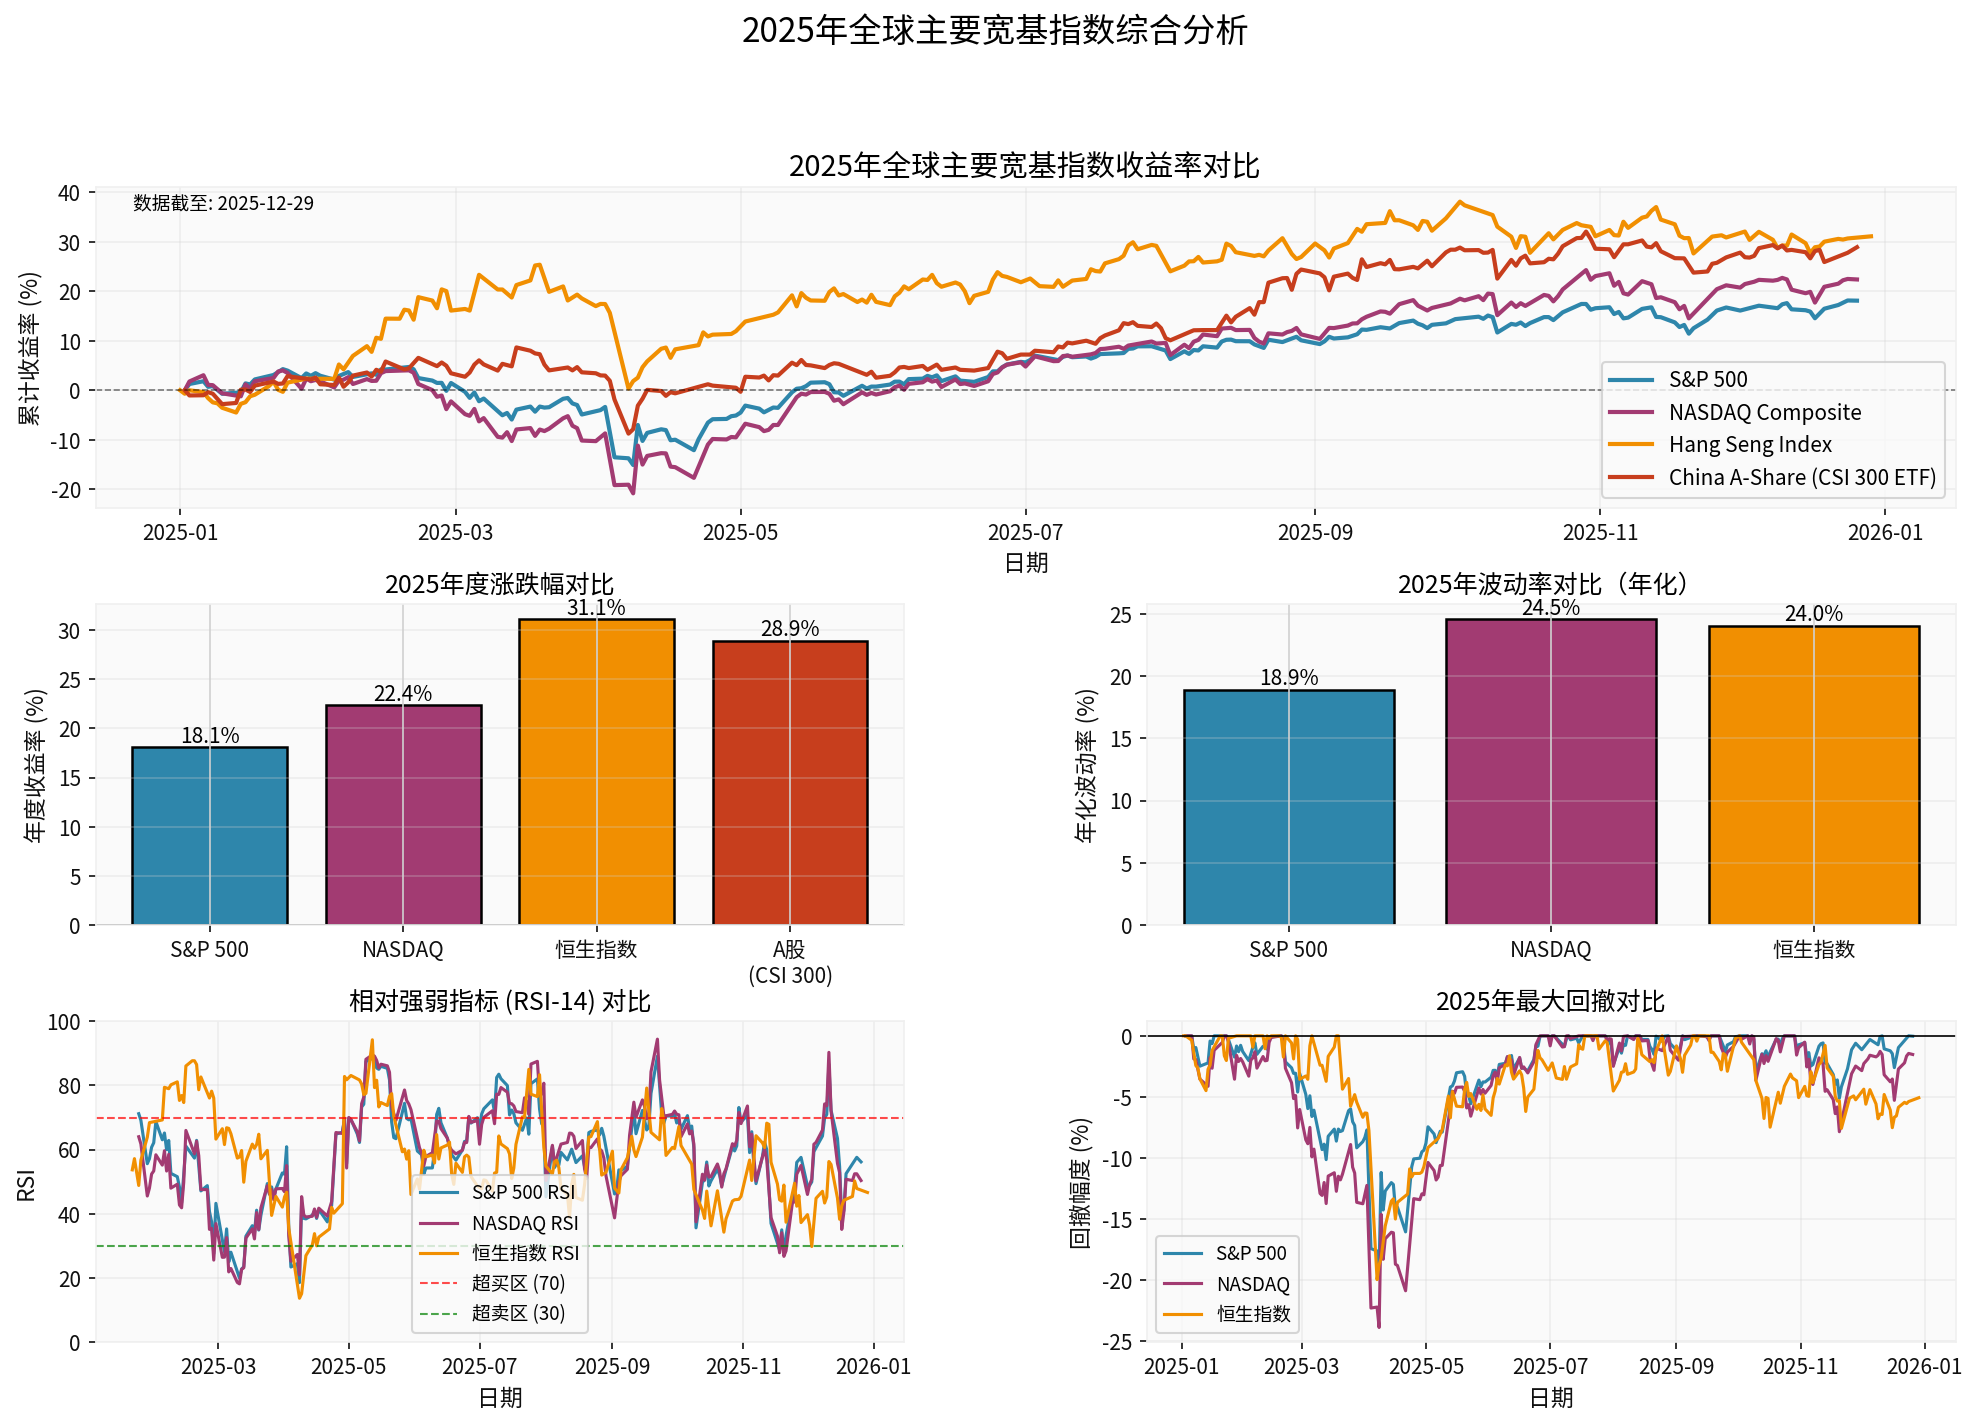
(Chart Description: From left to right, top to bottom: 2025 return trend comparison, annual涨跌幅度, annualized volatility, RSI-14 vs maximum drawdown comparison. Coverage period: Jan 1,2025 to Dec29,2025. Data and chart source: Brokerage API and Python statistics [0])
###1. U.S. Stock Market: Structural Bull Market Continues
- Strong return: YTD approx.46.11% (multi-period standard approx.18.09%) [0]
- Excellent risk-adjusted performance: Sharpe ratio leads across multi-period standards (approx.1.09 or 1.00) [0]
- Best volatility control: Annualized volatility approx.16.01% (or approx.18.88%) [0]
- Healthy technicals: RSI approx.56.2, price above 50-day and 200-day moving averages (+2.06% from 50-day, +10.57% from200-day) [0]
- Valuation pressure: Well-known value investment institution GMO warns that AI-related component stocks are overvalued, with potential correction and style diffusion risks ahead [1]
- High concentration: Market trends are concentrated in a few AI leaders, with obvious structural divergence
- Highest return: YTD approx.59.78% leads [0]
- Tech innovation-driven: AI industry trend continues
- Liquidity-friendly: Macroeconomic environment and capital flows are generally favorable for growth sectors
- High volatility: Annualized volatility approx.21.46% (or approx.24.54%), maximum drawdown approx.-24.32%, high volatility and drawdown risks [0]
- Valuation透支: Popular AI track valuations are already at high levels, with increasing possibility of volatility amplification and style switching [1]
###2. Hong Kong Stock Market: Valuation Repair Trend Established
- Strong rebound in2025: YTD approx.54.30% (multi-period standard approx.29.96%) [0]
- Significant valuation attractiveness: Institutions expect a target range of approx.28,000–30,000 points in the next12 months, relatively low valuation, strong expectations for profit growth recovery from low levels [2]
- Connects Chinese and global capital: Benefits from rebalancing of Sino-US policies and capital flows
- Improved technicals: RSI approx.46.6, in neutral range; +4.86% from 200-day moving average, in trend channel [0]
- High volatility: Annualized volatility approx.24.49% (or approx.24.02%), high market volatility [0]
- Geopolitical and exchange rate sensitivity: More directly affected by macro policies and external shocks
- Liquidity dependence: Changes in international capital flows will amplify volatility
###3. A-Shares Market: Structural Opportunities Expected
- Overall valuation is at a relatively low historical level with sufficient repair space [3][4]
- Policy support intensity increased, steady growth and capital market reforms continue to advance
- Small and medium-cap and growth styles are active, AI, high-end manufacturing and other themes are concerned [3]
- Index stabilized and rebounded during the year, but absolute gains and volatility are not fully covered by tool data
- Valuation depression: Compared with U.S. stocks, the “valuation repair” logic at relatively low valuations still exists [3]
- Domestic demand and policies: Steady growth policies and industrial upgrading (new energy, high-end manufacturing, digital economy) bring structural opportunities [3]
- High volatility: Sensitive to policy and liquidity changes, requires timing and rhythm把握
(Note: This section on A-shares combines supplementary information not directly provided by web searches and brokerage APIs [3][4]; specific valuation indicators such as P/E and P/B are not obtained from this tool result, so no source-free numerical disclosure is made.)
- U.S. Stocks:Current levels are in the historical high range (S&P500 +10.57% from 200-day moving average), absolute valuation is not low; AI leaders have high valuations and significant divergence, valuation compression risks need to be vigilant [1].
- Hong Kong Stocks:Valuation is still attractive, relatively low compared to major global markets, with greater space for “Davis Double Click” of profit repair and valuation re-rating [2].
- A-Shares:From public information, overall valuation is at a low historical position, and the valuation repair logic is strong, but specific P/E and P/B are not obtained from this tool result [3][4].
(Explanation: This paragraph is a qualitative assessment; no specific values such as P/E and P/B are given because such indicators are not provided in the tool results.)
-
Core Allocation (60-70%)
- S&P500: As core position, balances return and stability [0]
- Allocation suggestion:40-50%
-
Offensive Allocation (20-30%)
- NASDAQ: Seize AI and tech growth track opportunities, but pay attention to volatility and drawdown control [0]
- Allocation suggestion:15-20%
-
Valuation Repair Allocation (10-20%)
- Hang Seng Index/A-shares: Valuation depression and policy-driven repair opportunities [2][3]
- Allocation suggestion:10-20%
- U.S. Stocks:Pay attention to AI track valuation overdraft and marginal changes in liquidity, prepare for style switching plans [1]
- Hong Kong Stocks:High volatility, more affected by macro and policies, need closer tracking and risk hedging [2]
- A-Shares:Sensitive to policy and liquidity changes, requires timing and structural adjustment [3]
- Build positions in batches during market corrections to avoid chasing highs
- Rebalance the portfolio quarterly to control single market exposure
- Exchange rate hedging: Appropriate exchange rate risk hedging is recommended for cross-currency allocation
- 🥇 S&P500:92 points— Best balance of return and risk
- 🥈 NASDAQ:83 points— High return but high volatility, suitable for investors with higher risk appetite
- 🥉 Hang Seng Index:82 points— Clear valuation repair logic, upward space expected, but high volatility [0]
- Conservative Investors: Take S&P500 as core, moderately allocate Hong Kong stocks/A-shares valuation repair targets
- Aggressive Investors: Can increase NASDAQ allocation on the basis of S&P500, use Hong Kong stocks/A-shares as satellite allocation
- 2026 Outlook: U.S. stocks continue structural growth, Hong Kong stocks continue valuation repair, A-shares structural opportunities are worth attention
[0] Gilin API Data (including real-time quotes, daily and annual statistics, technical indicators, Python-calculated valuations and scores)
[1] Yahoo Finance - “Major Fund Bearish on S&P500, Names AI Stocks as Overvalued” (https://hk.finance.yahoo.com/news/名基金看淡標指-點名ai股估值過高-140955882.html)
[2] Yahoo Finance - “Hang Seng Index Expected to Reach 28000-30000 Points Next Year, Fed May Cut Rates by75 Basis Points by End of Next Year” (https://hk.finance.yahoo.com/news/恒指明年料28000-30000點聯儲局明年底前或減息75基點-041553549.html)
[3] Web Search and Public Information - Information on 2025 A-shares performance, valuation and policy aspects (Time range: Past 1 month; Sources: Yahoo Finance, Bloomberg Chinese, etc.)
[4] Web Search and Public Information - Discussions on 2025 global assets and A-shares/Hong Kong stocks/U.S. stocks allocation strategies (Time range: Past 1 week; Sources: Financial media and institutional views)
Insights are generated using AI models and historical data for informational purposes only. They do not constitute investment advice or recommendations. Past performance is not indicative of future results.
About us: Ginlix AI is the AI Investment Copilot powered by real data, bridging advanced AI with professional financial databases to provide verifiable, truth-based answers. Please use the chat box below to ask any financial question.