High Tight Flag Pattern Analysis: Trading Strategies and Technical Implementation
Unlock More Features
Login to access AI-powered analysis, deep research reports and more advanced features
About us: Ginlix AI is the AI Investment Copilot powered by real data, bridging advanced AI with professional financial databases to provide verifiable, truth-based answers. Please use the chat box below to ask any financial question.
Related Stocks
This analysis examines the High Tight Flag (HTF) pattern based on the Reddit inquiry from November 9, 2025, seeking efficient methods to identify these patterns across forex and penny stocks. The HTF represents one of the most bullish chart patterns in technical analysis, characterized by an initial sharp price increase of at least 100% within 8 weeks, followed by a brief consolidation phase of 5 days to 3 weeks with minimal pullback [1][3].
The pattern’s rarity contributes to its reliability - strict criteria including no more than 25% pullback during consolidation and low trading volume during the flag phase filter out false signals [3]. Recent 2025 market data shows successful HTF formations in momentum stocks like MicroStrategy (MSTR), which consolidated with only 11% price difference and low volume before continuing its upward trajectory [7].
The HTF pattern shows significantly higher occurrence rates in stock markets compared to forex markets due to the requirement for substantial 80-100% gains over short periods [5]. While the poster mentioned forex applications, traditional HTF patterns are less common in currency pairs due to different volatility characteristics. However, bull and bear flag patterns (HTF variations) remain widely used and profitable in forex trading when properly adapted [4].
For automated screening, Thinkorswim offers custom scan scripts with specific HTF criteria including:
- Price change over 60 bars of at least 50%
- ATR limitations for tighter stop locations
- Volume moderation conditions
- Moving average alignments [2]
Additionally, specialized tools like Deepvue screener and ChartMill’s technical analysis features provide pre-built HTF identification capabilities [3][7].
The pattern reflects strong market psychology where intense bullish demand (the pole) is followed by unwillingness by sellers to part with shares despite substantial profits (the flag) [1]. This creates conditions where subsequent breakouts often trigger FOMO among traders, further fueling upward momentum. Current 2025 market conditions have shown several successful HTF examples, particularly in technology and momentum sectors [1].
- Pattern Rarity: The strict criteria mean fewer trading opportunities, potentially leading to extended waiting periods [7]
- False Breakouts: While less common due to pattern selectivity, false breakouts can result in substantial losses
- High Volatility: The requirement for large price movements inherently involves higher volatility and risk [7]
- Automated Screening: Implementation of Thinkorswim scripts can significantly reduce pre-market planning time through automated pattern identification [2]
- Momentum Stock Focus: Technology and momentum stocks have shown higher HTF formation rates in 2025 [1]
- Volume Confirmation: Breakouts above flag resistance on increased volume provide high-probability entry points [7]
Recent successful HTF patterns in 2025 include:
- MicroStrategy (MSTR): 40% gain leading into earnings with tight 11% consolidation [7]
- Historical precedent: Qualcomm (QCOM) doubled in just four weeks after forming a textbook HTF in 1999 [1]
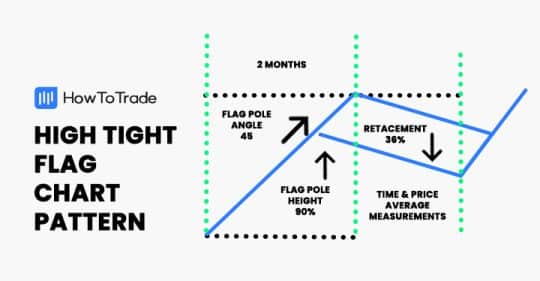
- Flag Pole: 90% height at approximately 45-degree angle [6]
- Consolidation: 5 days to 3 weeks with maximum 25% pullback [3]
- Volume: Decreased during flag phase, increased on breakout [7]
- Breakout: Price moves above upper boundary on increased volume [7]
- Entry: Breakout above flag resistance with volume confirmation [7]
- Stop Loss: Typically placed below flag’s lower boundary
- Price Target: Measured by adding flag pole height to breakout point
- Risk Management: ATR-based positioning for tighter stop locations [2]
- Thinkorswim: Custom scan scripts available through useThinkScript community [2]
- Deepvue: Specialized HTF screener with 6-point identification system [3]
- ChartMill: Technical analysis tools with HTF pattern recognition [7]
The analysis reveals that while HTF patterns offer significant profit potential, their application to penny stocks and forex markets requires adaptation of traditional criteria. Traders should focus on established momentum stocks for the most reliable HTF opportunities while implementing proper risk management protocols.
Insights are generated using AI models and historical data for informational purposes only. They do not constitute investment advice or recommendations. Past performance is not indicative of future results.
About us: Ginlix AI is the AI Investment Copilot powered by real data, bridging advanced AI with professional financial databases to provide verifiable, truth-based answers. Please use the chat box below to ask any financial question.