Comprehensive Impact and Risk Assessment of China's Growing Influence on the Iron Ore Market for Mining Giants
Unlock More Features
Login to access AI-powered analysis, deep research reports and more advanced features
About us: Ginlix AI is the AI Investment Copilot powered by real data, bridging advanced AI with professional financial databases to provide verifiable, truth-based answers. Please use the chat box below to ask any financial question.
Related Stocks
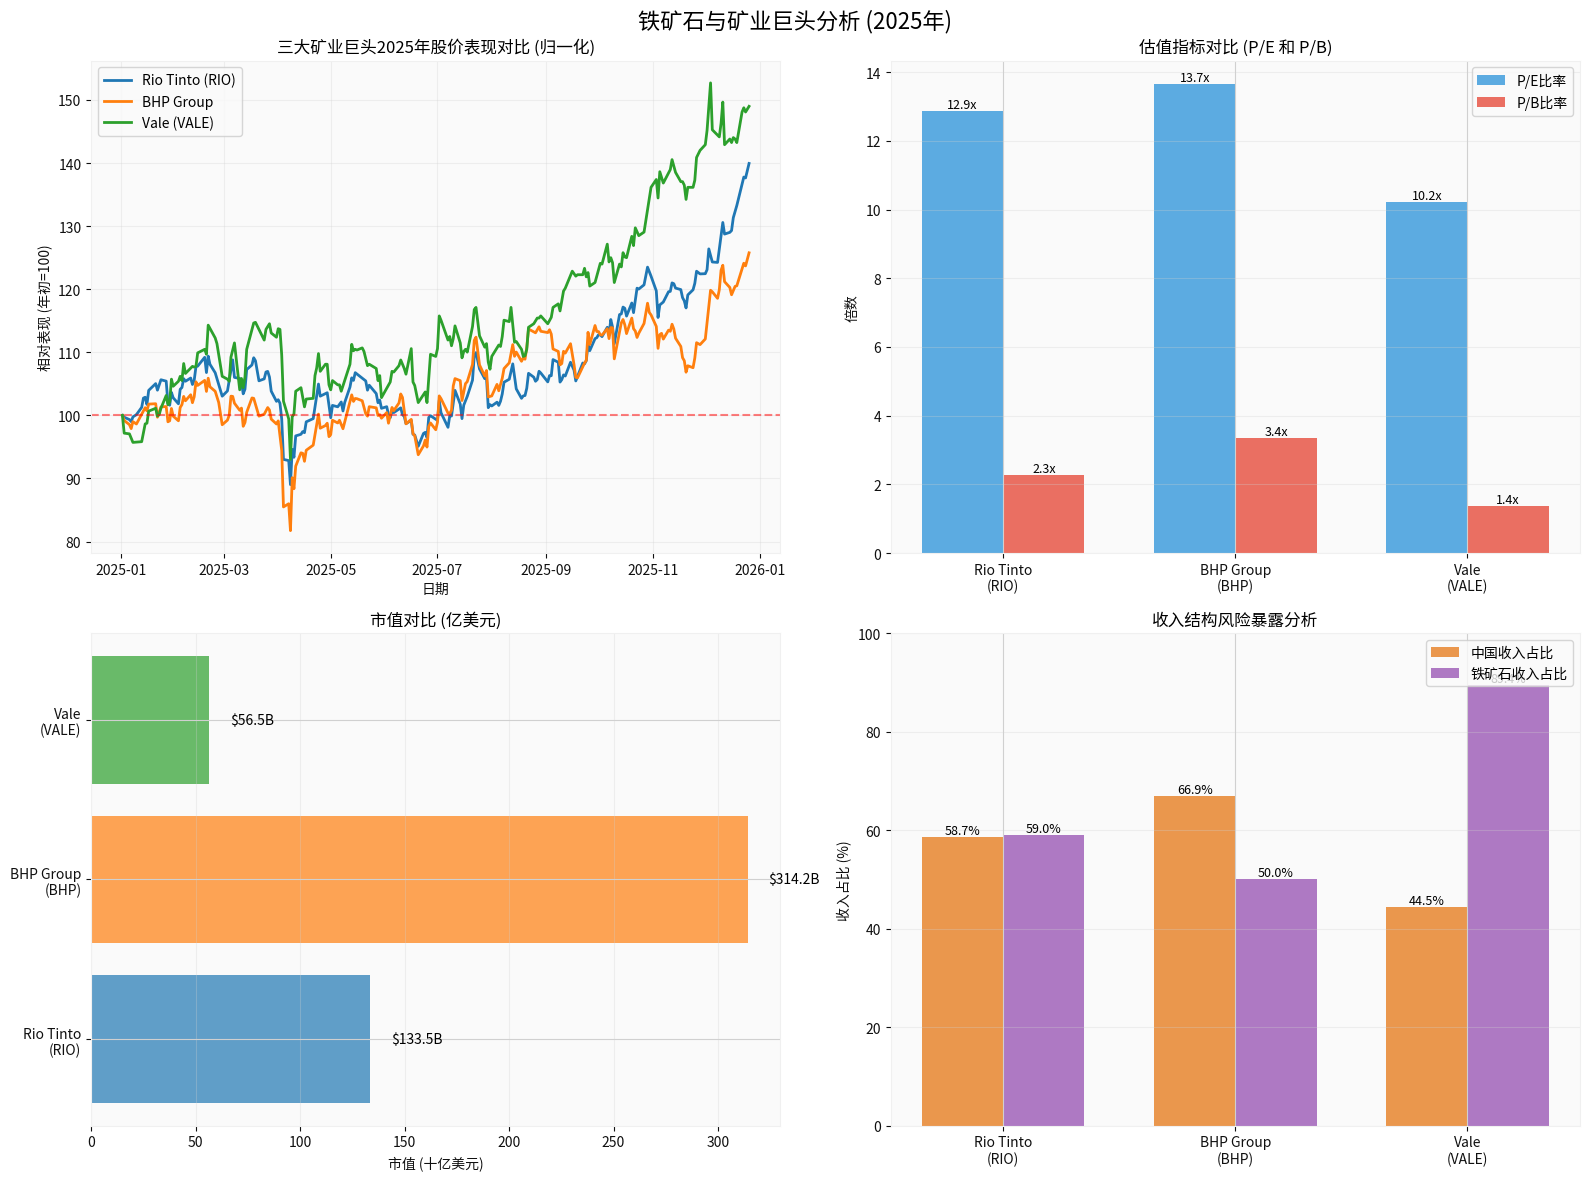
Based on the latest brokerage API data, RIO, BHP, and VALE show significant differences in scale, valuation, and revenue structure (see comprehensive chart analysis):
- Market Cap: BHP (≈ $314.16 billion) > RIO (≈ $133.53 billion) > VALE (≈ $56.48 billion) [0]
- Valuation: VALE P/E≈10.23x, P/B≈1.37x; RIO P/E≈12.86x, P/B≈2.27x; BHP P/E≈13.66x, P/B≈3.36x [0]
- 2025 YTD Stock Performance: VALE≈+49%, RIO≈+40%, BHP≈+26% [0]
- China Revenue Dependence: BHP’s China revenue accounts for ~66.9%, RIO ~58.7%, VALE ~44.5% (based on regional revenue data of each company) [0]
- Iron Ore Business Concentration: VALE’s iron ore revenue accounts for ~89.4%, RIO ~59.0%, while BHP is relatively diversified (iron ore as an important part, but also布局 copper, potash, etc.) [0]
- 2025 Stock Volatility (RIO Daily Data): 52-week range ≈ $51.67-$82.36, daily volatility (standard deviation of daily returns) ≈1.53%, indicating obvious periodic fluctuations [0]
The above indicators show: BHP has the highest revenue dependence on China but more diversified operations; VALE has lower valuation but high iron ore concentration; RIO is in the middle.
Recent public reports and market news indicate that China is enhancing its voice in the iron ore market through multiple paths:
- North Iron Ore Index and Port Spot Platform: The China Iron and Steel Association (CISA) proposed to promote and improve the “North Iron Ore Index” based on real RMB spot transaction data at ports, aiming to optimize pricing methodology and enhance data transparency; multiple reports also stated that this index may provide reference for the new RMB-denominated benchmark [2]
- Index Changes in Long-Term Contracts: Media reports pointed out that RIO sent notices to Chinese customers, planning to adjust the selection of index pricing in some iron ore settlements in January-February 2025, which is regarded as an adaptive adjustment to the pricing mechanism (see references for report links) [3]
- First Shipment of Simandou Project: Chinese media reported that the first shipment of the Simandou project was launched, calling it a “super China variable” that brings potential impact to the existing pattern (see references for citations) [1]
- Supply-Demand and Price Clues: Market analysis reports show that iron ore prices rebounded temporarily in 2025 (e.g., Dalian Commodity Exchange iron ore futures temporarily rose to ~780 yuan/ton), partly due to supply-side constraints (such as VALE lowering some grade guidance, RIO’s conservative shipment target) and pre-holiday stockpiling, combined with China’s demand resilience [4]
- Price and Cost Environment: Public quotes and futures data show that the 62% iron ore CFR price recently fluctuated around ~$106/ton (December 2025), with a 52-week range of ~$93.41-$107.88/ton, which is in the median range compared to historical highs (Investing.com data) [7]
- Producer Adjustment Signals: RIO’s official website disclosed that the 2025 Pilbara iron ore sales guidance is 323-338Mt (100% basis), and mentioned that the subsequent incremental guidance for the Simandou project is 5-10Mt, indicating accelerated layout in high-grade supply (company guidance) [9]
Overall: In the short term, under the combined effect of supply-side constraints and China’s demand resilience, prices have periodic support, but long-term structural changes (such as Simandou, evolution of RMB pricing mechanism) will rewrite supply-demand and pricing benchmarks, bringing sustained impact on the volume-price combination and cost curves of the three major miners.
- As the core of the demand side (all three companies have more than 40% revenue dependence on China), the marginal improvement of its price benchmark and bargaining power will affect long-term equilibrium prices and profit margins:
- If RMB-denominated benchmarks (such as the North Iron Ore Index) are more widely adopted, reducing transaction friction and information asymmetry, it may narrow the spread between spot and long-term contracts and improve transparency, thereby affecting miners’ “pricing premium” [2]
- If high-grade ore from Simandou (reports show 65-80% Fe) reaches production as expected, it will increase global high-grade supply and may squeeze the premium space of medium and low-grade ore [10]
- Business Structure and Resilience:
- BHP: High revenue dependence on China, but diversified businesses like copper/potash provide hedging. If iron ore bargaining space narrows, its copper exposure can partially buffer cyclical fluctuations [0]
- RIO: Moderate iron ore proportion, and布局 copper, lithium, etc., with lower single dependence on iron ore than VALE. Its 2025 guidance emphasizes copper production upgrade and future growth (Oyu Tolgoi, Arcadium, Rincon, etc.) [9]
- VALE: Highest iron ore concentration, relatively more sensitive to China’s bargaining power improvement and increased high-grade supply; however, its low valuation (P/E≈10.2x, P/B≈1.4x) already reflects a certain discount, and if operational improvement and cost optimization are realized, there may be room for repair [0]
To systematically assess geopolitical risks of iron ore and related miners, it is recommended to adopt a “four-dimensional framework” (data sources/methodologies see attached):
-
Supply Chain Concentration and Substitutability
- Assessment Indicators: Global share of major resource countries (e.g., Australia, Brazil, Guinea), geographic concentration of ports and channels, availability and time cycle of alternative capacity (production cycle, policy and ESG constraints)
- Data Sources: USGS, IEA, public statistics from mining and trade departments of major countries [11]
-
Country Risk and Policy Changes
- Assessment Elements: Political stability, trends in tariff and export control policy changes, localization/resource nationalism tendencies, environmental and social governance (ESG) compliance requirements
- Data Sources: World Bank Governance Indicators, policy announcements and trade measure lists of major resource countries [11]
-
Market Structure Evolution and Pricing Mechanism
- Focus Points: Penetration rate of RMB pricing benchmarks, evolution of spot and long-term contract structures, convergence/substitution path between the North Iron Ore Index and existing international indices, port platform transactions and representativeness [2]
- Data Sources: Beijing Iron Ore Trading Center, methodology descriptions of mainstream index compilers (e.g., Platts, Fastmarkets) [4]
-
Corporate-Level Geopolitical Resilience
- Key Elements: Regional diversification (revenue sources and asset distribution), cost position and competitiveness, long-term contracts and strategic cooperation with downstream Chinese customers, supply chain flexibility and crisis management capabilities
- Data Sources: Company annual reports/sustainability reports, investor disclosures and public conference call records
- Diversified Business Weight: Moderately increase the weight of exposure to metals like copper and potash (e.g., BHP’s copper business, RIO’s copper/lithium layout) to hedge against cyclical downward risks caused by iron ore bargaining power transfer [0]
- Regional and Mineral Diversification: Avoid over-betting on a single resource country or mineral, and combine assets from South Africa, South America, Australia with key metals like copper, lithium, nickel for hedging
- Volatility Management: Given that iron ore price fluctuations will continue, derivatives (futures/options) or volatility strategies can be moderately used to hedge tail risks
- Supply Constraints and Stockpiling Windows: Historical experience shows that prices often rise periodically during China’s pre-holiday stockpiling and unexpected supply disruptions (e.g., weather, transportation受阻, maintenance) (market reports also indicate such factors support 2025 prices) [4]
- Key Indicators to Monitor:
- Changes in China’s port inventory and structure (grade distribution)
- Correlation and deviation between the North Iron Ore Index and mainstream indices
- Actual shipment progress and export data of projects like Simandou
- Valuation Anchor: VALE currently has relatively low valuation (P/E≈10.2x), but high business concentration; need to evaluate repair space combined with capacity and cost recovery progress; BHP and RIO have slightly higher valuations but stronger diversification and balance sheet support [0]
- Margin of Safety Perspective: When allocating, you can increase holdings when valuations retrace to a low historical percentile, and set strict stop-loss (e.g., based on key technical levels/volatility boundaries)
- China’s growing influence on the iron ore market is changing supply-demand and pricing structures through paths like the North Iron Ore Index, port spot platforms, new supply increments from Simandou, and adjustments to contract settlement indices [1][2][3]
- For the three major mining giants: BHP has the highest revenue dependence on China but diversified businesses provide buffers; RIO balances iron ore with new growth drivers like copper and lithium; VALE has the lowest valuation but highest iron ore concentration, with the greatest elasticity to changes in bargaining power and high-grade supply [0]
- Geopolitical risks need to be systematically assessed from four dimensions: supply chain concentration, country risk, market structure evolution, and corporate resilience, and key data and policy signals should be continuously tracked [11]
- Investors should build diversified portfolios of businesses and minerals based on valuation margins of safety, and配合 dynamic hedging and risk management tools to seize relative value opportunities amid price fluctuations and structural changes
[0] Gilin API Data
[1] Zhihu Column, “Simandou’s First Shipment Sails: Breaking the ‘Iron Triangle’ Monopoly, A Super ‘China Variable’ Emerges in the Global Mining Market”, Link: https://zhuanlan.zhihu.com/p/1979492690489017878
[2] Xinhua Finance, “CISA’s Luo Tiejun: North Iron Ore Index Promotes Further Improvement of Iron Ore Pricing Mechanism”, Link: https://finance.sina.com.cn/money/bond/2025-12-19/doc-inhchwwt2502827.shtml
[3] Hellenic Shipping News, “Rio Tinto to change index for some iron ore settlement, client notice, trader says”, Link: https://www.hellenicshippingnews.com/rio-tinto-to-change-index-for-some-iron-ore-settlement-client-notice-trader-says/
[4] Markets Financial Content, “Iron Ore Prices Surge to CNY 780 as Supply Constraints and…”, Link: https://markets.financialcontent.com/stocks/article/marketminute-2025-12-26-iron-ore-prices-surge-to-cny-780-as-supply-constraints-and-chinese-steel-profitability-fuel-year-end-rebound
[5] Trading Economics, “Iron Ore CNY - Price - Chart - Historical Data - News”, Link: https://tradingeconomics.com/commodity/iron-ore-cny
[6] Intratec, “Iron Ore Price Outlook”, Link: https://www.intratec.us/solutions/primary-commodity-prices/commodity/iron-ore-prices
[7] Investing.com, “Iron ore fines 62% Fe CFR Futures Price Today”, Link: https://www.investing.com/commodities/iron-ore-62-cfr-futures
[8] Reuters, “Mass layoffs overshadow Guinea’s Simandou mega mine as output accelerates”, Link: https://www.reuters.com/world/africa/mass-layoffs-overshadow-guineas-simandou-mega-mine-output-accelerates-2025-12-18/
[9] Rio Tinto Official Website, “Stronger, sharper and simpler Rio Tinto to deliver leading returns”, Link: https://www.riotinto.com/en/news/releases/2025/stronger-sharper-and-simpler-rio-tinto-to-deliver-leading-returns
[10] CSG Talent, “2025 Mine Developments: How Global Mining Growth Is Accelerating”, Link: https://www.csgtalent.com/insights/blog/global-mining-market-growth-2025-new-mine-developments/
[11] Goldman Sachs 2026 Commodity Outlook (Reprinted from NetEase), Link: https://www.163.com/dy/article/KHNQTQT00519BD5M.html
Insights are generated using AI models and historical data for informational purposes only. They do not constitute investment advice or recommendations. Past performance is not indicative of future results.
About us: Ginlix AI is the AI Investment Copilot powered by real data, bridging advanced AI with professional financial databases to provide verifiable, truth-based answers. Please use the chat box below to ask any financial question.