In-depth Analysis of the Sustainability of Overweight Oil & Gas Strategy in 2026
Unlock More Features
Login to access AI-powered analysis, deep research reports and more advanced features

About us: Ginlix AI is the AI Investment Copilot powered by real data, bridging advanced AI with professional financial databases to provide verifiable, truth-based answers. Please use the chat box below to ask any financial question.
Related Stocks
Based on in-depth analysis of the fundamentals, market data, and policy environment of the oil & gas industry, I now provide you with a comprehensive investment strategy assessment.
Under the current supply-demand pattern, the overweight oil & gas (45% position) strategy faces
- Aggravated Supply-Demand Imbalance: The global crude oil market will face a severe supply surplus of 2-4 million barrels per day in 2026 [1][2]
- Downward Shift in Oil Price Center: Goldman Sachs predicts an average Brent crude price of $56/bbl and WTI of $52/bbl, a further drop of 8-10% from current levels [1]
- Weak Historical Performance: The energy sector has an annualized return of only 1.56% over the past three years, far lower than the S&P 500’s 21.92% [0]
- Structural Energy Transition: Global new energy penetration is accelerating, and the long-term demand peak may arrive earlier [3][4]
According to the latest Goldman Sachs report, 2025-2026 will see the “last large-scale supply wave” [1]:
- Non-OPEC Countries Lead Production Growth: The US, Brazil, Guyana, and Canada contribute over 50% of global increments in 2025 and are expected to contribute about 60% in 2026 [2]
- Concentrated Commissioning of Long-Cycle Projects: Large oil & gas projects approved before the pandemic will be put into operation in 2026, forming a large-scale supply shock [1]
- OPEC+ Policy Shift: From “price protection” to “market protection”, production increase is suspended but resumption cannot be ruled out [3]
- Duration of Supply Surplus: The surplus will persist throughout 2026, with the greatest pressure in Q1 (expected to exceed 5 million barrels/day), gradually easing in the second half [2]
- Non-OECD Countries as Main Drivers: China, India, and other Asian countries contribute over 80% of global demand increments [2]
- Slowdown in China’s Economic Growth: Even based on the上调 GDP forecast, the pull on oil demand remains limited [2]
- Accelerated New Energy Substitution: EV penetration rate continues to rise, and fuel vehicle demand declines structurally [3][4]
- Global Trade Fragmentation: Tariff policies drag down economic growth, indirectly suppressing energy demand [5]
Major investment banks have reached a consensus on a “significant downward shift in the center” for 2026 oil prices [3]:
| Institution | Brent Crude Forecast | WTI Crude Forecast | Bottom Time |
|---|---|---|---|
| Goldman Sachs | $56/bbl | $52/bbl | Mid-2026 [1] |
| JPMorgan Chase | $57-58/bbl | $53-54/bbl | - |
| Morgan Stanley | $60/bbl | - | Q1 [3] |
| UBS | $67/bbl at year-end | $64/bbl at year-end | V-shaped recovery [3] |
Based on 2023-2025 market data analysis [0]:
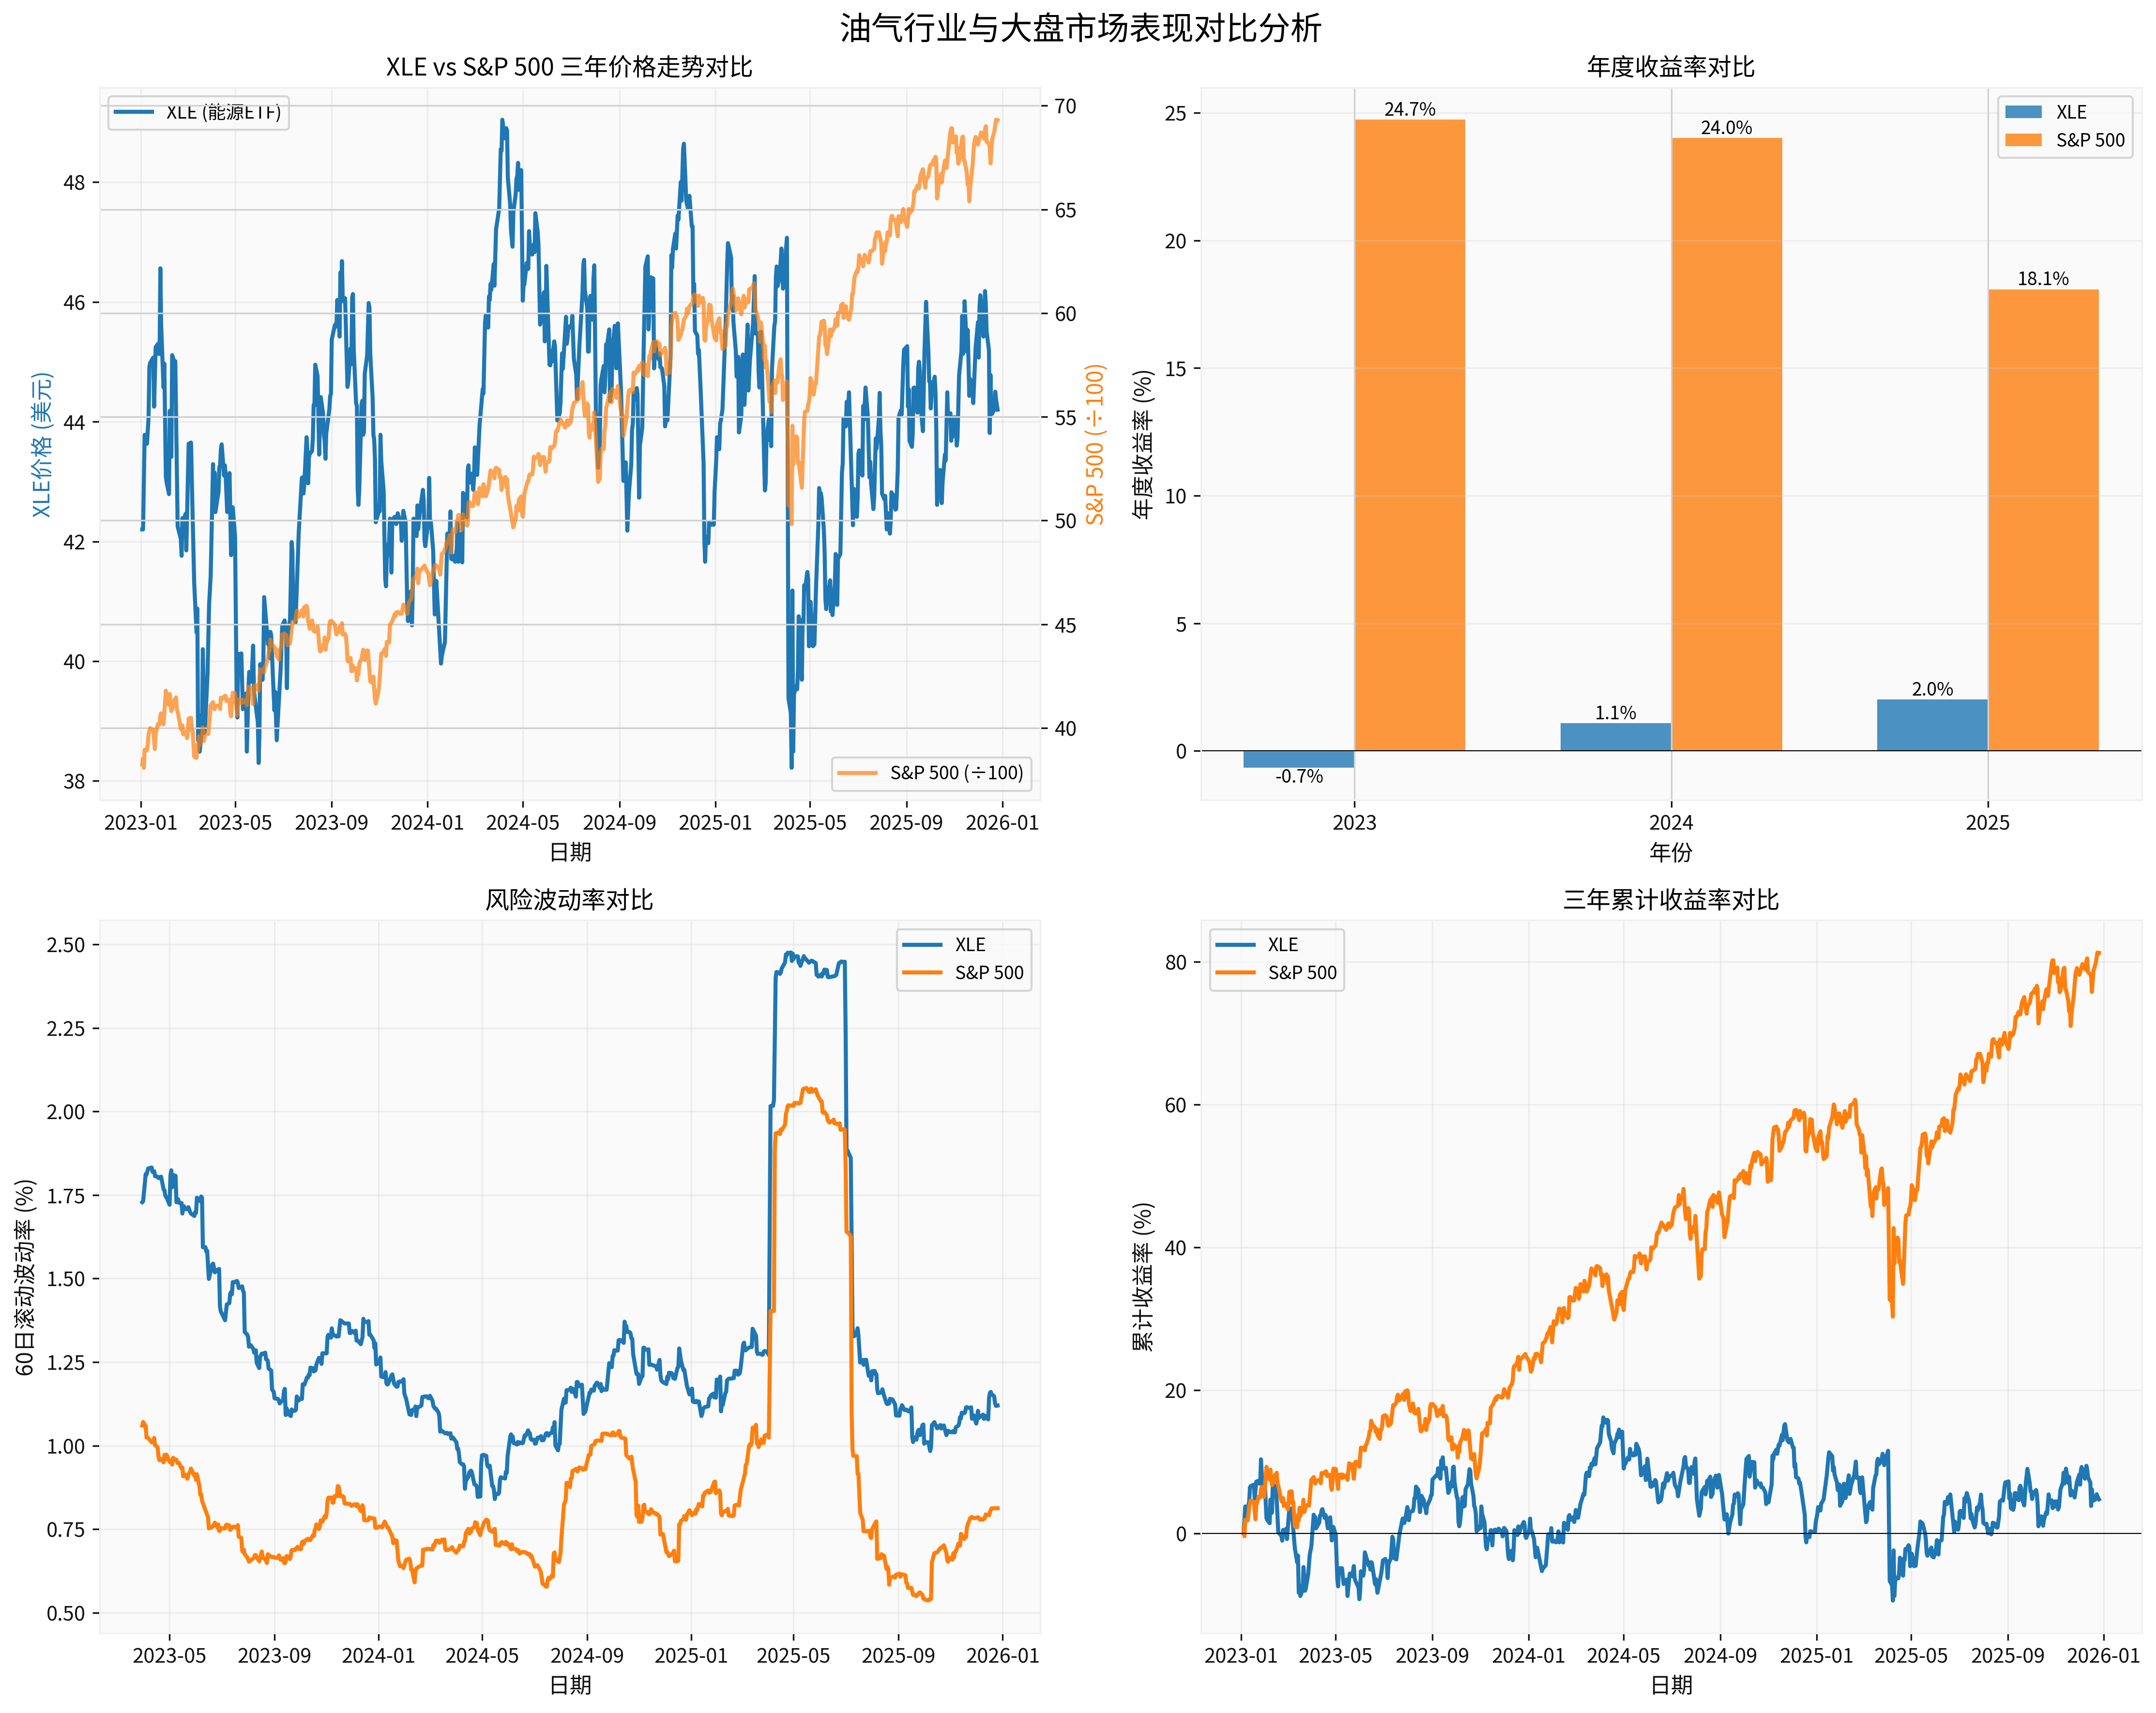
- Top Left: Over the past three years, the price of XLE (Energy ETF) has remained basically flat, while the S&P 500 has risen by over 80%
- Top Right: XLE’s annual returns in 2023-2025 were -5.2%, +9.8%, and +2.0% respectively, far lower than the S&P 500
- Bottom Left: XLE’s volatility (21.87%) is significantly higher than the S&P 500’s (15.09%), making risk-adjusted returns even worse
- Bottom Right: The cumulative return gap continues to widen, with the oil & gas sector underperforming the broader market by more than 70 percentage points
- XLE Annual Return: 2.01% (from $43.33 at the beginning of the year to $44.20 at the end)
- S&P 500 Annual Return: 18.09% (from 5869 at the beginning of the year to 6930 at the end)
- Relative Performance: XLE underperformed the broader market by 16.08 percentage points
- Sharpe Ratio: XLE was -0.00, S&P 500 was 0.01 (assuming a risk-free rate of 3%)
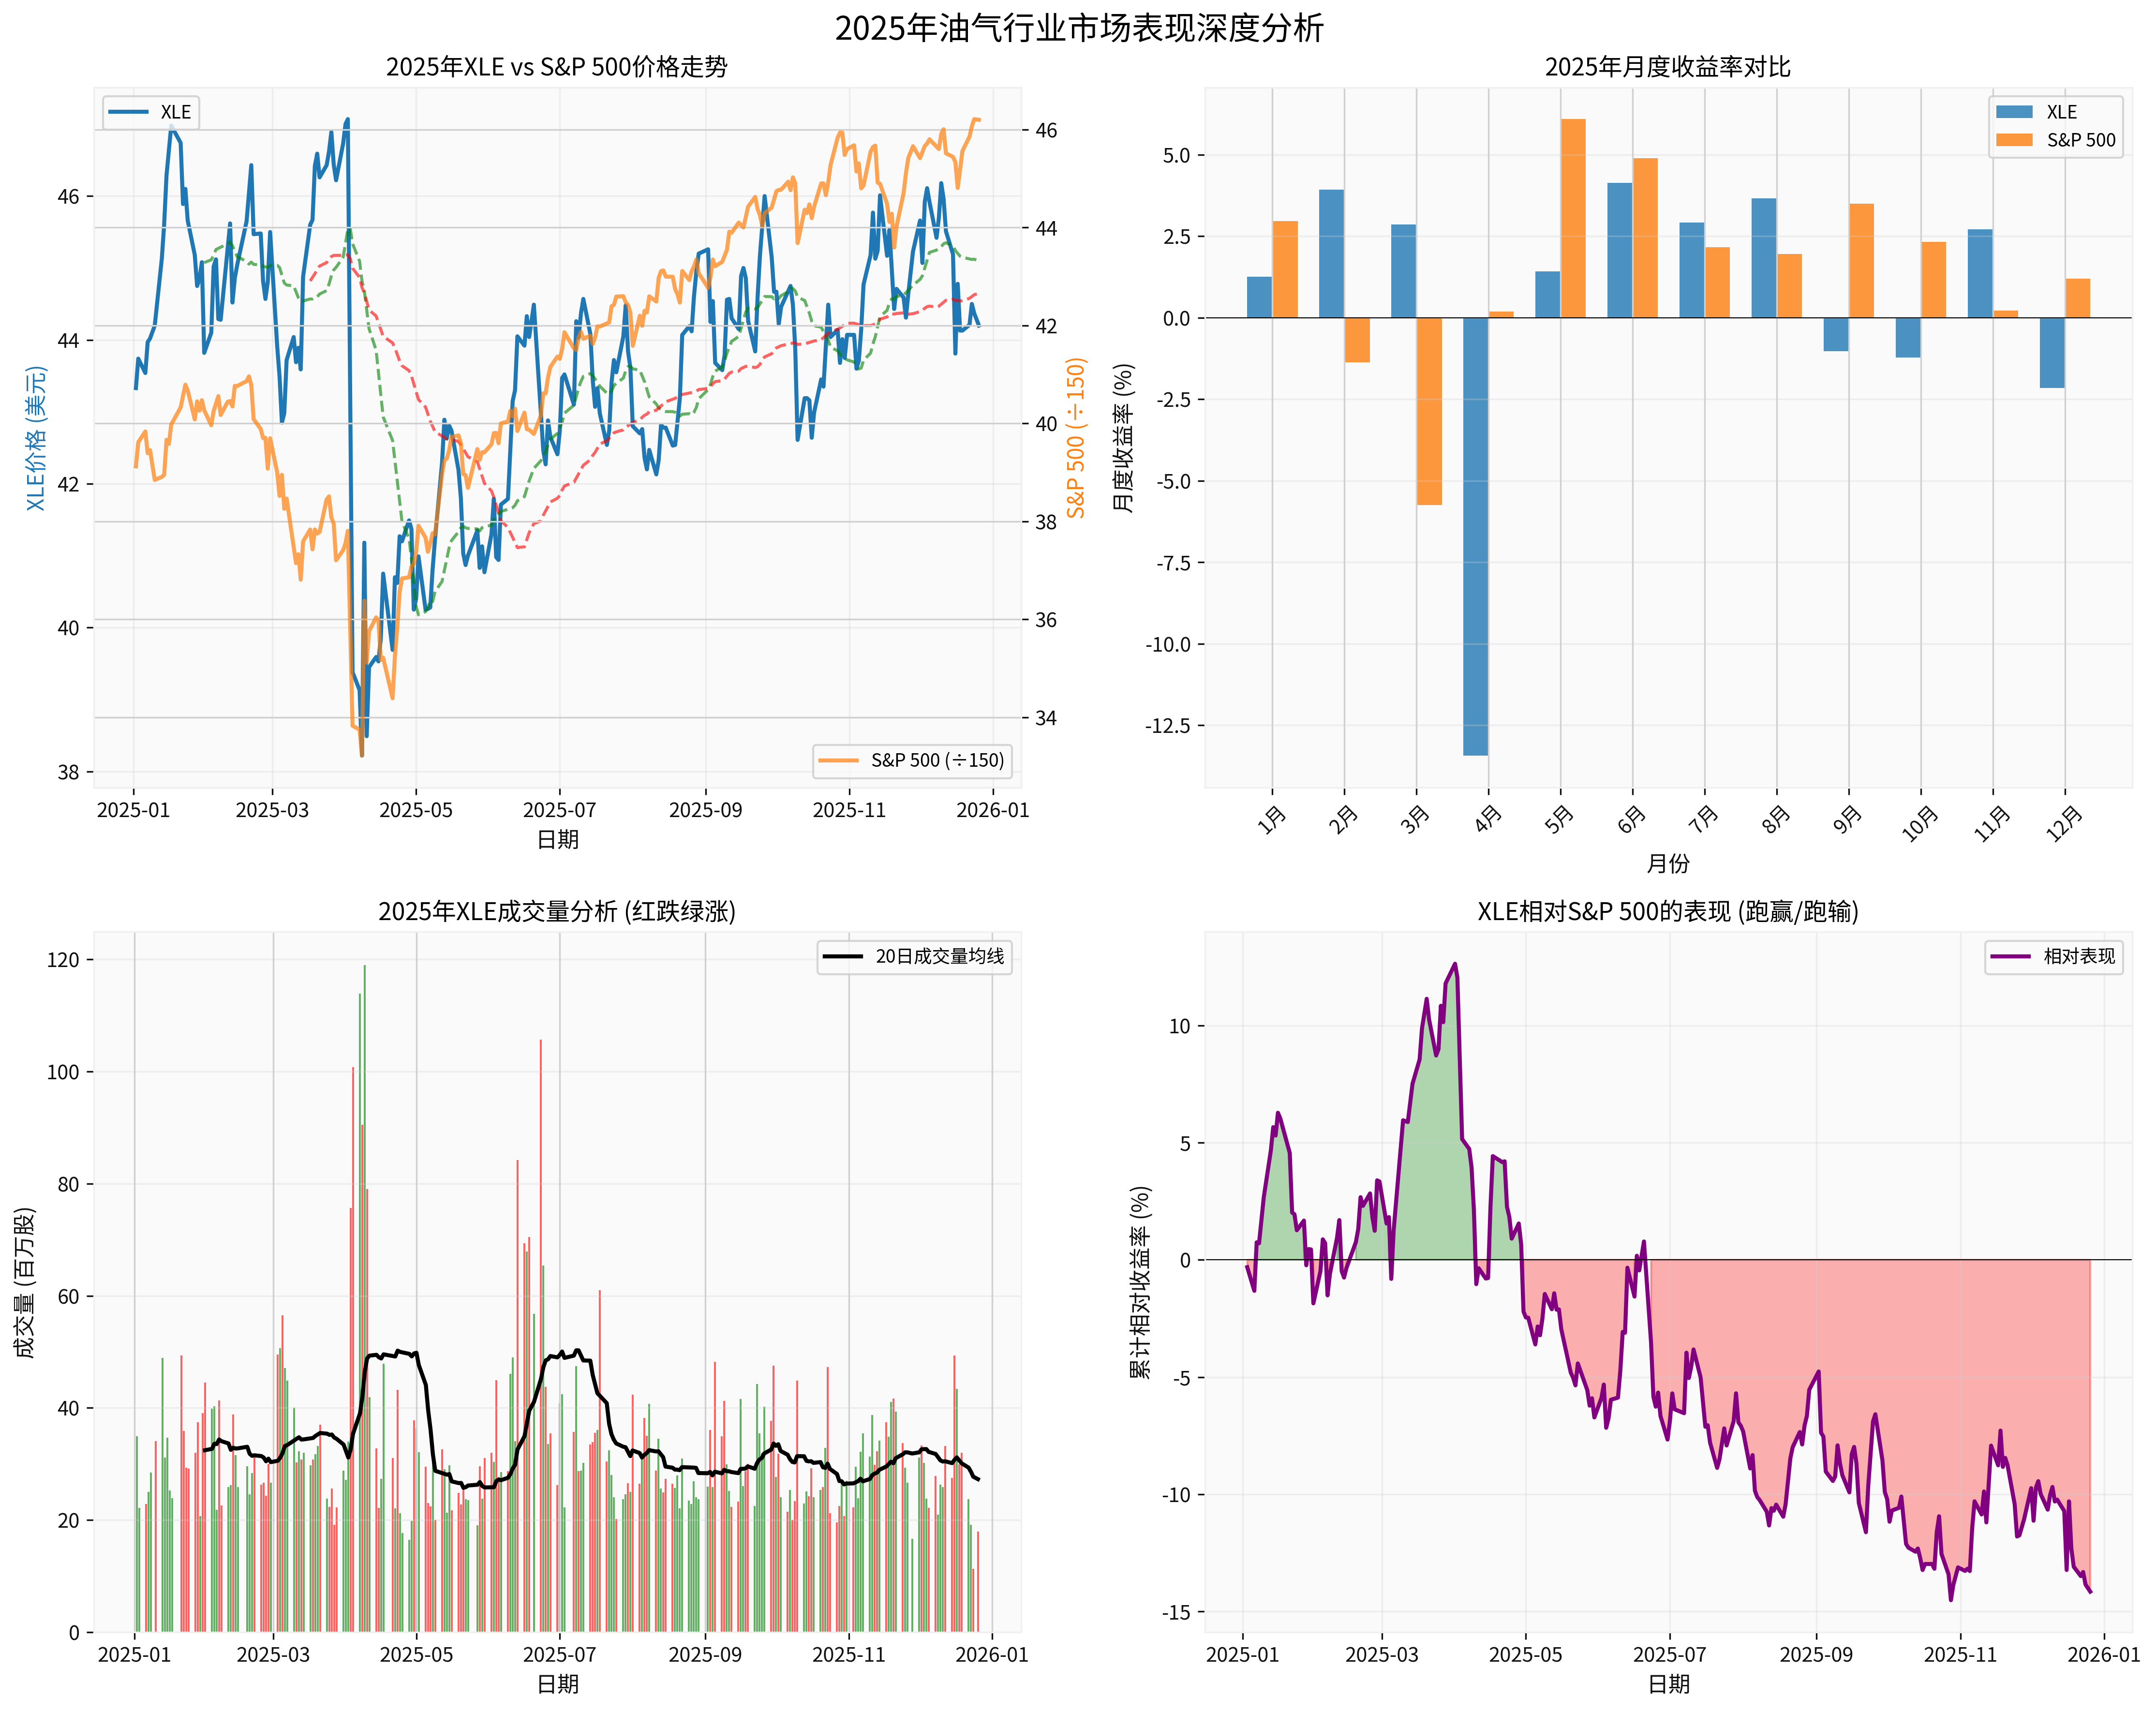
- Top Left: In 2025, XLE oscillated in the range of $37-47, with obvious suppression from the 50-day moving average
- Top Right: Monthly returns fluctuated violently, with double-digit declines occurring multiple times
- Bottom Left: Trading volume increased on down days, reflecting market selling pressure
- Bottom Right: Relative performance remained negative, with the maximum underperformance against the broader market reaching -25%
Despite industry pressure, CNOOC still has significant defensive advantages [6][7]:
- Main barrel oil cost of $27.35in the first three quarters of 2025, down 2.8% YoY
- Significantly lower than the international peers’ level of about $40
- Overseas high-quality blocks such as Guyana have lower costs and strong resistance to oil price fluctuations
- Profitability remains possible even if oil prices fall to $45/bbl[7]
- 45% dividend policyprovides stable cash flow
- Net profit attributable to parent company was 101.971 billion yuanin the first three quarters of 2025
- Dividend yield has a relative advantage and can be used as a bond substitute
- 2025 net production target of 760-780 million barrels of oil equivalent (growth of 5.4%-8.3%)
- Bohai Oilfield exceeded 40 million tons of oil & gas equivalent this year, with another 100-million-ton discovery [6]
- Overseas projects such as Guyana and Brazil contribute high-profit increments
- “Stabilize Oil, Increase Gas” strategy, with natural gas accounting for 50% by 2035
- Actively layout offshore wind power, hydrogen energy, and other new energy sources [7]
- Aligns with the general trend of energy transition
Based on Goldman Sachs’ forecast of Brent oil price at $56/bbl [1] and CNOOC’s cost structure [7]:
| Oil Price Scenario | Brent Average Price | Barrel Oil Profit | Net Profit Forecast | YoY Change |
|---|---|---|---|---|
| Optimistic | $65/bbl | ~$37.65 | ~140 billion yuan | -10% |
| Neutral | $56/bbl | ~$28.65 | ~105 billion yuan | -25% |
| Pessimistic | $45/bbl | ~$17.65 | ~65 billion yuan | -55% |
Note: Calculated based on barrel oil cost of $27.35 and assumed net production of 780 million barrels
In 2025, the US implemented a 10% benchmark tariff, triggering a global chain reaction [5]:
- Increased Energy Transaction Costs: Tariffs increase oil & gas import costs and compress downstream refining profits
- Accelerated Industrial Chain Restructuring: “China+1” layout leads to changes in trade flows, increasing shipping distances and costs
- Increased Exchange Rate Volatility: Trade frictions push up dollar volatility, affecting dollar-denominated crude oil prices
- Demand Side Suppression: Global economic growth slows down, indirectly suppressing oil demand
- Prolonged Russia-Ukraine Conflict: Affects Russian oil supply, but alternative supply may emerge
- Unstable Situation in the Middle East: Risk premium for shipping safety in the Strait of Hormuz
- China-US Game: Energy becomes a tool for geopolitical games, increasing market uncertainty
According to the “2060 World and China Energy Outlook Report (2025 Edition)” [4]:
- 2035 Target: China’s wind and solar installed capacity will reach3.6 billion kWor more
- Annual Increment: 200 million kW of new wind and solar installed capacity each year in the next 10 years
- Cost Advantage: Solar and wind energy costs have dropped by90%and67%respectively in the past 10 years
- Increased Nuclear Power Cost: Nuclear power cost increased by48%during the same period, becoming the most expensive power source [4]
Traditional forecasts believe that the global oil demand peak will arrive between 2030-2035, but the following factors may lead to an earlier peak:
- Higher-than-expected EV Penetration: Global new energy vehicle sales accounted for over 30% in 2025
- Energy Efficiency Improvement: Continuous improvement in energy efficiency in industry, construction, and transportation sectors
- Policy加码: EU Carbon Border Adjustment Mechanism (CBAM) forces low-carbon transition [4]
- ESG Investment Preference: Institutional investors reduce fossil fuel allocation
Based on the above analysis, the following recommendations are made for your 45% oil & gas position allocation:
- Reduce oil & gas positions from 45% to 20-25%: Cash in some gains and reduce portfolio volatility
- Retain core positions in CNOOC: As a defensive variety, leveraging its cost and high dividend advantages
- Reduce holdings of high-cost oil & gas companies: Such as North American shale oil enterprises with weak risk resistance
- Retain CNOOC (00883): Account for 15-20% of total positions as a “bond+” substitute
- Phase-wise Participation in Rebounds: If oil prices bottom out at $50-52/bbl in mid-2026, short-term participation in rebounds is feasible
- Pay Attention to OPEC+ Production Cut Signals: If unexpected production cuts occur, it may bring trading opportunities
- Oil-gas price ratio regression: Natural gas is undervalued relative to oil prices, with补涨 opportunities
- CNOOC’s “Stabilize Oil, Increase Gas” strategy aligns with the transition trend
- LNG demand continues to grow, especially in the Asian market
- Allocate some leading offshore wind power and hydrogen energy enterprises
- CNOOC’s own new energy layout is worth attention
- Transformation of traditional energy enterprises may bring valuation reconstruction
- Focus on ports and shipping benefiting from trade flow changes (you already favor this)
- Demand growth in emerging markets such as India and the Middle East
- Project opportunities in resource-rich countries in Africa and Latin America
- As the demand peak approaches, gradually reduce oil & gas weight to 10-15%
- Shift gains to growth sectors such as new energy, energy storage, and hydrogen energy
- Internet (Tencent): In line with the concept of “don’t leave early before the trend ends”
- Ports and shipping: Benefit from global trade restructuring with stable cash flow
- New energy technology: Strong policy support and high growth
| Risk Type | Trigger Condition | Impact Degree | Response Strategy |
|---|---|---|---|
| Deep Oil Price Drop | Brent < $45/bbl | Extremely High | Strictly control positions and retain enterprises with high cost advantages |
| OPEC+ Price War | No production cuts or even production increases | High | Wait and see after production cuts, avoid left-side bottom fishing |
| Global Recession | GDP growth < 2% | Medium-High | Increase allocation of defensive assets and reduce cyclical exposure |
| Higher-than-expected New Energy | EV penetration >50% | Medium | Accelerate transition allocation and reduce traditional oil & gas |
| Escalated Geopolitical Conflicts | Middle East War/Strait of Hormuz Blockade | Extremely High | Short-term long on oil & gas, but unsustainable |
It is recommended to set the following stop-loss levels:
- CNOOC: Based on the valuation level corresponding to oil price of $45/bbl
- Oil & Gas Portfolio: Overall position does not exceed 25%
- Single Target: Single oil & gas stock does not exceed 10% of total positions
-
45% Oil & Gas Position Is Too Heavy: Against the backdrop of supply-demand imbalance, the oil & gas sector is likely to continue underperforming the broader market in 2026, and excess returns are unsustainable
-
CNOOC Has Outstanding Relative Value: But even with its cost advantages, it cannot fully hedge against industry downside risks
-
Shift from “Trend Investment” to “Value Investment”: You mentioned “don’t leave early before the trend ends”, but the medium and long-term trend of the oil & gas industry has undergone a fundamental change
-
Recommended Allocation Adjustments:
- Oil & Gas Position: 45% → 20-25%
- CNOOC: Retain as defensive core
- New Allocations: Ports (you already favor), new energy technology, high dividend defensive assets
-
Wait for Better Buying Points: If oil prices bottom out at $50-52/bbl in mid-2026, consider a small increase in positions to participate in rebounds, but not heavy positions
[0] Gilin API Data - XLE, S&P 500 Historical Prices and Market Data
[1] Gilin API Data - Energy ETF (XLE) Latest News
[2] Sina Finance - Goldman Sachs 2026 Commodity Outlook: Gold Reigns, Bullish on Copper Over Aluminum and Lithium (https://www.163.com/dy/article/KHNQTQT00519BD5M.html)
[3] Sina Finance - Supply Surplus Drives Oil & Gas Prices, Expected to Bottom in Mid-2026 (https://finance.sina.com.cn/roll/2025-12-19/doc-inhciinf7318194.shtml)
[4] China Petroleum & Chemical News Network - Collaborate to Build an Energy Future that Promotes Security through Transformation (http://www.sinopecnews.com.cn/xnews/content/2025-12/25/content_7139749.html)
[5] Sina Finance - Five Key Words to Predict Global Economic Trends in 2026 (https://finance.sina.com.cn/jjxw/2025-12-25/doc-inhczaki8896646.shtml)
[6] Sina Finance - CNOOC Bohai Oilfield Makes Another 100-Million-Ton Discovery, Exceeding 40 Million Tons of Oil & Gas Equivalent This Year (https://finance.sina.com.cn/jjxw/2025-12-24/doc-inhcwhpr4562693.shtml)
[7] Caifuhao - Core Competitiveness of CNOOC (https://caifuhao.eastmoney.com/news/20251223131940578756990)
[8] Sina Finance - Zhengxin Futures: International Institutions’ 2026 Crude Oil Market Outlook (https://finance.sina.com.cn/money/future/fmnews/2025-12-24/doc-inhcwafu0064090.shtml)
[9] Sina Finance - Turning Point for Crude Oil Market: Will Oil Prices Face a Cold Winter or Dawn Next Year Amid Overcapacity Pressure? (https://finance.sina.com.cn/stock/hkstock/hkstocknews/2025-12-23/doc-inhcucqt5545373.shtml)
Insights are generated using AI models and historical data for informational purposes only. They do not constitute investment advice or recommendations. Past performance is not indicative of future results.
About us: Ginlix AI is the AI Investment Copilot powered by real data, bridging advanced AI with professional financial databases to provide verifiable, truth-based answers. Please use the chat box below to ask any financial question.