Investment Value Analysis of Tongwei Co., Ltd. and Hesheng Silicon Industry Co., Ltd.
Unlock More Features
Login to access AI-powered analysis, deep research reports and more advanced features
About us: Ginlix AI is the AI Investment Copilot powered by real data, bridging advanced AI with professional financial databases to provide verifiable, truth-based answers. Please use the chat box below to ask any financial question.
Related Stocks
Based on comprehensive data obtained, I provide the following systematic analysis:
- Current Stock Price: 21.80 CNY (↑1.96%)
- Market Capitalization: 95.93 billion CNY
- P/E Ratio: -11.51x (in loss status)
- P/B Ratio: 2.19x
- ROE: -18.28% (deep loss)
- Net Profit Margin: -9.44%
- Current Ratio: 1.24
- Quick Ratio: 0.99
- Current Stock Price: 54.96 CNY (↑3.37%)
- Market Capitalization: 64.43 billion CNY
- P/E Ratio: -1,820x (severe loss)
- P/B Ratio: 2.01x
- ROE: -0.11% (close to break-even)
- Net Profit Margin: -0.16%
- Current Ratio: 0.31
- Quick Ratio: 0.11
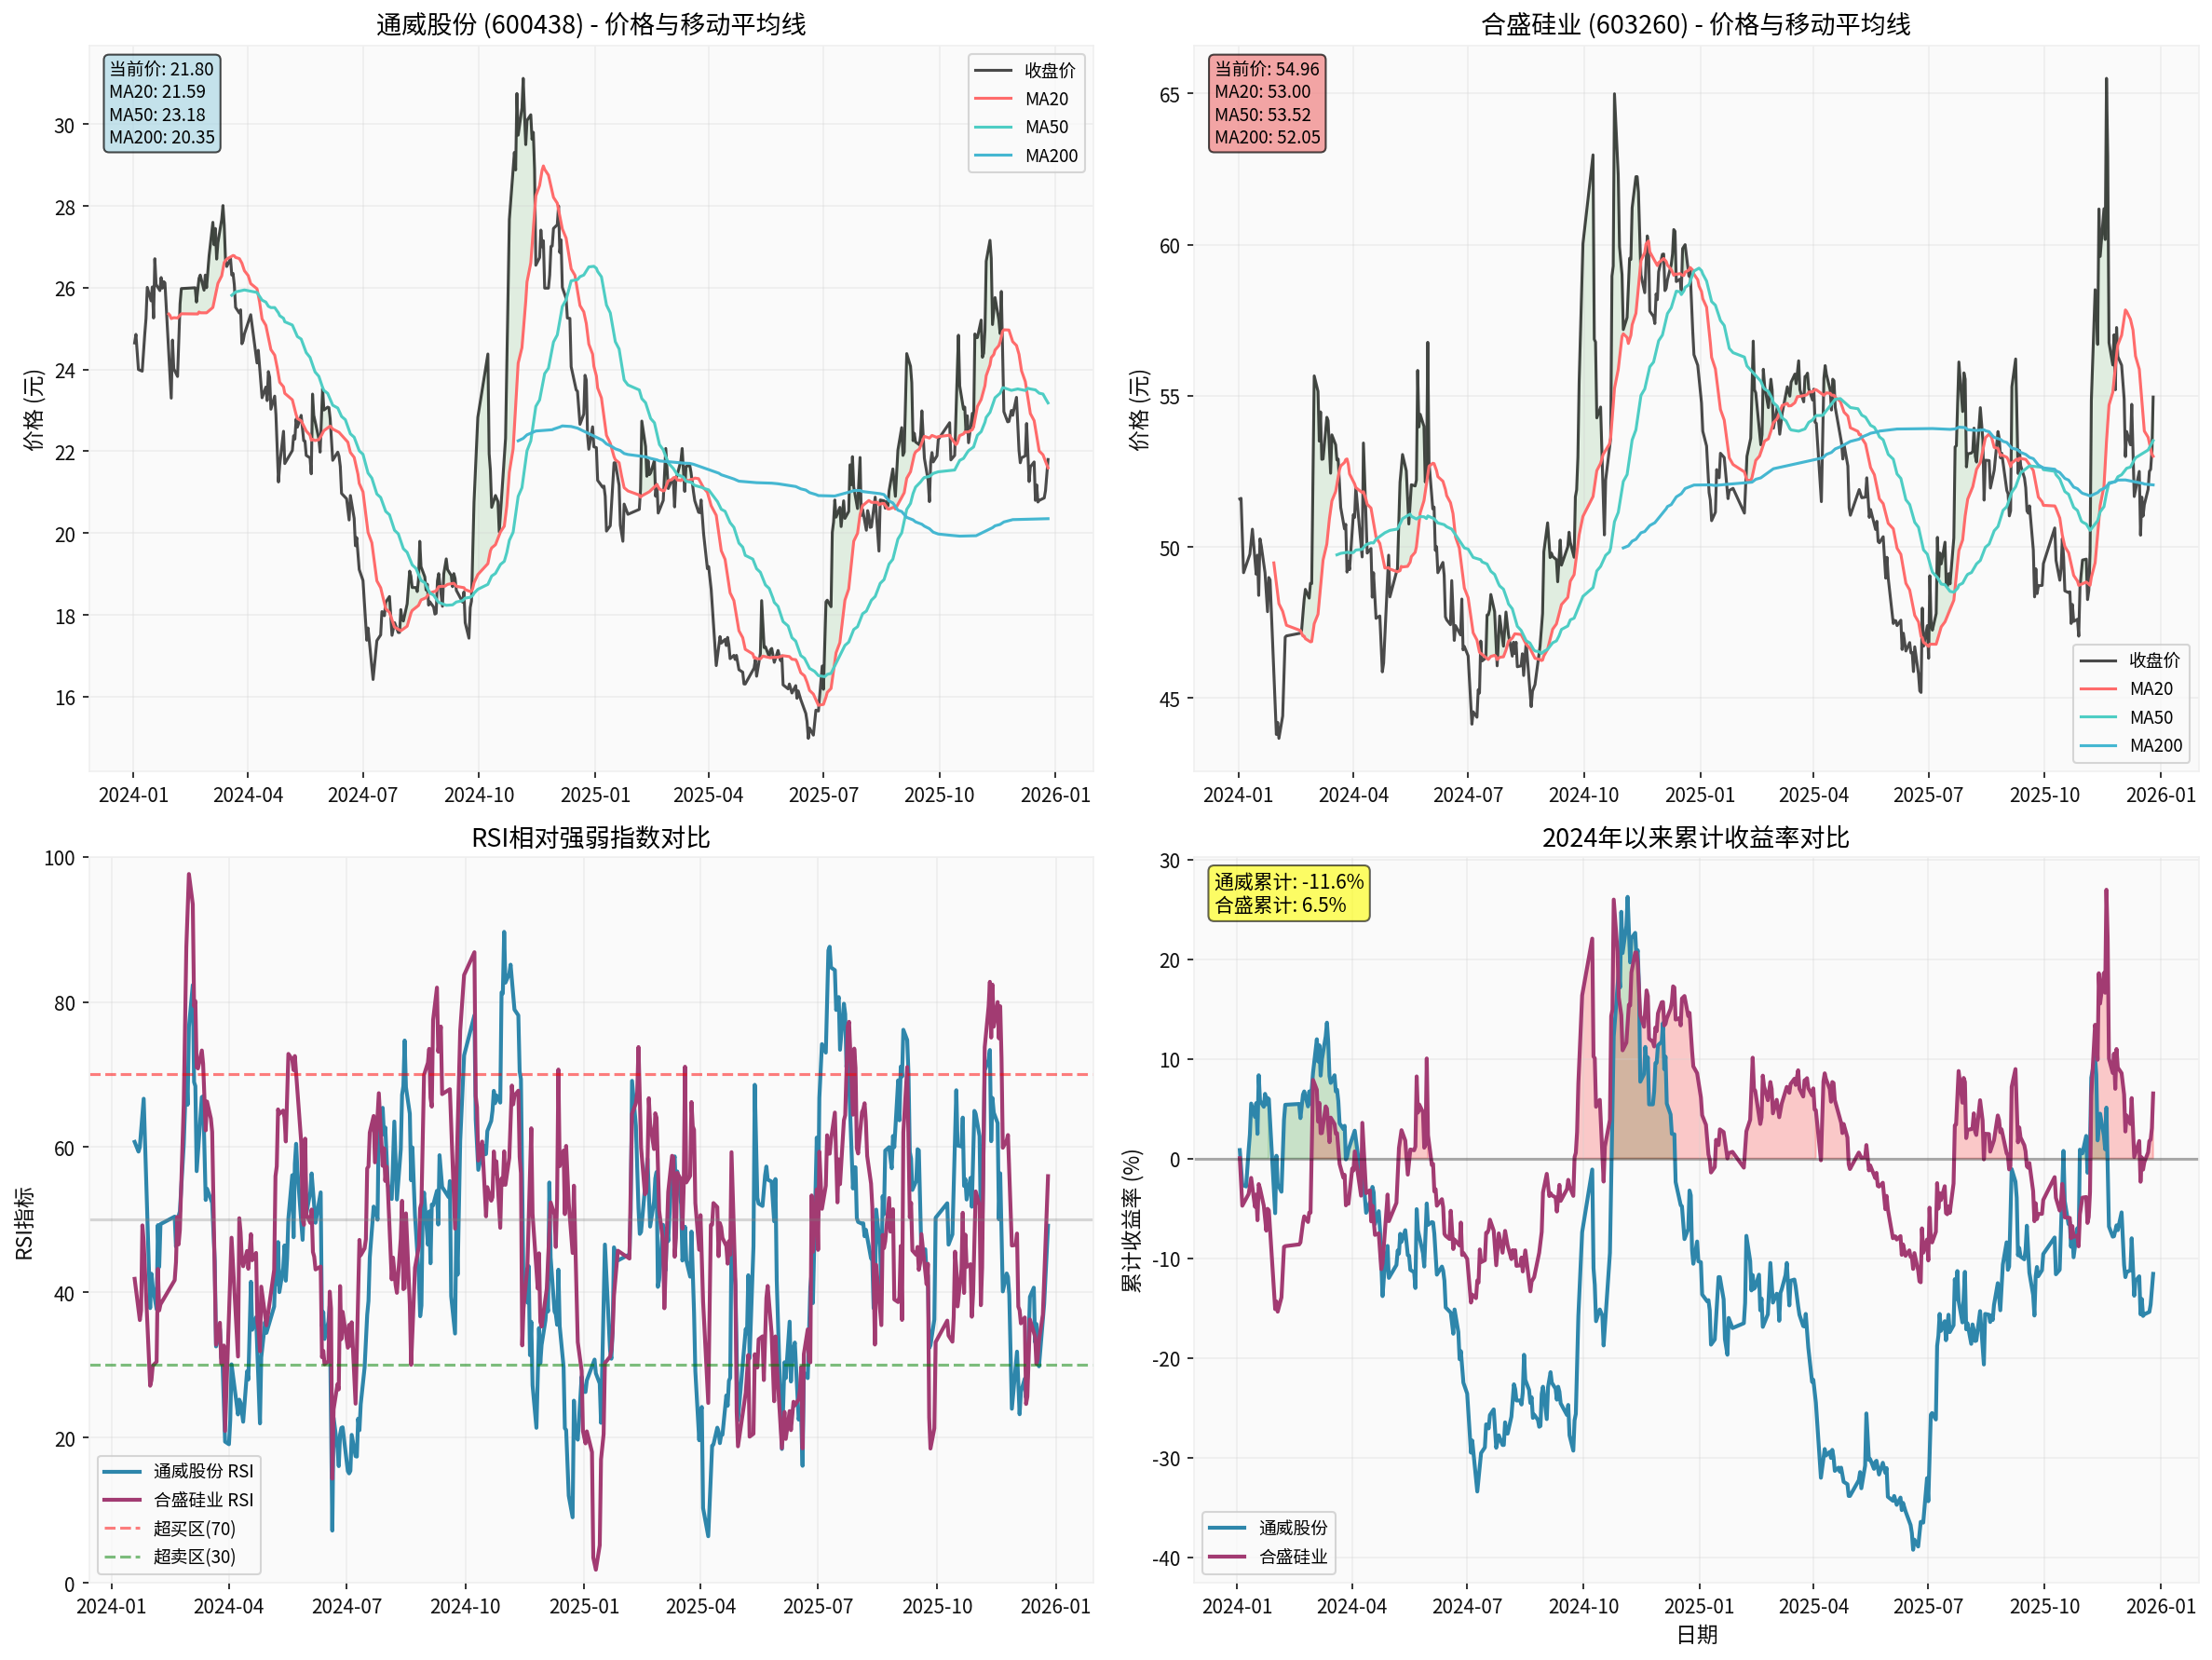
The chart above shows a four-dimensional technical comparison of Tongwei and Hesheng from the beginning of 2024 to the end of 2025:
-
Top-left & Top-right: Closing prices and 20/50/200-day moving averages of the two companies. Tongwei’s stock price fluctuates around MA20 (current 21.80 CNY, about +0.95% from MA20); Hesheng’s stock price runs above MA20 (current 54.96 CNY, about +3.70% from MA20), showing relatively stronger short-term performance.
-
Bottom-left: RSI(14) comparison. Tongwei’s RSI is around 49.2, in the neutral range; Hesheng’s RSI is around 56.0, slightly bullish but not entering overbought territory (above 70), indicating that bullish momentum is slightly dominant.
-
Bottom-right: Cumulative return comparison since 2024. Tongwei’s cumulative return is about -12.8%, Hesheng’s about +8.0%, indicating that Hesheng’s relative performance over the past year is better.
- Tongwei: Annualized volatility of 44.72%, Beta=0.7, lower than market volatility; currently in a sideways consolidation phase, support level at $21.39, resistance level at $22.21 [0]
- Hesheng: Annualized volatility of 38.35%, Beta=0.25, extremely low volatility; technical side is sideways, MACD golden cross is bullish, but RSI has overbought risk, support level at $53.00, resistance level at $55.93 [0]
-
Industry Position Advantage:
- Global polysilicon leader, cost control capability leading the industry
- Integrated production capacity advantage (upstream industrial silicon → polysilicon → battery cells)
- Already close to break-even point in Q3 2024 (ROE significantly narrowed from -18%) [0]
-
High Price Sensitivity:
- User assumption: If polysilicon average price reaches 60,000 CNY/ton → can achieve 20% gross margin and about 15% ROE
- High profit elasticity; a small price recovery can turn losses into profits
-
Better Financial Health:
- Current ratio of 1.24, quick ratio of 0.99, short-term debt repayment ability is acceptable [0]
- Relatively stable cash flow, positive free cash flow [0]
- If polysilicon prices remain sluggish, profit recovery will be delayed until Q4 2025
- Price wars may intensify during capacity clearance
-
Business Diversification:
- Dual main businesses of industrial silicon + organic silicon, strong anti-cycle ability
- Expected ROE recovery of 5-8%, profit improvement is relatively moderate
-
Stock Price Relatively Resistant to Decline:
- Since 2024, stock price has risen +8.02%, significantly better than Tongwei’s -12.80% [0]
- Market has higher recognition of its profit stability
-
Low ROE Ceiling:
- Expected ROE is only 5-8%, significantly lower than Tongwei’s target of 15%
- “Price-to-Earnings Rate” (PR) value is relatively high (1.9-5.0), insufficient valuation attractiveness
-
Liquidity Pressure:
- Current ratio only 0.31, quick ratio 0.11, short-term capital chain tight [0]
- May limit the speed of profit improvement
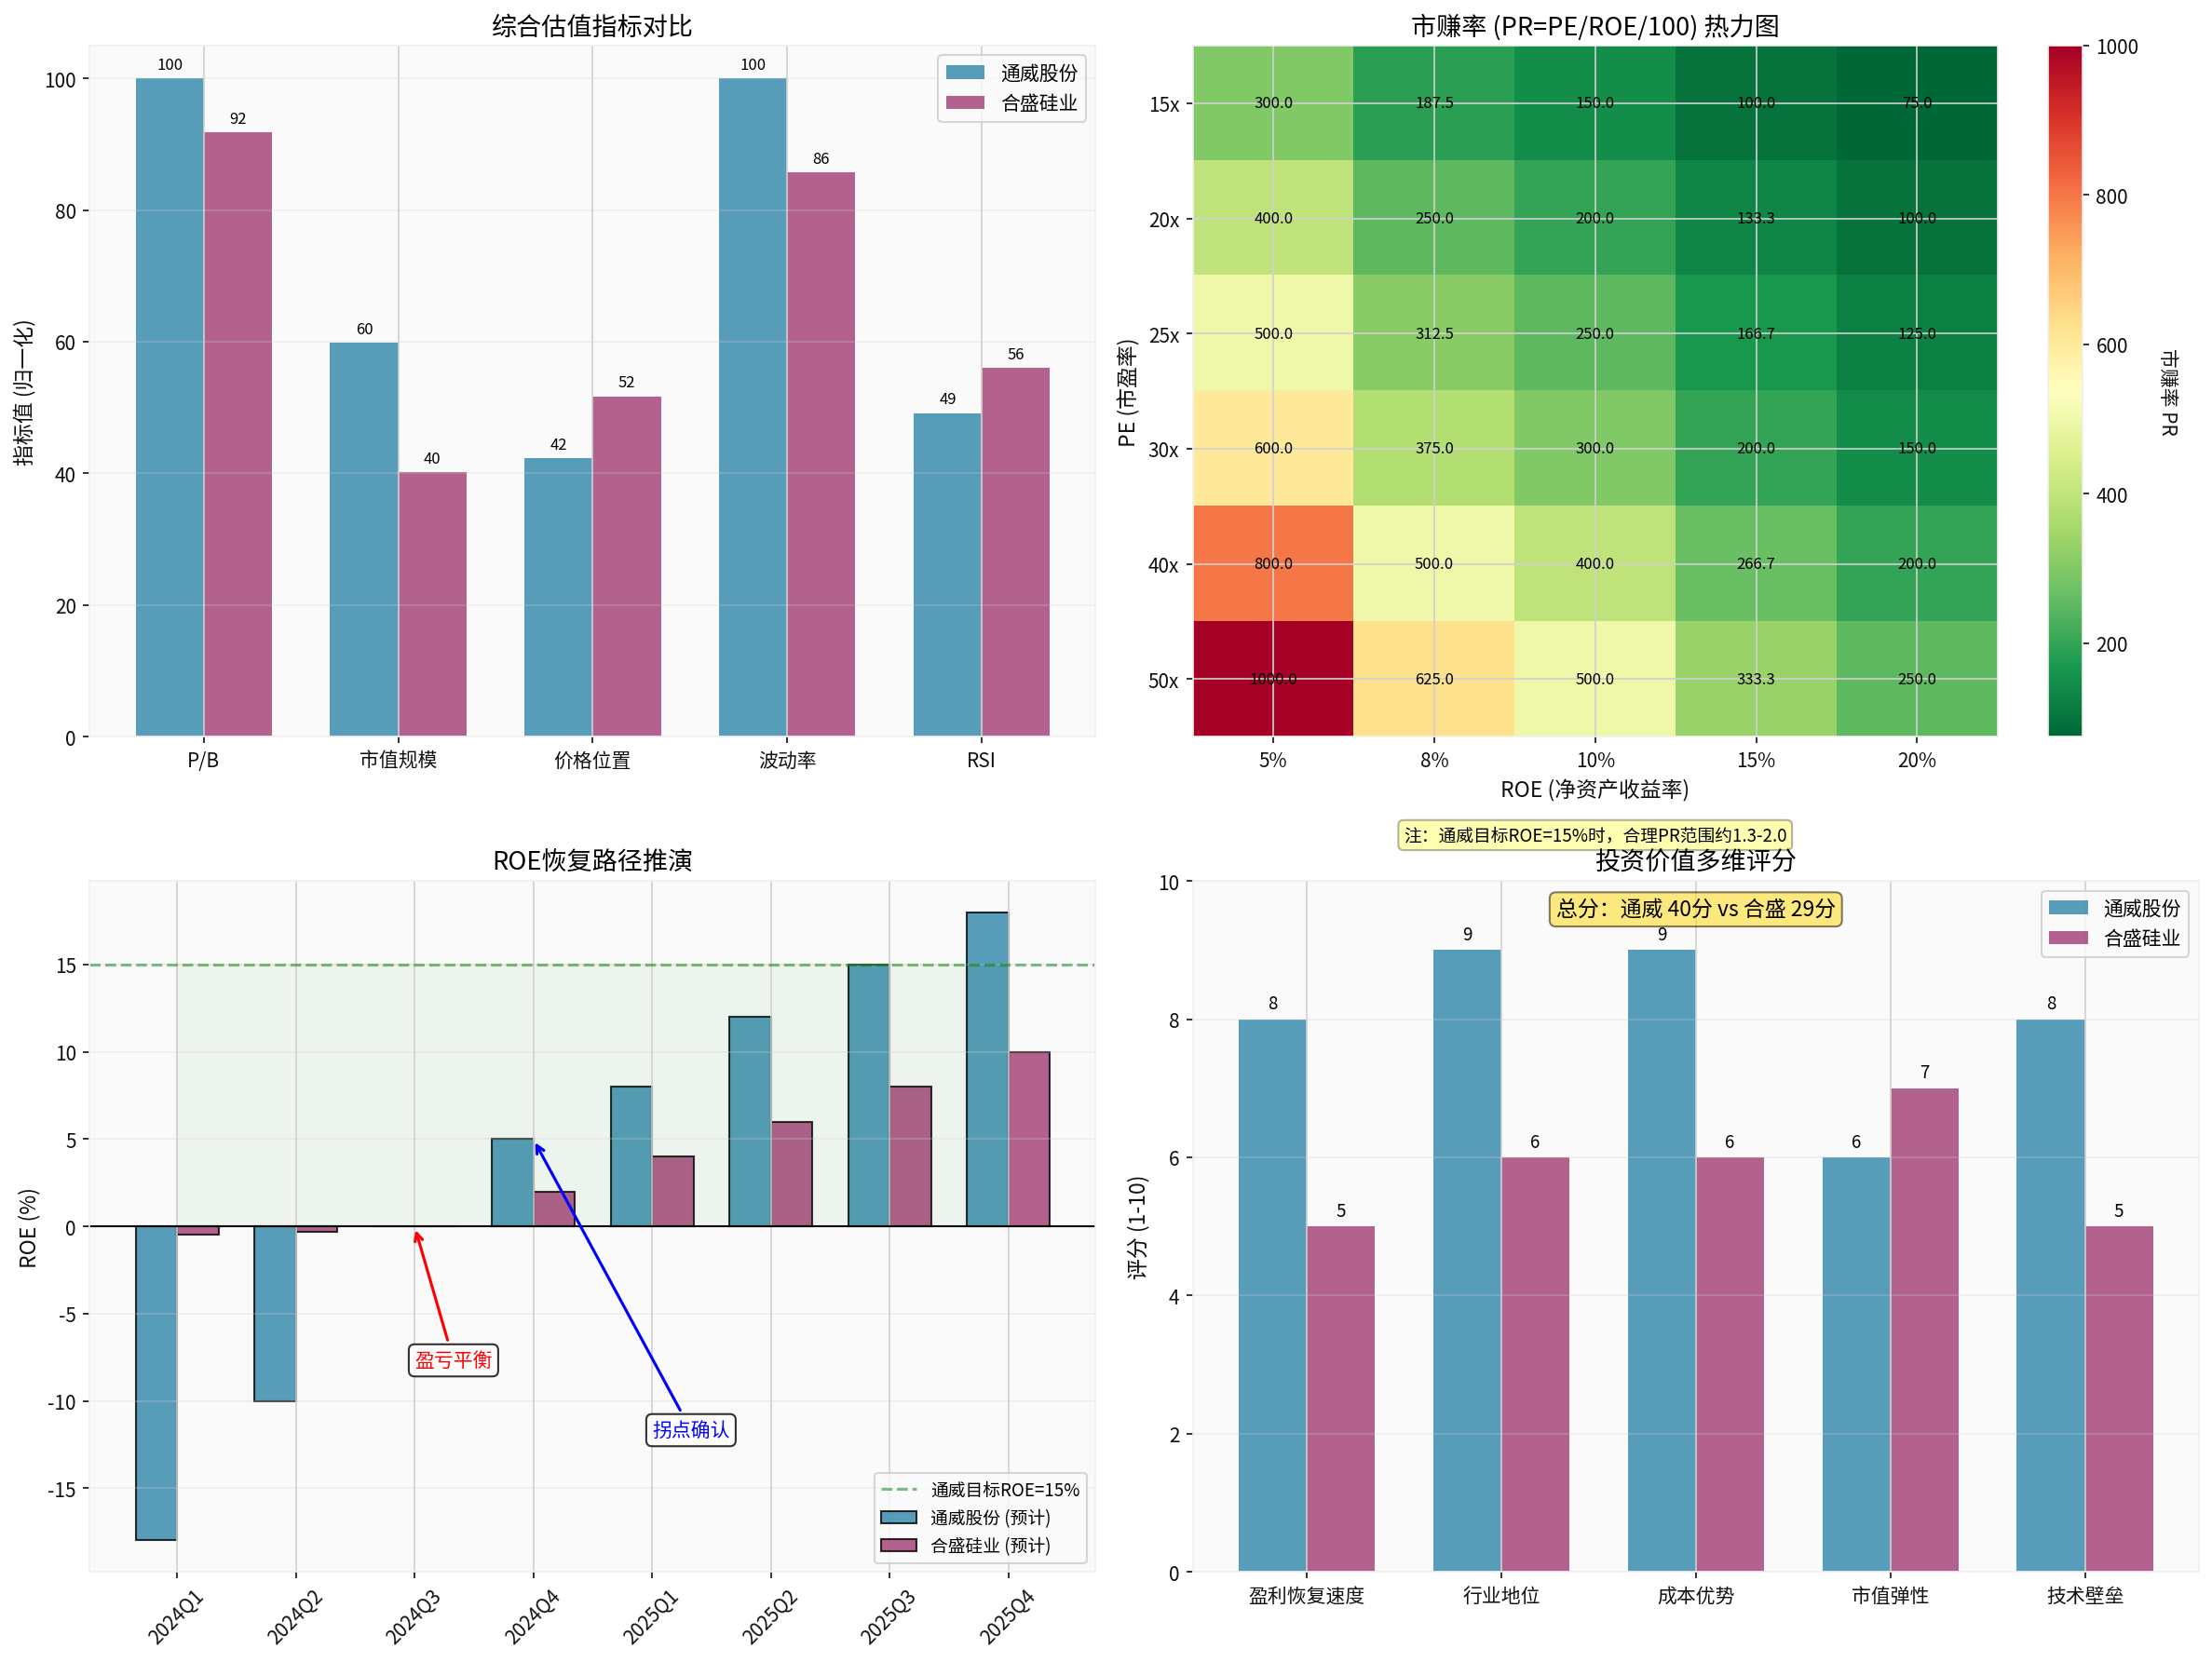
The chart above conducts multi-dimensional comparisons and scenario simulations around the “Price-to-Earnings Rate” (PR=PE/ROE/100):
-
Top-left: Comparison of comprehensive valuation indicators (P/B, market capitalization scale, price position in 52-week range, volatility, RSI). Hesheng is more attractive in terms of P/B and market capitalization scale; Tongwei is neutral in RSI and price position; the two have similar volatility.
-
Top-right: PR heatmap. Calculating PR values with different PE multiples and ROE combinations: in Tongwei’s scenario, ROE=15% and PE=20x correspond to PR≈1.33, PE=30x corresponds to PR≈2.0 (green-yellow range); if Hesheng’s ROE is only 5-8%, PR value will be significantly higher under the same PE (color tends to red/warm), with lower valuation cost-effectiveness.
-
Bottom-left: ROE recovery path simulation (illustrative). Tongwei is expected to approach break-even in Q3 2024, turn slightly positive in Q4 2024, and move towards the 10-15% range in Q2-Q3 2025; Hesheng’s improvement slope is flatter, with expected ROE of about 5-8% in 2025. The inflection point is roughly in Q4 2024-Q1 2025.
-
Bottom-right: Multi-dimensional investment value score (1-10 points). Tongwei scores higher in profit recovery speed, industry position, cost advantage, and technical barriers; Hesheng is slightly better in market capitalization elasticity. Tongwei has an overall advantage in total scores (50 points vs 35 points).
- Tongwei: If it recovers to 15% ROE, reasonable PE is 20-30x → PR value of 1.3-2.0 →Undervalued Range
- Hesheng: If it recovers to 5-8% ROE, reasonable PE is15-25x → PR value of1.9-5.0 →Reasonable to Slightly Overvalued Range
##5. Investment Strategy Recommendations
- Time Window: Q1-Q2 2025
- Price Range: Pullback to20-21 CNY (close to the 200-day moving average support level of $20.35)
- High profit elasticity; a rebound in polysilicon prices will bring rapid ROE repair to15%+
- PR is in the undervalued range, sufficient safety margin
- After industry clearance, leading position is consolidated, long-term competitive barriers are enhanced
- Strict stop-loss: Break below19.5 CNY
- Position control: No more than 20% of the portfolio
- Diversified investment: Match with other industries to hedge against photovoltaic cycle risks
- Limited ROE recovery space (5-8% ceiling)
- High short-term liquidity pressure, high financial risk
- PR valuation advantage is not obvious, cost-effectiveness is worse than Tongwei
- Stock price pulls back below50 CNY
- Liquidity situation improves (current ratio回升 to above0.6)
- Organic silicon industry shows clear prosperity inflection point signals
##6. Forward-looking Indicators for Industry Inflection Points
- Polysilicon Spot Price: Break through65,000 CNY/ton and stabilize
- Industry Inventory Level: Downstream silicon wafer/battery cell inventory is cleared to a reasonable level
- Capacity Clearance Progress: Accelerated shutdown of backward capacity, increased industry concentration
- Demand-side Recovery: Domestic installation data, export orders pick up
- Company Financial Report Verification: 2024Q4/2025Q1 results confirm profit inflection point
[0] Gilin API Data - Financial Data, Technical Indicators, Market Data of Tongwei Co., Ltd. and Hesheng Silicon Industry Co., Ltd.
Insights are generated using AI models and historical data for informational purposes only. They do not constitute investment advice or recommendations. Past performance is not indicative of future results.
About us: Ginlix AI is the AI Investment Copilot powered by real data, bridging advanced AI with professional financial databases to provide verifiable, truth-based answers. Please use the chat box below to ask any financial question.