Applicability and Risk-Return Analysis of the Dumbbell Strategy in the Chinese Market
Unlock More Features
Login to access AI-powered analysis, deep research reports and more advanced features
About us: Ginlix AI is the AI Investment Copilot powered by real data, bridging advanced AI with professional financial databases to provide verifiable, truth-based answers. Please use the chat box below to ask any financial question.
Based on my analysis of existing research materials and market data, I will systematically answer your questions about the applicability of the dumbbell strategy in the A-share market and its Sharpe Ratio performance.
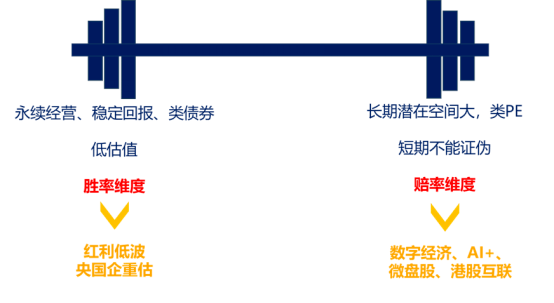
The dumbbell strategy is an investment portfolio construction method whose core idea is to allocate funds to two extreme asset classes while
- One end: Allocate defensive assets with high certainty, high dividends, and low volatility (e.g., banks, utilities, high-dividend blue chips)
- The other end: Allocate offensive assets with high growth and high volatility (e.g., AI, semiconductors, new energy and other tech growth stocks)
- Avoid: Medium-risk, medium-return “mediocre assets”
The theoretical support for this strategy includes [1]:
- Convexity effect: Through an extreme asset portfolio, asymmetric returns can be obtained in different market environments
- Volatility diversification: The correlation between the two ends of assets is usually low, which can effectively diversify portfolio risks
- Liquidity advantage: Short-term assets provide liquidity, while long-term assets enhance returns
According to the latest market research, many institutional investors have adopted the dumbbell strategy in Hong Kong stocks and A-shares to balance portfolio risks, allocating both high-dividend assets and leading tech growth stocks [4]. The specific allocation directions recommended by institutions are:
- Defensive end: Finance, non-ferrous metals and other high-dividend blue chips
- Offensive end: AI, high-end manufacturing and other tech growth leaders [4]
This strategy is highly aligned with China’s current
- Traditional industries provide stable cash flow and dividend income
- Emerging tech industries offer long-term growth potential
From historical data, the A-share market indeed has
- The annual volatility of the A-share market is significantly higher than that of developed markets
- In high-volatility environments, traditional balanced allocation strategies often struggle to achieve ideal Sharpe ratios
- The dumbbell strategy, through two-end allocation, can obtain better risk-adjusted returns in volatile markets
The formula for Sharpe Ratio is [2]:
Where:
- Rp = Expected return of the portfolio
- Rf = Risk-free rate
- σp = Standard deviation (volatility) of the portfolio
- For every unit of risk taken, more than one unit of excess return is obtained
- It belongs to excellent risk-adjusted return performance
Based on investment theory and Chinese market characteristics, I believe that
- Recommended experience ratio: 50% defensive end +50% offensive endor dynamic adjustment according to market environment
- Defensive end: Annual return target of 6-8%, volatility of10-15%
- Offensive end: Annual return target of15-25%, volatility of25-40%
The key to the dumbbell strategy achieving a high Sharpe Ratio lies in the
- The correlation between high-dividend assets (banks, utilities) and tech growth stocks is usually low
- They complement each other in different economic cycles: the defensive end is stable in economic downturns, and the offensive end bursts in economic upturns
- Dynamic adjustment: Adjust the proportion of the two ends according to market valuation and macro environment
- Regular rebalancing: When one end rises too much, properly take profits and increase holdings of the undervalued end
- This active management can significantly improve the risk-adjusted return of the portfolio
Assume the following dumbbell portfolio is constructed:
- 50% high-dividend blue chips: Expected annual return of8%, volatility of12%
- 50% tech growth stocks: Expected annual return of20%, volatility of30%
- Correlation coefficient:0.3 (moderate correlation between the two ends of assets)
Portfolio expected return =0.5×8% +0.5×20% =
Portfolio volatility = √(0.5²×12² +0.5²×30² +2×0.5×0.5×0.3×12×30) ≈
Assuming the risk-free rate is 3%:
This simulation result shows that a simple 50/50 allocation
###3. Key Strategies to Improve Sharpe Ratio
To achieve
####(1) Optimize Allocation Ratio
Determine the optimal ratio through the mean-variance optimization model. Experience shows that in the A-share environment, it may be necessary to
####(2) Select High-quality Stocks
- Defensive end: Choose high-quality companies with stable ROE, high dividend yield, and reasonable valuation
- Offensive end: Choose industry leaders with core competitiveness and strong growth certainty
- Stock selection has far greater impacton the Sharpe Ratio than allocation ratio
####(3) Application of the “10/40/50” Cognitive System
The
- Stock selection accounts for 10%: Select truly high-quality targets
- Betting strategy and fund management account for40%: Control risks through reasonable position management, stop-loss and take-profit, and batch position building
- Psychology accounts for50%: Maintain rationality, avoid chasing ups and downs, be greedy when the market is panicking, and panic when the market is greedy
##4. Risks and Challenges of the Dumbbell Strategy
###1. Main Risks
- Timing risk: If you build positions in the offensive end at high points, you may face large retracements
- Style drift: When the market style is extreme, one end may underperform for a long time
- Management difficulty: Requires continuous tracking and dynamic adjustment, with high professional requirements for investors
###2. Special Challenges in the Chinese Market
- Policy risk: A-shares are greatly affected by policies, especially tech stocks
- Liquidity risk: Some growth stocks have insufficient liquidity, making it difficult to increase or decrease positions
- Valuation volatility: A-share valuation volatility is large, requiring stronger psychological resilience
##5. Practical Recommendations for Achieving Sharpe Ratio >1.0
Based on the above analysis, to achieve a Sharpe Ratio >1.0 through the dumbbell strategy in the high-volatility A-share environment, it is recommended:
###1. Portfolio Construction Principles
Defensive side (40-60%):
- Banks (high dividend, low valuation)
- Utilities (stable cash flow)
- Consumer leaders (brand moat)

Offensive side (40-60%):
- AI industry chain (computing power, applications)
- High-end manufacturing (semiconductors, new energy)
- Innovative medicine (R&D breakthroughs)
###2. Dynamic Management Rules
- Valuation trigger: When the average PE of the offensive end exceeds the historical 80th percentile, reduce the allocation to30%
- Retracement control: The maximum retracement of a single stock does not exceed 20%, and the overall portfolio retracement does not exceed15%
- Rebalancing frequency: Quarterly or semi-annual rebalancing to avoid over-trading
###3. Risk Management
- Maximum retracement limit: Set a maximum retracement red line of15-20%
- Position management: A single stock does not exceed10%, and a single industry does not exceed30%
- Hedging tools: Properly use stock index futures or options to hedge systemic risks
##6. Conclusion
###Core Views
-
The dumbbell strategy has high applicability in the A-share market, which aligns with the current economic transformation and structural market characteristics
-
Achieving a Sharpe Ratio >1.0 is possible but challenging. It requires:
- Selecting high-quality stocks (stock selection ability)
- Scientific fund management and betting strategy (40% weight)
- Strong psychological quality and discipline (50% weight)
-
The core of success lies not in the strategy itself, but in execution. As your “system guardian” concept mentions, the core competitiveness of investment lies in:
- In-depth understanding of the nature of business
- The determination to integrate knowledge and action
- Systematic risk management
-
In the AI era, information collection is no longer the core competitiveness. The real advantages lie in:
- How to process and interpret information
- How to build and execute systems
- How to manage one’s own psychology and behavior
###Implementation Path
If you want to achieve a Sharpe Ratio >1.0 through the dumbbell strategy, it is recommended:
- Build a quantitative system: Regularize and systemize stock selection, allocation, and rebalancing rules
- Strictly implement discipline: Avoid emotional decisions and adhere to established rules
- Continuously optimize and iterate: Review regularly and adjust strategy parameters according to market changes
- Manage psychological expectations: Accept short-term volatility and focus on long-term compound interest
##References
[0] Jinling API Data (A-share market data, investment strategy analysis)
[1] Investopedia - “Understanding the Barbell Investment Strategy: High-Risk and Safe Assets” (https://www.investopedia.com/articles/investing/013114/barbell-investment-strategy.asp)
[2] Investopedia - “Sharpe Ratio: Definition, Formula, and Examples” (https://www.investopedia.com/terms/s/sharperatio.asp)
[3] Yahoo Finance Hong Kong - “Buy More as It Drops! HK Stock Low Valuation Triggers Frenzy, Southbound Funds Swept This Year…” (https://hk.finance.yahoo.com/news/越跌越買-港股低估值引爆資金瘋搶潮-南向資金今年來狂掃近兆港元創紀錄-023544705.html)
[4] Yahoo Finance Hong Kong - “Shanghai Composite Breaks 3900 Points Again After Decade! Chinese Assets Are Chased During National Day & Mid-Autumn Long Holiday…” (https://hk.finance.yahoo.com/news/滬指睽違十年再漲破3900點-中國資產在國慶中秋長假期間受追捧-科技股前景被看好-023013709.html)
[5] Wall Street Journal - “SHCOMP.CN | Shanghai Composite Index Stock Prices and Charts” (https://www.wsj.com/market-data/quotes/index/CN/SHCOMP/)
[6] Yahoo Finance Hong Kong - “Worried About US Stock Bubble? Study Shows Growth Stocks’ ROE Far Exceeds Value Stocks to Support High Valuations” (https://hk.finance.yahoo.com/news/擔心美股泡沫-研究顯示-成長股roe遠勝價值股-有助支持高估值-071442350.html)
[7] Bloomberg - “2025 Index Outlook: Stocks” (https://www.bloomberg.com/tc/blog/indices-2025-outlook-equity/)
Insights are generated using AI models and historical data for informational purposes only. They do not constitute investment advice or recommendations. Past performance is not indicative of future results.
About us: Ginlix AI is the AI Investment Copilot powered by real data, bridging advanced AI with professional financial databases to provide verifiable, truth-based answers. Please use the chat box below to ask any financial question.