Seres (601127.SH) In-depth Investment Value Analysis Report
Unlock More Features
Login to access AI-powered analysis, deep research reports and more advanced features
About us: Ginlix AI is the AI Investment Copilot powered by real data, bridging advanced AI with professional financial databases to provide verifiable, truth-based answers. Please use the chat box below to ask any financial question.
Related Stocks
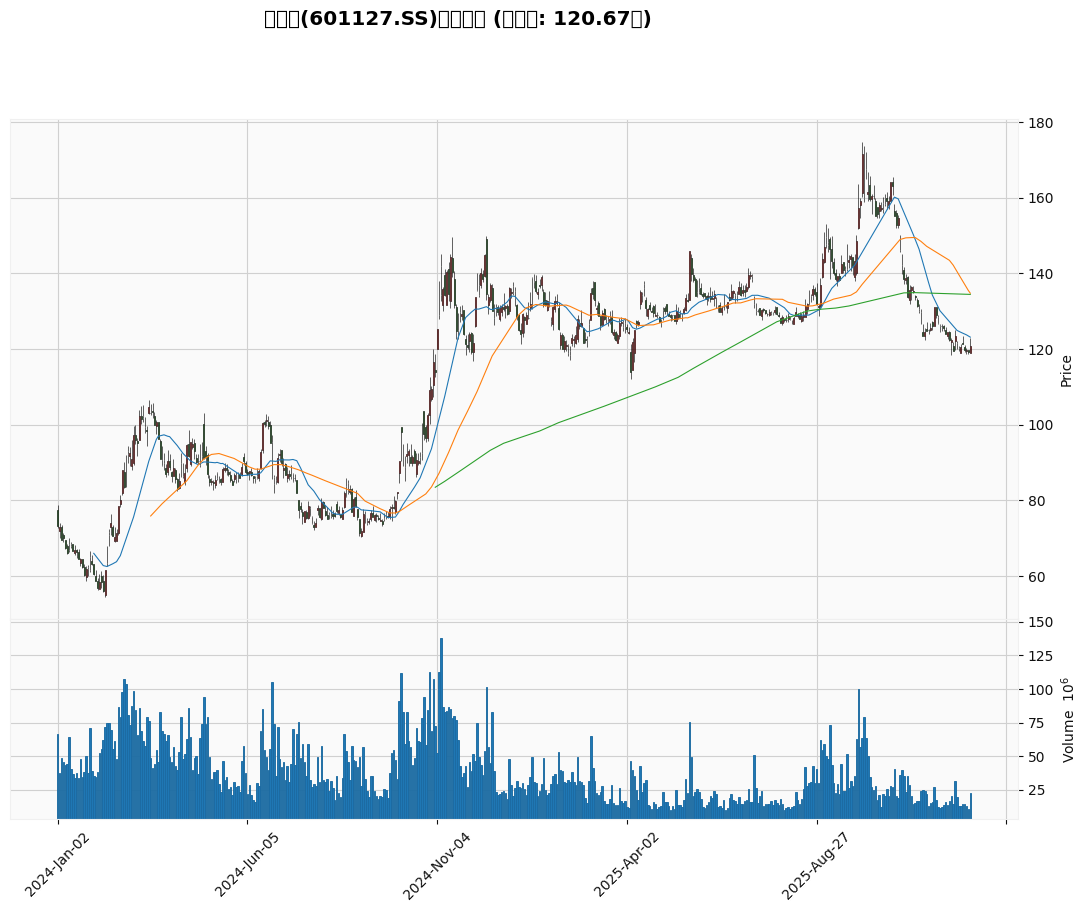
- Current Price: 120.67 yuan (2025-12-26 closing)
- 52-week Range: 112.14 - 174.66 yuan (another cycle interval high of 171.57 yuan)
- Retracement from 52-week high: approx. -30.9%; based on the highest price of 171.57 yuan in the recent 60 trading days, the cycle interval retracement is approx. -29.67% [0]
- Year-to-Date Performance: -6.12% (YTD), 1-Year: -10.48% [0]
Technicals show a sideways consolidation state:
- Trend Type: Sideways/no clear trend; core support and resistance are between 119.21 yuan and 123.14 yuan [0]
- Moving Average Structure: The price is running below the 20-day moving average (approx. 123.14 yuan), suppressed by the 50-day moving average (approx. 134.75 yuan) and the 200-day moving average (approx. 134.43 yuan) [0]
- Volatility: Average daily volatility of approx. 2.34% over the past 60 trading days, which is relatively high but no extreme risk signals have appeared [0]
- Latest Quarter (2025-10-31): EPS 1.45 yuan (vs. consensus expectation of 0.02 yuan, significantly exceeding expectations); revenue 48.13 billion yuan (vs. expectation of 27.55 billion yuan, significantly exceeding expectations) [0]
- Profitability: ROE approx. 32.11%, net profit margin 4.84%, P/E (TTM) approx. 27.30x [0]
- AITO M9 has delivered over 260,000 units cumulatively in 2 years since its launch; AITO M8 has delivered over 130,000 units cumulatively since its launch; total high-end/luxury models of AITO exceed 390,000 units (as of November 2025) [1]
- From January to November 2025, combined sales of AITO M8 and M9 were approx. 245,000 units [1]
- 2025 is regarded as the first year of L3 mass production. Huawei continues to iterate on high-speed/urban NOA and ADS systems. Seres is expected to benefit first from technology and ecosystem dividends [1, 3]
- Yinwang Intelligence (a subsidiary of Huawei’s Automotive Business Unit) has achieved rapid iteration of technology and products. Relevant collaboration with Seres is expected to strengthen its intelligent competitiveness [1]
- Layout for markets such as Europe and right-hand drive vehicle planning provide potential growth for the long term (overseas markets are still in the early stage of penetration) [1]
- The product matrix covers the price range of 220,000 to 590,000 yuan, providing coverage for different budgets and scenarios (e.g., iterations of M6 and M7, facelifts of M8/M9, etc.) [1]
- Domestic L3 penetration is expected to further increase in 2026. The rise in the proportion of high-level intelligent driving models will drive leading car companies and technology partners to benefit together [2, 3]
- Intelligence is one of the core themes of the automotive industry in 2025. Continuous improvement of policies and standards provides catalysis for the industry [2]
- Conservative Scenario Intrinsic Value: 1,399.22 yuan
- Base Scenario Intrinsic Value: 3,970.57 yuan
- Optimistic Scenario Intrinsic Value: 6,040.64 yuan
- Risk Note: The above results are highly sensitive to assumptions. It is recommended to focus on scenario and directional analysis, and not use them as a basis for specific trading target prices [0]
- P/E (TTM) approx. 27.30x, which is within the reasonable range of growth-oriented intelligent vehicle whole-vehicle targets (combining industry growth and company performance elasticity) [0]
- From a 3-year perspective, the cumulative stock price increase is significant (+190.07%), reflecting the realization of two previous strong drivers. The current retracement can be regarded as a rebalancing of valuation and sentiment [0]
- Weak sector capital flows: Recently, there has been capital outflow from optional consumption/automotive sectors, with hotspots shifting to commercial aerospace, PCB, etc. [1]
- Policy and competition: The pace of L3 penetration, FSD overseas policies, and accelerated electrification of traditional luxury brands may bring phased impacts [2]
- Production capacity and delivery: Whether demand for high-end models can continue to grow, supply chain stability, and cost control will affect profit realization [1]
- Overseas expansion: There are execution and uncertainties in channel layout, brand awareness, and compliance promotion [1]
- Core Advantages: High ROE (32.11%), performance exceeding expectations, strong drivers of high-endization and intelligence, L3 penetration and overseas expansion opening up incremental space [0, 1]
- Valuation and Safety Margin: Retracing nearly 30% from the 52-week high, valuation has fallen to a more reasonable range, providing a “rebalancing” opportunity for medium-to-long-term allocation [0]
- Current Phase: Observation-based allocation (technicals have not escaped sideways movement). Small positions can be deployed with controlled rhythm
- Confirmation Signal: After breaking through short-term resistance (approx. 123 yuan) with volume and stabilizing above the 20-day moving average, gradually increase positions
- Ideal Buying Point: Left-side opportunity when retracing to the support range (around 118-119 yuan) with shrinking trading volume and continued positive fundamental verification
- Short-term (1-2 quarters): Quarterly financial report verification (EPS, revenue, gross margin, expense ratio) is the core driving factor. Exceeding expectations will repair valuation sentiment [0]
- Medium-term (2026): L3 penetration and continuous growth of high-end models, overseas and new product contributions, are expected to drive both ROE and revenue quality to rise [1, 2]
- Long-term (2-3 years): Intelligent competition shifts from “price war” to “value war”. Targets with higher technology and brand premium are more likely to obtain valuation premium [1]
- [0] Gilin API Data (stock price, finance, technology, valuation, and transaction data)
- [1] East Money · Snowball Column: Under the high growth expectation of the L3 intelligent luxury car track, the underlying support for Seres’ high revenue and net profit growth (including sales and profit data, Yinwang Intelligence, overseas markets, etc.) https://caifuhao.eastmoney.com/news/20251219124745165221510
- [1a] Chejiahao: Five Domains Compete! HarmonyOS Intelligent Mobility 2026 New Energy Market Battle (AITO matrix, sales targets, and new product rhythm) https://chejiahao.autohome.com.cn/info/24596151
- [1b] Xcar: Chinese Automotive Market: Review of 2025’s Glory, Outlook of 2026’s Trends (AITO M9/M8 sales data and cumulative sales of high-end models) https://aikahao.xcar.com.cn/item/3725982.html
- [2] Soochow Securities Research Report: 2025 Investment Strategy for Automotive Intelligence (L3 penetration and policy outlook, intelligent driving access and FSD entry into China) https://pdf.dfcfw.com/pdf/H3_AP202412081641219266_1.pdf?1733653259000.pdf
- [3] 36Kr: The First Year of L3 Autonomous Driving Mass Production (policy access, car companies’ L3 mass production plans, and industry progress) https://eu.36kr.com/zh/p/3599213505937928
Insights are generated using AI models and historical data for informational purposes only. They do not constitute investment advice or recommendations. Past performance is not indicative of future results.
About us: Ginlix AI is the AI Investment Copilot powered by real data, bridging advanced AI with professional financial databases to provide verifiable, truth-based answers. Please use the chat box below to ask any financial question.