Analysis of Investment Logic and Operation Strategies for Hong Kong Stock Oil & Gas Blue Chips and Internet Leaders
Unlock More Features
Login to access AI-powered analysis, deep research reports and more advanced features

About us: Ginlix AI is the AI Investment Copilot powered by real data, bridging advanced AI with professional financial databases to provide verifiable, truth-based answers. Please use the chat box below to ask any financial question.
Related Stocks
Based on in-depth analysis of Hong Kong stock oil & gas blue chips and internet leaders, I will elaborate on them from two dimensions: investment logic and operation strategies.
-
Valuation Depression Advantage
- Current P/E is only 7.2x, P/B is 1.12x, at a historical low [0]
- Valuation discount is significant compared to global oil & gas giants
- Dividend yield is attractive, suitable for long-term holding
-
Sound Financial Quality
- Net profit margin of 31.83%, indicating industry leadership [0]
- ROE of 16.65%, high return on capital [0]
- Healthy balance sheet, low debt risk [0]
- Abundant free cash flow, providing a basis for high dividends
-
Industry Cycle & Policy Dividends
- China’s energy security strategy supports upstream exploration and development
- Oil prices remaining in a relatively high range supports profitability
- Large room for valuation repair under the background of state-owned enterprise reform
- Oil price volatility risk
- Geopolitical uncertainty
- Obvious industry cyclical characteristics
-
Valuation Repair Trend
- Cumulative increase of over 100% in 2024, valuation repaired from historical low [0]
- Current P/E is 24.53x, still attractive considering profitability [0]
- Improved regulatory environment, market sentiment is recovering
-
Business Diversification & AI Transformation
- Net profit margin of 29.93%, ROE of 20.29%, excellent profit quality [0]
- Four pillar businesses: games, advertising, fintech, cloud services
- AI large model layout opens new space for future growth
-
Deep Moat
- WeChat ecosystem has a solid user base
- Sufficient cash reserves, strong investment capabilities
- Excellent management team, strong strategic execution
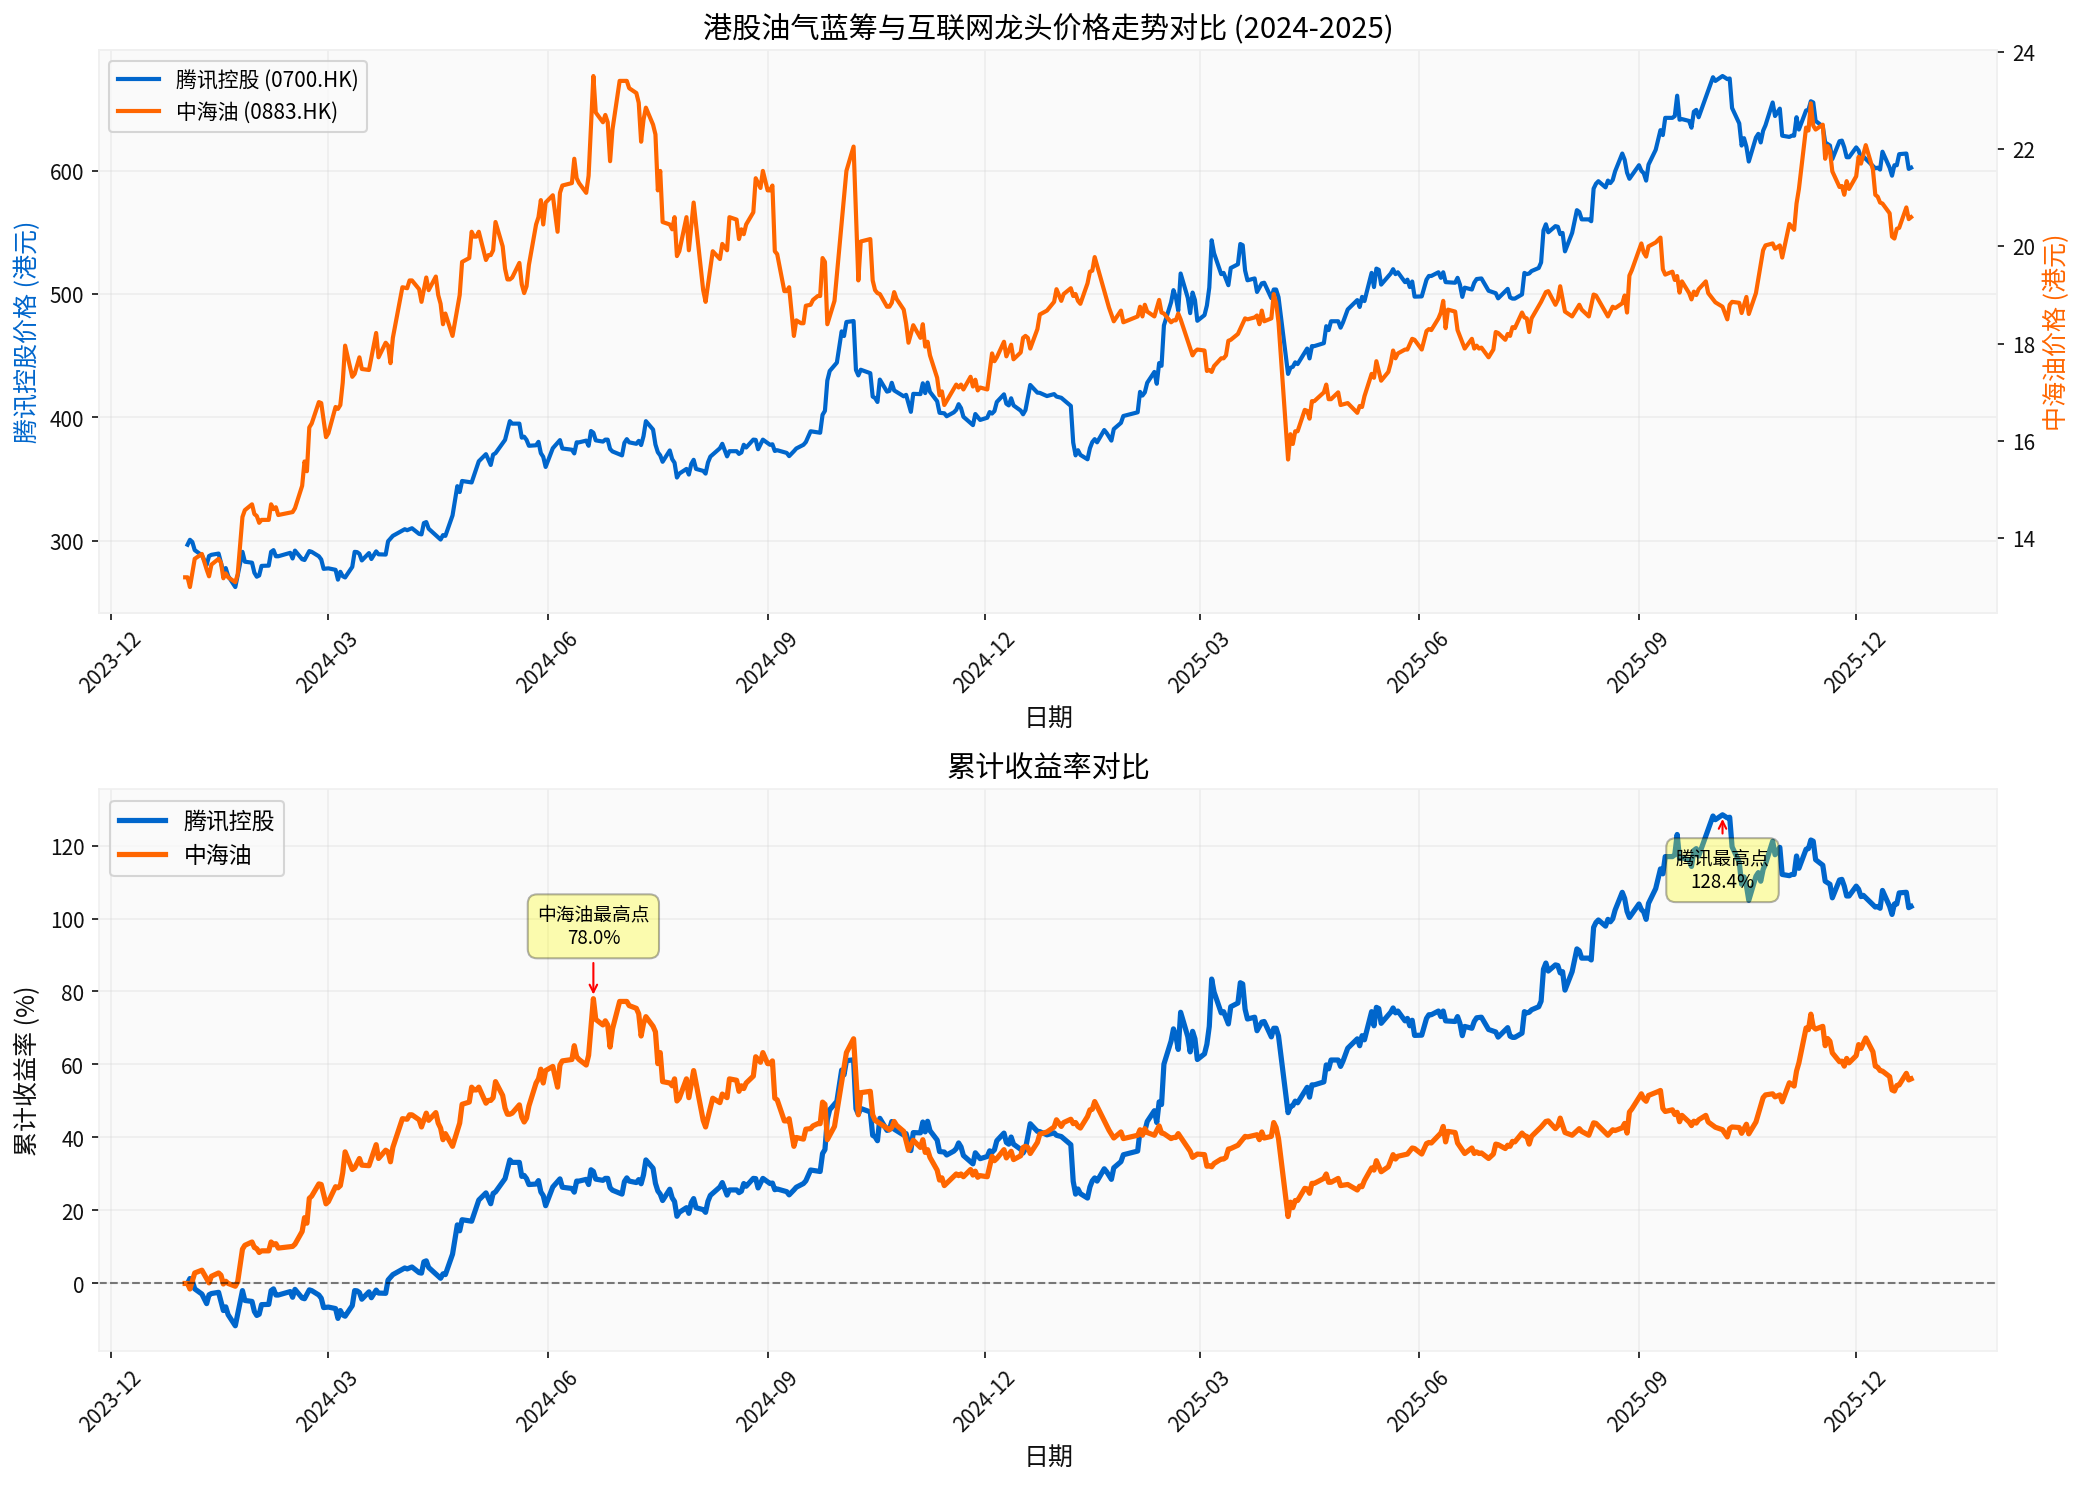
Chart shows: Tencent’s 2024 increase was 103.3%, CNOOC’s was 56.06%, with different upward rhythms and volatility characteristics [0]
- Regulatory policy uncertainty
- Macroeconomic impact on advertising and consumer businesses
- Need for fundamental support after valuation repair
Core Holdings (60-70%):
- CNOOC: 30-40% (Value Investment Target)
- Tencent Holdings: 30-40% (Growth Value Target)

Satellite Positions (30-40%):
- Industry rotation opportunities (ports, coal, etc.)
- Emerging theme investments (AI, new energy, etc.)
- Short-term band operation targets
- Value investment capital: Long-term locked, not easily changed
- Band operation capital: Flexible use, quick in and out
- Cash reserves: Maintain 10-20% to respond to market opportunities
- Reasonable valuation: P/E below industry average or historical median
- Sound finance: ROE>15%, reasonable asset-liability ratio
- Stable dividends: Dividend yield>3% or large growth potential
- Moat: Industry leader, obvious competitive advantage
- Core holdings: Long-term holding for 2-5 years
- Regular evaluation: Re-evaluate after quarterly financial reports
- Dynamic adjustment: Moderately adjust positions based on fundamental changes
Based on technical analysis results [0]:
- Tencent Holdings: Currently in a sideways consolidation state, trading range [597.14, 608.86] HKD
- CNOOC: Also in sideways consolidation, trading range [20.37, 21.03] HKD
- Beta values: Tencent 0.85, CNOOC 0.33 (relative to Hang Seng Index) [0]
- Break through key resistance level with volume
- RSI rebounds after oversold
- MACD golden cross and KDJ resonance upward
- Fundamental positive catalysts
- Technical indicator divergence
- Price rises with shrinking volume
- Close to historical resistance level
- Excessive short-term increase
- Maximum position for a single stock does not exceed 40%
- Band operation position for a single stock does not exceed 20%
- Keep sufficient cash to respond to additional opportunities
- Value investment: Stop loss only when fundamentals deteriorate
- Band operation: Immediate stop loss when technical breakdown occurs (-5% to -8%)
- Time stop loss: Band operation does not meet expectations for more than 2 weeks
- Partial profit-taking: Reduce position by 50% when target price is reached
- Trailing stop: Take profit when there is a 10% pullback after profit
- Sentiment profit-taking: Reduce position when market is overheated
- Oil & Gas Sector(weight:30-40%): CNOOC as core allocation, pay attention to oil price trends
- Internet Leaders(weight:30-40%): Tencent as core, pay attention to AI and business progress
- High Dividend Stocks(weight:20-30%): Defensive varieties like ports, coal
- Cash Reserves(weight:10-20%): Respond to market fluctuations and opportunities
- Q1: Annual report season, focus on performance exceeding expectations opportunities
- Q2: After Two Sessions, focus on policy catalysis opportunities
- Q3: Interim report season, verify fundamental logic
- Q4: Year-end valuation switch, layout for next year
- Discipline: Strictly implement trading discipline, not swayed by market sentiment
- Patience: Value investment needs time to verify, band operation needs to wait for opportunities
- Learning: Continuously research industries and companies to improve cognitive level
- Risk Control: Always put risk control first
- [0] Jinling API Data - Stock prices, financial indicators, technical analysis
- [1] CNBC - “UBS: How to Prepare for Shocks and Growth Opportunities in 2026” (https://www.cnbc.com/2025/12/22/prepare-your-portfolio-for-shocks-growth-opportunities-in-2026-per-ubs.html)
- [2] Yahoo Finance - “Kwok Sze Chi: The Market Seems to Want to Further Test the 100-Day and 50-Day Moving Averages” (https://hk.finance.yahoo.com/news/郭思治-大市似欲進-步上試100天及50天線-020603805.html)
Insights are generated using AI models and historical data for informational purposes only. They do not constitute investment advice or recommendations. Past performance is not indicative of future results.
About us: Ginlix AI is the AI Investment Copilot powered by real data, bridging advanced AI with professional financial databases to provide verifiable, truth-based answers. Please use the chat box below to ask any financial question.