In-depth Analysis of Thermal Power Enterprise Transformation and Electricity Market Reform
Unlock More Features
Login to access AI-powered analysis, deep research reports and more advanced features
About us: Ginlix AI is the AI Investment Copilot powered by real data, bridging advanced AI with professional financial databases to provide verifiable, truth-based answers. Please use the chat box below to ask any financial question.
Related Stocks
Since 2025, China’s electricity market reform has entered a stage of comprehensive deepening, with core policy orientations showing the following characteristics:
- The annual contract bottom line for thermal power enterprises has dropped from 70% to 60%, and the active contracting strategy has shifted from pursuing excess returns tominimum guarantee contracting
- From January to November 2025, the national electricity market trading volume reached 6.03 trillion kWh, an increase of 7.6% year-on-year, accounting for 63.7% of the全社会用电量 [1]
- Medium and long-term trading volume was 5.77 trillion kWh, spot trading volume was 261.3 billion kWh, and green power trading volume was 296.7 billion kWh (a year-on-year increase of 41.3%) [1]
- The “Notice on Deepening the Market-oriented Reform of New Energy Grid-connected Electricity Prices and Promoting High-quality Development of New Energy” issued in early 2025 marks the transformation of new energy power station revenue models from fixed electricity prices to market-oriented trading [2]
- The implementation rules of various provinces show regional differentiation trends. Taking Shandong as an example, the photovoltaic mechanism electricity price is 0.225 yuan/kWh, and the wind power price is 0.319 yuan/kWh, which are 43% and 19% lower than the coal power benchmark price of 0.3949 yuan/kWh respectively [3]
- Thermal power enterprises have reflected stable profits from capacity prices and auxiliary services in their financial statements [2]
- Huaneng International’s auxiliary service revenue such as peak and frequency regulation in 2024 totaled 2.7 billion yuan, an increase of 85% year-on-year; China Shenhua’s thermal power auxiliary service revenue in the first half of 2025 reached 320 million yuan [3]
- Starting from 2026, Guangdong will share the excess part of the monthly average wholesale-retail price spread of power sales companies higher than 0.01 yuan/kWh with users at a 1:9 ratio[2]
- Regions such as Henan, Shaanxi, Anhui, Jiangxi, and Sichuan have also issued price limit policies, and the policy orientation is clearly tilted towards the user side
- The proportion of market-oriented trading volume in Guangdong has reached 82%, forming a complete system of “annual long-term contracts + monthly bidding + spot real-time trading” [4]
- Central and western provinces such as Shaanxi and Anhui are in the transition period, with time-of-use trading revenue sharing mechanisms in place
Traditional thermal power enterprises are undergoing profound functional positioning changes, transforming from
- Electricity Revenue: The proportion gradually decreased from 98% in 2020 to an expected 55% in 2025, and will further drop to 47% in 2026
- Capacity Price: Accounted for about 15% of total revenue in 2024, and is expected to rise to 18-20% from 2025 to 2026
- Auxiliary Services: The proportion increased from 2% in 2020 to 10% in 2024, and is expected to reach 15% in 2026
- Spot Price Spread Arbitrage: An emerging business, accounting for about 15% in 2025 and expected to increase to 18% in 2026
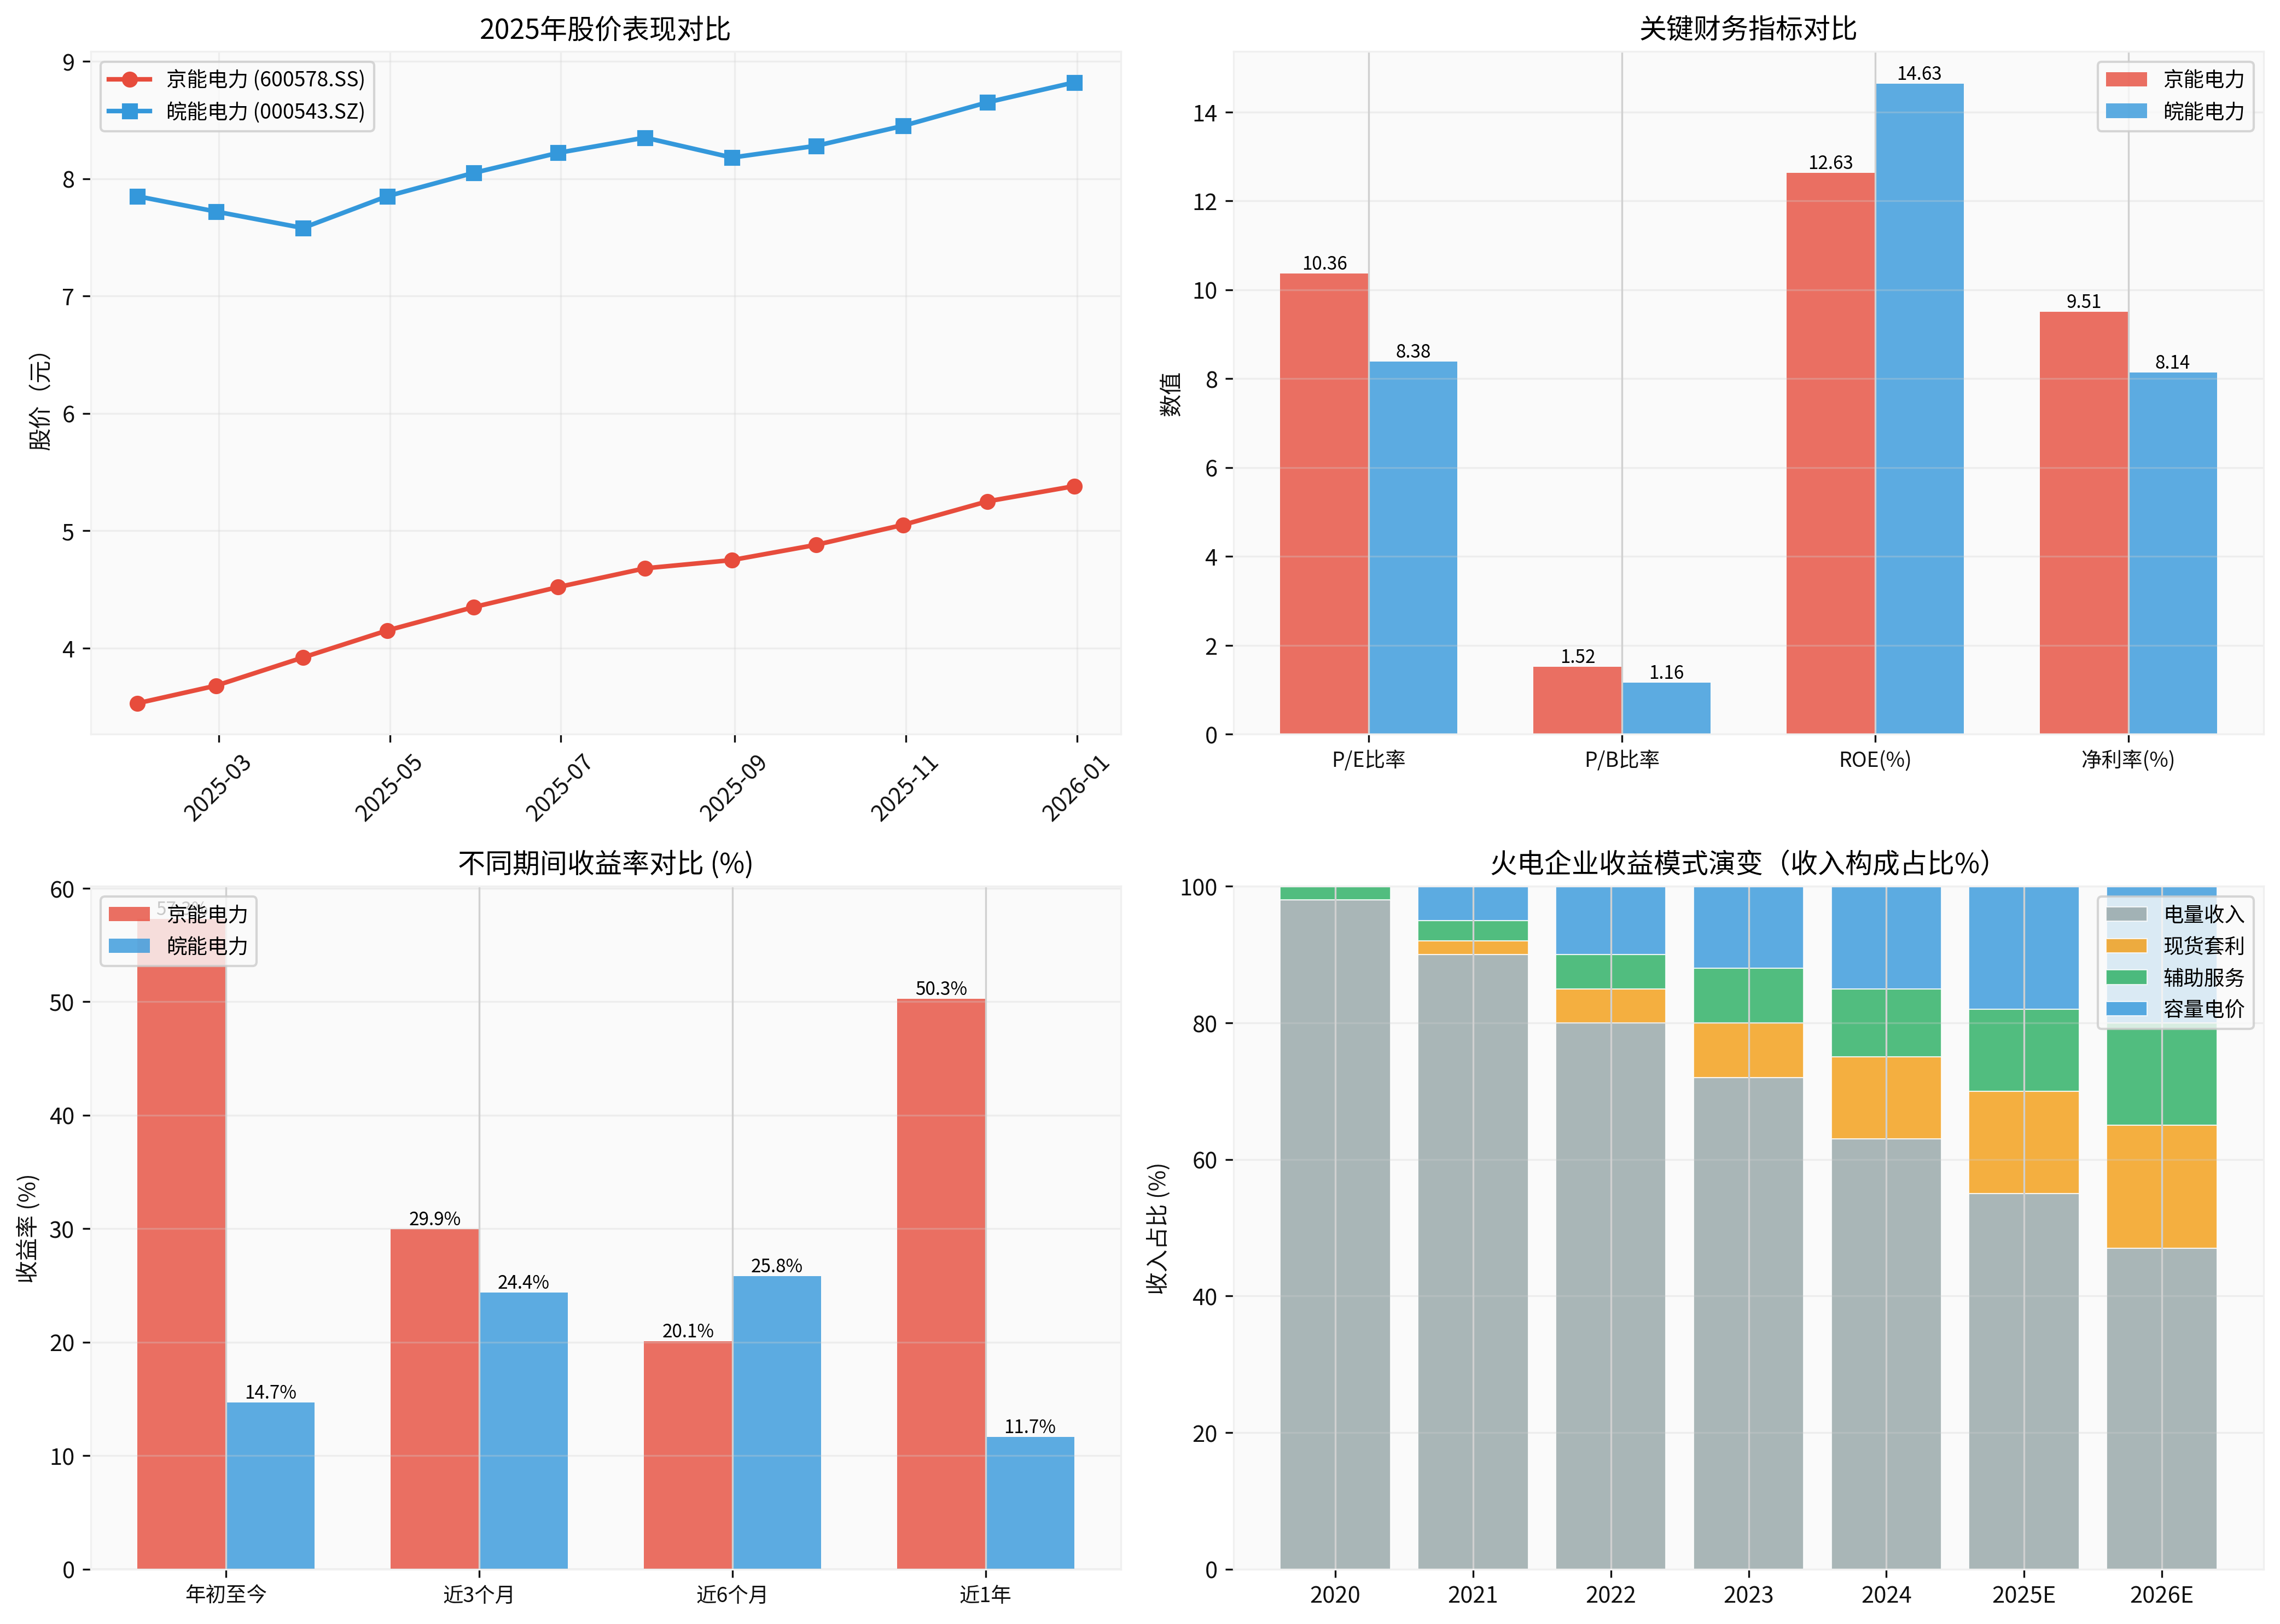
- 2025 Stock Price Performance: Up+52.41%year-to-date, with excellent performance [0]
- Valuation Level: P/E 10.36x, P/B 1.52x, lower than the industry average but reflecting growth expectations [0]
- Profitability: ROE 12.63%, net profit margin 9.51%, conservative financial attitude [0]
- Financial Health: Latest free cash flow of 1.272 billion yuan, debt risk classified as high but controllable [0]
- 2025 Stock Price Performance: Up+12.36%year-to-date, relatively moderate [0]
- Valuation Level: P/E 8.38x, P/B 1.16x, more attractive valuation [0]
- Profitability: ROE 14.63% (higher than Jingneng), net profit margin 8.14% [0]
- Financial Health: Negative free cash flow (-1.840 billion yuan), reflecting capital expenditure pressure, debt risk classified as high [0]
- Capacity Price Provides Stable Revenue: Coal-fired units receive capacity compensation, alleviating operational difficulties [3]
- Expansion of Auxiliary Service Market: The value of system services such as deep peak regulation and standby is highlighted, and large coal-fired enterprises’ auxiliary service revenue increased significantly in 2024 [3]
- Room for Improvement from Declining Coal Prices: In 2025, the thermal coal price at Jingtang Port dropped to 823 yuan/ton, a weekly decrease of 1.0% [2]
- Advantages of Flexibility Transformation: Units with scale advantages and strong regulating performance have more competitive advantages [3]
- Decline in Utilization Hours: In 2024, the utilization hours of national coal-fired power generation equipment were 4,628 hours, a year-on-year decrease [3]
- Electricity Price Pressure: In regions rich in wind and solar resources such as Inner Mongolia, Beijing-Tianjin-Hebei, the on-grid electricity prices of thermal power units are in a downward state [3]
- Loss of Peak Regulation Efficiency: Decreased load rate leads to lower boiler efficiency and increased carbon emission costs [3]
- Pressure from Transformation Costs: Flexibility transformation and low-carbon construction require a large amount of capital investment [3]
Thermal power enterprises are transforming from traditional cyclical industries to
- Improved Profit Stability: Capacity prices + auxiliary services provide stable cash flow, reducing performance volatility
- Enhanced Dividend Expectations: After the diversification of profit models, cash flow is more predictable, supporting high dividend strategies
- Applicability of P/B Valuation Method: As a capital-intensive industry, net asset value becomes an important valuation anchor
- Regional Leaders(such as Jingneng Power): Enjoy dual premiums of “public utility + growth”, with a stock price increase of 57.31% in 2025 [0]
- Local Enterprises: Face multiple challenges such as capital scale, technical level, and bidding capacity, making transformation difficult [3]
- Central Enterprise Advantages: Can rely on the injection of high-quality projects from the group parent company, and their low-carbon transformation performance is better than local enterprises [3]
- Proportion of capacity price revenue
- Growth rate of auxiliary service revenue
- Progress of flexibility transformation
- Regional power supply and demand pattern
New energy enterprises have bid farewell to fixed subsidies since 2025 and entered the stage of full market pricing, facing three major challenges:
- Electricity Price Downward Pressure: Shandong’s photovoltaic mechanism electricity price is 0.225 yuan/kWh (43% lower than the benchmark price), and wind power is 0.319 yuan/kWh (19% lower) [3]
- Frequent Occurrence of “Zero Electricity Price” or “Negative Electricity Price”: In some provinces, the electricity market has accumulated nearly 3,000 hours of “zero electricity price” periods annually, and eastern large electricity-consuming provinces are also close to 2,000 hours [1]
- IRR Threshold Inversion: Taking Yunnan as an example, the centralized guidance price of 0.248 yuan/kWh decreased by 18% compared with 2023, and for the first time inverted with the central enterprise’s internal 6.5% IRR threshold [5]
The revenue model of new energy enterprises is shifting from single electricity dependence to a diversified structure of “
- Green Power Premium: From January to October 2025, the national cumulative trading volume of green certificates reached 596 million, and the trading price rose to 5.22 yuan per certificate [5]
- Increased Green Certificate Trading Scale: In 2024, the national green certificate trading volume was 446 million, an increase of 364% year-on-year [3]
- Mandatory Consumption for High-energy-consuming Industries: Policies clearly require mandatory consumption of green power by electrolytic aluminum, data centers, etc. [5]
- Decreased applicability of P/E valuation method, increased profit volatility
- Lowered project return expectations, affecting installed capacity growth expectations
- In 2025, many central enterprises abolished 80 photovoltaic index projects with a scale of over 11GW [5]
- Green power premium becomes an important revenue supplement, with the premium proportion of green power trading of leading enterprises reaching 22% [4]
- Accelerated subsidy recovery: Jinkai Xinneng and Solar Energy recovered subsidies in the first 8 months of 2025 reaching 190% and 170% of the full year of 2024 respectively [5]
- Valuation system restructuring towards “installed capacity + green certificate revenue + carbon asset value”
- Regions with high-quality wind and solar resources (such as the “Three Norths” region)
- High proportion of green power trading capacity
- Low capital cost (central enterprise background)
- Potential for “replacing small with large” transformation of existing assets (such as Longyuan Power) [5]
Power sales companies are undergoing a deep transformation from “
| Period | Main Profit Source | Wholesale-Retail Price Spread | Proportion of Value-added Services |
|---|---|---|---|
| Around 2020 | Spread Arbitrage | 0.1 yuan/kWh | <10% |
| Leading Enterprises in 2025 | Diversified Revenue | 0.03 yuan/kWh | >50% |
Data Source: Web Search [4]
- Green Power Trading Premium: 22%
- Virtual Power Plant Peak Regulation Revenue: 18%
- Wholesale-Retail Spread Revenue: <50%
- Other Value-added Services: 10%+
- Compressed spread space: The wholesale-retail spread decreased from 0.1 yuan/kWh to 0.03 yuan/kWh, and some provinces even experienced “zero spread” [4]
- Profit Sharing Mechanism: Sharing ratios such as 1:9 in Guangdong and 2:8 in Shaanxi are tilted towards the user side, compressing profit space [2]
- Intensified Market Competition: There are about 5,000 power sales companies nationwide, and more than 80% still take retail business as their core revenue source [4]
- Rise of Value-added Services: A new energy company in Shenzhen customized a “photovoltaic + energy storage + energy-saving transformation” solution for an electronic industrial park, reducing electricity costs by 30%, and the power sales company obtained diversified revenue from “electricity fees + service fees + carbon revenue” [4]
- Virtual Power Plant Aggregation: More than 14,000 registered entities participate in the peak regulation market to obtain new revenue sources [1]
- Regional Differentiation Opportunities: Regions with high marketization levels such as Guangdong and Jiangsu [4]
- Traditional P/E Method: Applicable to mature enterprises mainly engaged in retail business
- Platform Valuation Method: Applicable to integrated energy service providers that aggregate a large number of user resources
- User Value Method: ARPU per user × number of users × monetization capacity
Thermal power enterprises are transforming from cyclical stocks to
- Improvement of Capacity Price Mechanism: The proportion of capacity price revenue is expected to rise to 20% in 2026
- Expansion of Auxiliary Service Market: Increased richness of varieties such as peak regulation, frequency regulation, and standby
- Coal Prices Remain Low: Long-term coal contract policies continue to play a stabilizing role [1]
- Continuous decline in utilization hours
- Rising costs in the carbon market
- Unexpectedly high flexibility transformation costs
Under the pattern of “
- Resource Quality: Abandonment rate of wind/solar lower than the regional average
- Green Power Premium: Ability to bind high-energy-consuming customers
- Capital Cost: Central enterprise background or low financing cost platform
- Existing Asset Transformation: Potential for “replacing small with large” of old fields
Transformation from “spread arbitrage” to “
- User Scale: Stickiness and scale of industrial and commercial users
- Value-added Services: Proportion of businesses such as energy storage, energy-saving transformation, and carbon asset management
- Technical Capabilities: Load forecasting, market research, risk management and control levels
- Regional Advantages: Regions with high marketization levels such as Guangdong and Jiangsu
-
Thermal Power Enterprise Transformation: The shift from annual long-term contracts to monthly bidding is an inevitable trend, but capacity prices and auxiliary services provide a profit “safety pad”, andpublic utilitywill promote a systematic rise in valuation centers [2][3]
-
Challenges for New Energy Enterprises: Market-oriented pricing after Circular No.136 brings short-term pains, and electricity price downward pressure and frequent “zero electricity prices” squeeze profit margins [3][5], but green power premiums and green certificate trading provide long-term hedge mechanisms
-
Restructuring of Power Sales Companies: Profit models are transforming from single spreads to diversified services, andplatform valuereassessment becomes the key, with leading enterprises successfully achieving diversified revenue structures [4]
-
Intensified Valuation Differentiation:
- Thermal Power: Regional leaders enjoy “public utility + growth” premiums
- New Energy: Enterprises with resource and capital advantages become stronger
- Power Sales: Business model innovators undergo value reassessment
- Key Focus: Jingneng Power (600578.SZ), Wanneng Power (000543.SZ) and other regional leaders
- Allocation Strategy: As the core position of “dividend + defense”, enjoy the public utility dividend
- Risk Tips: Pay attention to the decline in utilization hours and rising carbon costs
- Key Focus: Longyuan Power, Three Gorges Energy and other large wind and solar resource owners with green power premium capabilities [5]
- Allocation Strategy: Select individual stocks, pay attention to green certificate trading and subsidy recovery progress
- Risk Tips: Electricity price decline, IRR inversion, project return not meeting expectations
- Key Focus: Leading enterprises in regions with high marketization levels such as Guangdong and Jiangsu with value-added service capabilities
- Allocation Strategy: Thematic opportunities, focus on business model innovation
- Risk Tips: Continuous compression of spread space and policy changes
| Category | Key Indicators | Observation Frequency |
|---|---|---|
| Thermal Power | Proportion of capacity price revenue, growth rate of auxiliary service revenue, utilization hours | Quarterly |
| New Energy | Green power trading volume, green certificate price, market-oriented electricity price level | Monthly |
| Power Sales Companies | Wholesale-retail spread, proportion of value-added service revenue, number of users | Quarterly |
| Policy | Expansion progress of electricity spot market, carbon market quota allocation | Monthly |
[0] Jinling API Data - Financial and Market Data of Jingneng Power (600578.SZ) and Wanneng Power (000543.SZ)
[1] Xinhuanet - “National Electricity Market Trading Volume Exceeds 6 Trillion kWh from January to November” (December 25, 2025)
https://news.cn/2025-12-25/c58efe3a885b45a5bd991e2021b8d0a1/c.html
[2] Securities Times - “Instantly, Sealed at the Daily Limit! Circular No.136, Completely Exploded?” (December 3, 2025)
https://www.stcn.com/article/detail/3523161.html
[3] Special Research Report - “Electricity Marketization Reform is Comprehensively Deepened, and the Profit Models of Power and Energy Storage Enterprises Will Be Restructured” (December 2025)
https://pdf.dfcfw.com/pdf/H3_AP202512131799791567_1.pdf
Insights are generated using AI models and historical data for informational purposes only. They do not constitute investment advice or recommendations. Past performance is not indicative of future results.
About us: Ginlix AI is the AI Investment Copilot powered by real data, bridging advanced AI with professional financial databases to provide verifiable, truth-based answers. Please use the chat box below to ask any financial question.