Investment Value Assessment of the Power Sector: Thermal Power Transition and Market Mechanism Changes
Unlock More Features
Login to access AI-powered analysis, deep research reports and more advanced features
About us: Ginlix AI is the AI Investment Copilot powered by real data, bridging advanced AI with professional financial databases to provide verifiable, truth-based answers. Please use the chat box below to ask any financial question.
Related Stocks
Based on the research background you provided, I will systematically assess the investment value of the power sector from dimensions including
- The coal-fired power capacity pricing mechanism was introduced in November 2023. In 2024, coal-fired power units nationwide received approximately CNY 95 billion in capacity electricity fees, equivalent to CNY 0.0207 per kWh in capacity electricity price per unit[0][1]
- Starting from 2026: In regions with faster coal-fired power transition such as Yunnan and Sichuan, the fixed cost recovery ratio will be increased to no less than 70%, while in other regions it will be no less than 50%[1][2]
- Gansu Province will take the lead in piloting CNY 330 per kW per year (100% fixed cost recovery) in 2026[1]
- The Basic Rules for the Power Auxiliary Services Market were issued in May 2025, promoting the transition from “planned compensation” to “market-driven”[3]
- In 2024, the national auxiliary services market cost reached CNY 40.25 billion, with peak shaving costs accounting for the largest share (CNY 33.04 billion)[1]
- Huaneng International’s auxiliary services revenue in 2024 was CNY 2.7 billion, a year-on-year increase of 85%[1]
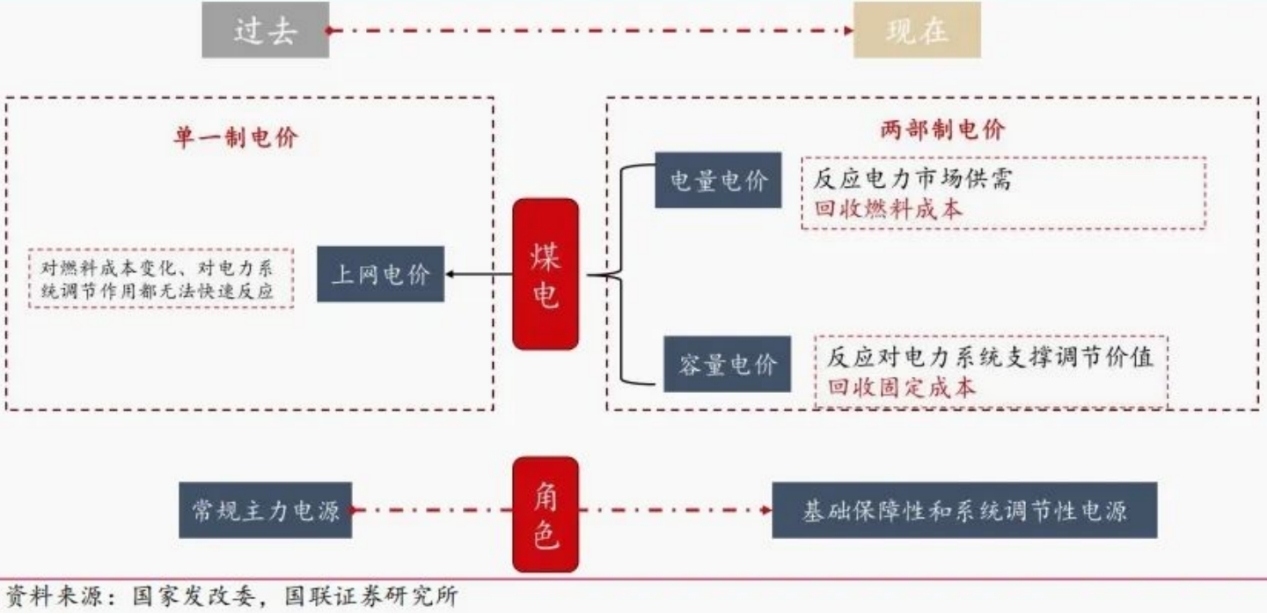
- Traditional energy pricing model: Thermal power profits through “power generation × grid feed-in tariff”
- Positioning in the new power system: Providing multi-dimensional services such as capacity guarantee, peak shaving and frequency regulation, and emergency backup[4][5]
- Floor contract strategy: The annual contract floor for thermal power has dropped from 80% to 60%, shifting to floor contracts and reserving electricity to participate in the monthly bidding market[0]
- New energy contract preference: Marginal cost is close to 0, tending to sign annual long-term agreements to lock in consumption[0]
- Electricity sales company mismatch strategy: Using monthly spot market fluctuations for arbitrage transactions[0]
| Revenue Source | Pricing Mechanism | Market Scale | Participating Entities |
|---|---|---|---|
| Electricity Energy Market | Spot market price + medium- and long-term contract price | Market-oriented transaction electricity share continues to rise | All power generation types |
| Capacity Pricing | Fixed fee (CNY 100–330 per kW per year) | Approximately CNY 95 billion in 2024 | Mainly coal-fired power |
| Auxiliary Services | Bidding for peak shaving, frequency regulation, backup and other varieties | Approximately CNY 40.25 billion in 2024 | Mainly coal-fired power, with emerging entities such as energy storage participating |
- Decline in utilization hours: However, capacity pricing and auxiliary services revenue can offset losses from electricity price[1]
- Enhanced profit stability: Diversified revenue reduces dependence on single electricity price and coal price[5]
- Regional differentiation intensifies: Enterprises in regions with mature spot markets and active auxiliary services transactions have greater profit elasticity[1][2]
| Company | Stock Code | Market Cap (HKD) | P/E | P/B | Annual Increase | ROE | Business Characteristics |
|---|---|---|---|---|---|---|---|
| Huaneng International | 0902.HK | 133.78 billion | 8.72x | 0.86x | +49.76% | 10.25% | Thermal power leader, actively deploying new energy |
| China Power | 2380.HK | 41.93 billion | 10.63x | 0.75x | +12.62% | 7.07% | Coal-fired power + new energy simultaneously |
| Longyuan Power | 0916.HK | 107.63 billion | 9.49x | 0.61x | +7.14% | 7.00% | Pure wind power operator |
| CGN Power | 1816.HK | 195.73 billion | 20.72x | 1.58x | +10.26% | 7.74% | Nuclear power-based, high growth |
- Thermal power stocks outperformed significantly within the year: Huaneng International (+49.76%) reflects market recognition of the new “capacity pricing + auxiliary services” model[6]
- Valuation differentiation: The P/E of the thermal power sector is about 8–11x, lower than that of nuclear power (20x+), reflecting growth differences
- P/B below 1: Most thermal power enterprises have a P/B in the range of 0.7–0.9x, with room for value revaluation[6][7][8]
| Dimension | Assessment Points | Data Source |
|---|---|---|
| Policy Adaptability | Capacity pricing recovery ratio in the province, auxiliary services market varieties and price levels | Documents from provincial development and reform commissions and energy bureaus |
| Unit Flexibility | Minimum technical output, ramping rate, completion degree of peak shaving transformation | Company announcements, technical transformation reports |
| Market Participation Ability | Spot/medium- and long-term transaction strategy, electricity sales company collaboration, cross-provincial transaction ability | Transaction disclosures, third-party assessments |
| New Energy Collaboration | “Thermal power + energy storage/pumped storage/new energy” multi-energy complementary layout, green power transaction participation | Company development plans |
| Cost Control | Fuel procurement strategy, unit energy efficiency level, carbon asset management | ESG reports, financial reports |
| Cash Flow Stability | Operating cash flow, dividend rate, debt ratio | Financial reports |
| Stage | Time Range | Main Characteristics | Key Revenue Sources |
|---|---|---|---|
| Short-term | 2025–2030 | “Supply guarantee + flexibility transformation” | Capacity pricing + peak shaving auxiliary services |
| Medium-term | 2030–2040 | “Low-carbon transformation” | Frequency regulation auxiliary services + carbon asset management |
| Long-term | 2040–2060 | “Emergency backup role” | Capacity payment + system backup services |
- Yunnan, Sichuan: Capacity pricing recovery ratio will rise to over 70% in 2026[2]
- Shandong, Shanxi, Guangdong: Spot markets officially in operation, rich auxiliary service varieties[1][3]
- Gansu: First to pilot 100% fixed cost recovery (CNY330 per kW per year)[2]
- Central Enterprise Leaders: Group asset injection potential, strong cross-provincial transaction capability, sufficient technical transformation funds
- Regional Market Advantages: High maturity of local spot market, strong auxiliary service compensation
- Flexibility Transformation Progress: Proportion of commissioned peak shaving units, frequency regulation performance indicators
- New Energy Layout: Progress of coal-fired power enterprises’ transformation to integrated “clean energy + regulatory services”
| Risk Type | Specific Performance | Hedging Ideas |
|---|---|---|
| Policy Implementation Below Expectations | Delay in capacity pricing increase, tightening of auxiliary service settlement rules | Focus on policy pilot areas (e.g., Gansu) for first trials |
| Intensified Spot Market Volatility | Significant intraday price fluctuations leading to unstable revenue | Increase medium- and long-term contract ratio, optimize quotation strategy |
| Rising Carbon Costs | Decrease in peak shaving unit load rate → reduced boiler efficiency → increased carbon emission intensity | Lay out CCUS, biomass co-firing and other carbon reduction technologies in advance |
| New Energy Competition | Emerging entities such as energy storage and virtual power plants carve up the auxiliary services market | Joint ventures with energy storage enterprises to form “thermal power + energy storage” consortia |
- Overweight Regional Leaders: Select thermal power listed companies in policy-pioneering regions such as Gansu, Yunnan, Sichuan, and Shandong
- Prioritize Central Enterprises: Central enterprises like Huaneng International and China Power have advantages in cross-provincial transactions and resource integration
- Focus on Transformation Progress: Layout enterprises with fast flexibility transformation, strong new energy collaboration, and high auxiliary service market share
[0] User Research Background: Assessment of Thermal Power Unit Transition and Power Sector Investment Value Under the Background of Power Market Reform
[1] “Comprehensive Deepening of Power Market Reform, Profit Models of Power and Energy Storage Enterprises Will Be Reconstructed”, Oriental Fortune Research Report, December 2025 (PDF)
[2] “Power Reform Enters a New Stage, Market Entry and Spot Transactions Usher in New Opportunities”, Cinda Securities R&D Center, July 2025 (PDF)
[3] “The Power Auxiliary Services Market Has a Top-level Design”, Science and Technology Daily, May 23, 2025
[4] “Challenges and Transition Paths for the Development of New-generation Coal-fired Power”, China Electric Power Enterprise Management, Issue 6, 2025
[5] “Capacity Pricing Helps Thermal Power Transition”, Economic Daily, July 15, 2025
[6] Jinling API Data: Company Profiles and Real-time Quotes of Huaneng International (0902.HK), China Power (2380.HK), Longyuan Power (0916.HK), CGN Power (1816.HK) (Retrieval Time: December 28, 2025)
[7] “2025 China Power Market Outlook: 10 Trends to Watch for Market Participants”, RMI Research Report (PDF)
[8] “2025 Power Market Reform and Electricity Price System Insights”, Rocky Mountain Institute, May 2025 (PDF)
The above analysis integrates policy mechanisms, financial data, market cases, and investment frameworks. It is recommended to conduct detailed tracking in combination with specific company announcements, the latest power market rules of each province, and third-party in-depth research reports. If in-depth calculations for specific companies or regions are needed, further expansion can be made.
Insights are generated using AI models and historical data for informational purposes only. They do not constitute investment advice or recommendations. Past performance is not indicative of future results.
About us: Ginlix AI is the AI Investment Copilot powered by real data, bridging advanced AI with professional financial databases to provide verifiable, truth-based answers. Please use the chat box below to ask any financial question.