Analysis of Driving Factors for Abnormal Fluctuations in Tongyu Communication's Stock Price and Risk Assessment of Irrational Speculation
Unlock More Features
Login to access AI-powered analysis, deep research reports and more advanced features
About us: Ginlix AI is the AI Investment Copilot powered by real data, bridging advanced AI with professional financial databases to provide verifiable, truth-based answers. Please use the chat box below to ask any financial question.
Related Stocks
Based on brokerage API data analysis, I will comprehensively analyze the driving factors behind Tongyu Communication’s abnormal stock price fluctuations and the risk assessment methods for irrational speculation.
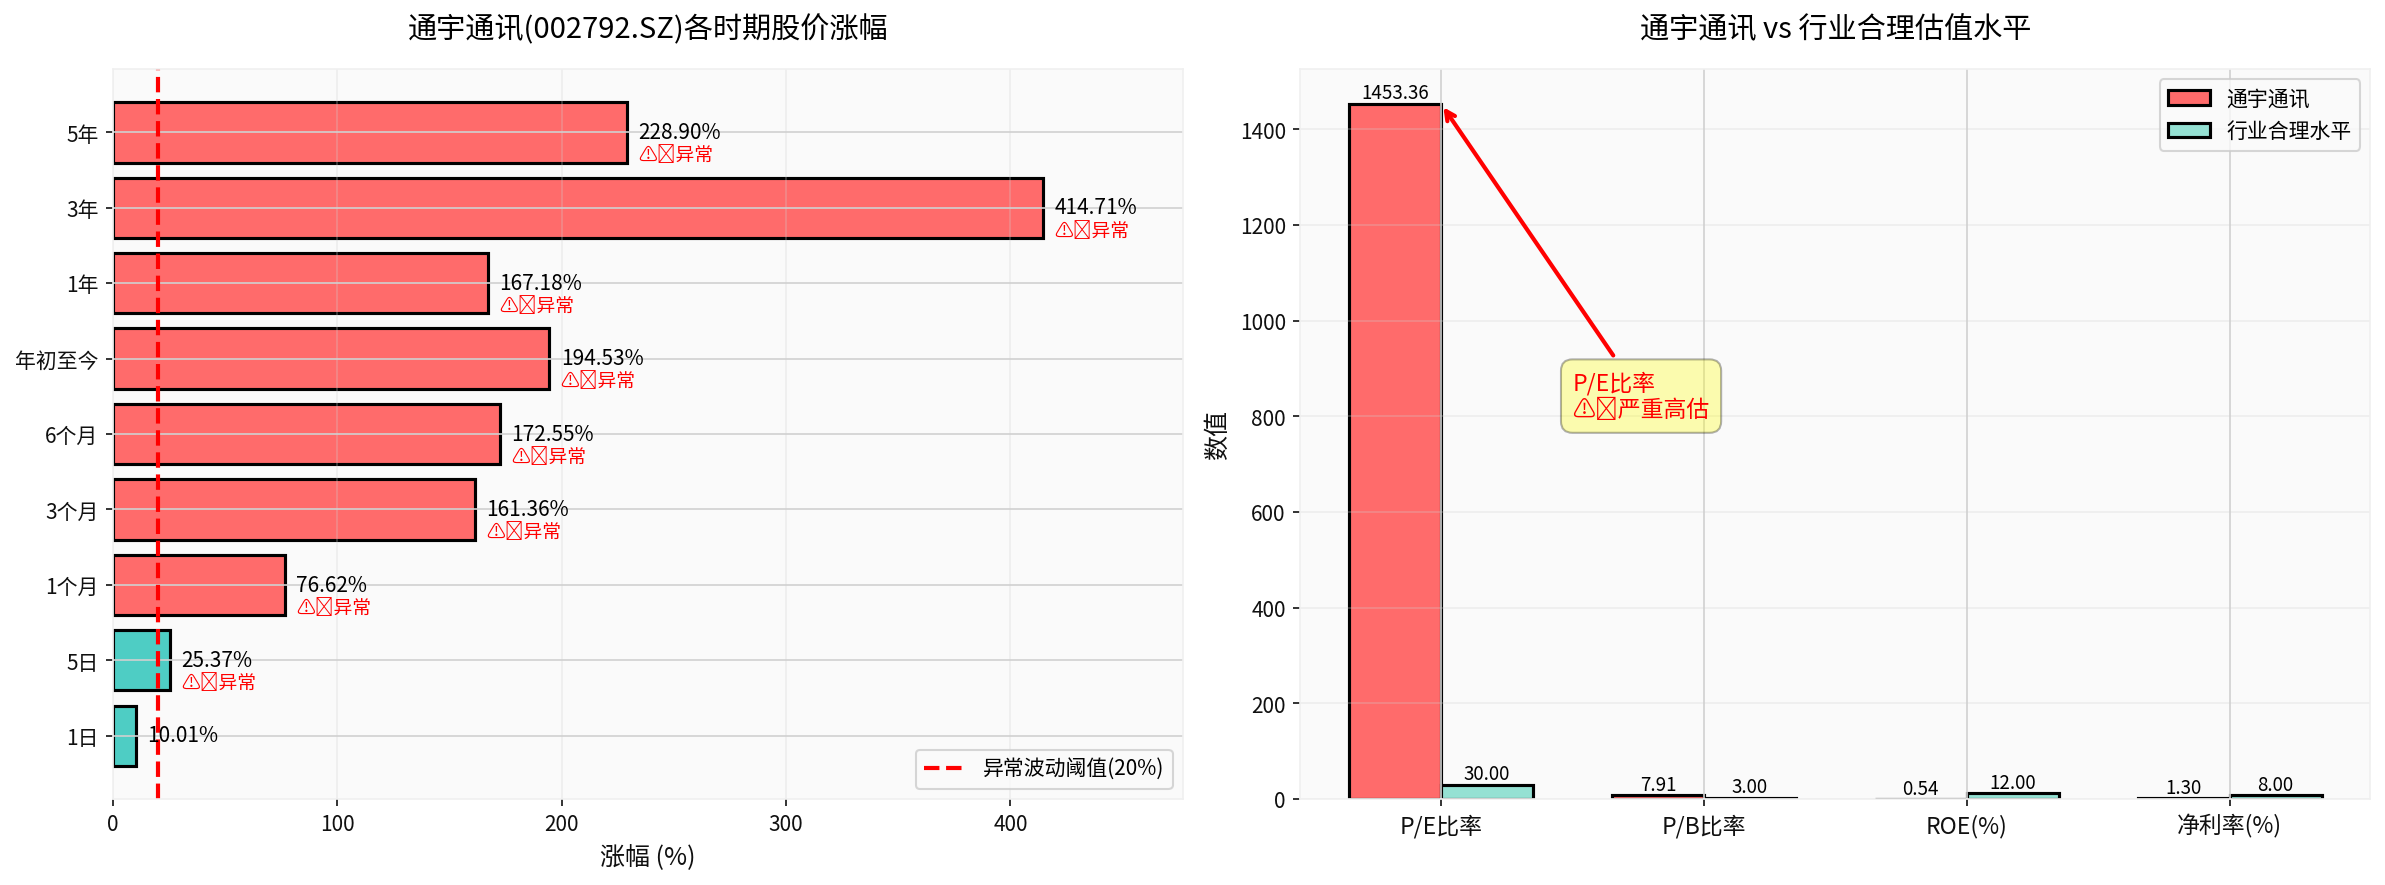
From the chart above, it is clear that Tongyu Communication (002792.SZ) has experienced abnormally large increases across all time periods:
- Short-term surge:Up 76.62% in the past month, 25.37% in 5 days, and 10.01% in a single day [0]
- Mid-term spike:Up 161.36% in 3 months and 172.55% in 6 months [0]
- Long-term performance:Up 194.53% year-to-date and 414.71% over 3 years [0]
- A single-day surge of 12.40% on December 24
- A single-day drop of 7.69% on December 23
- A single-day drop of 10.00% on December 17
- Trading volume increased by 1-3 times compared to the average level
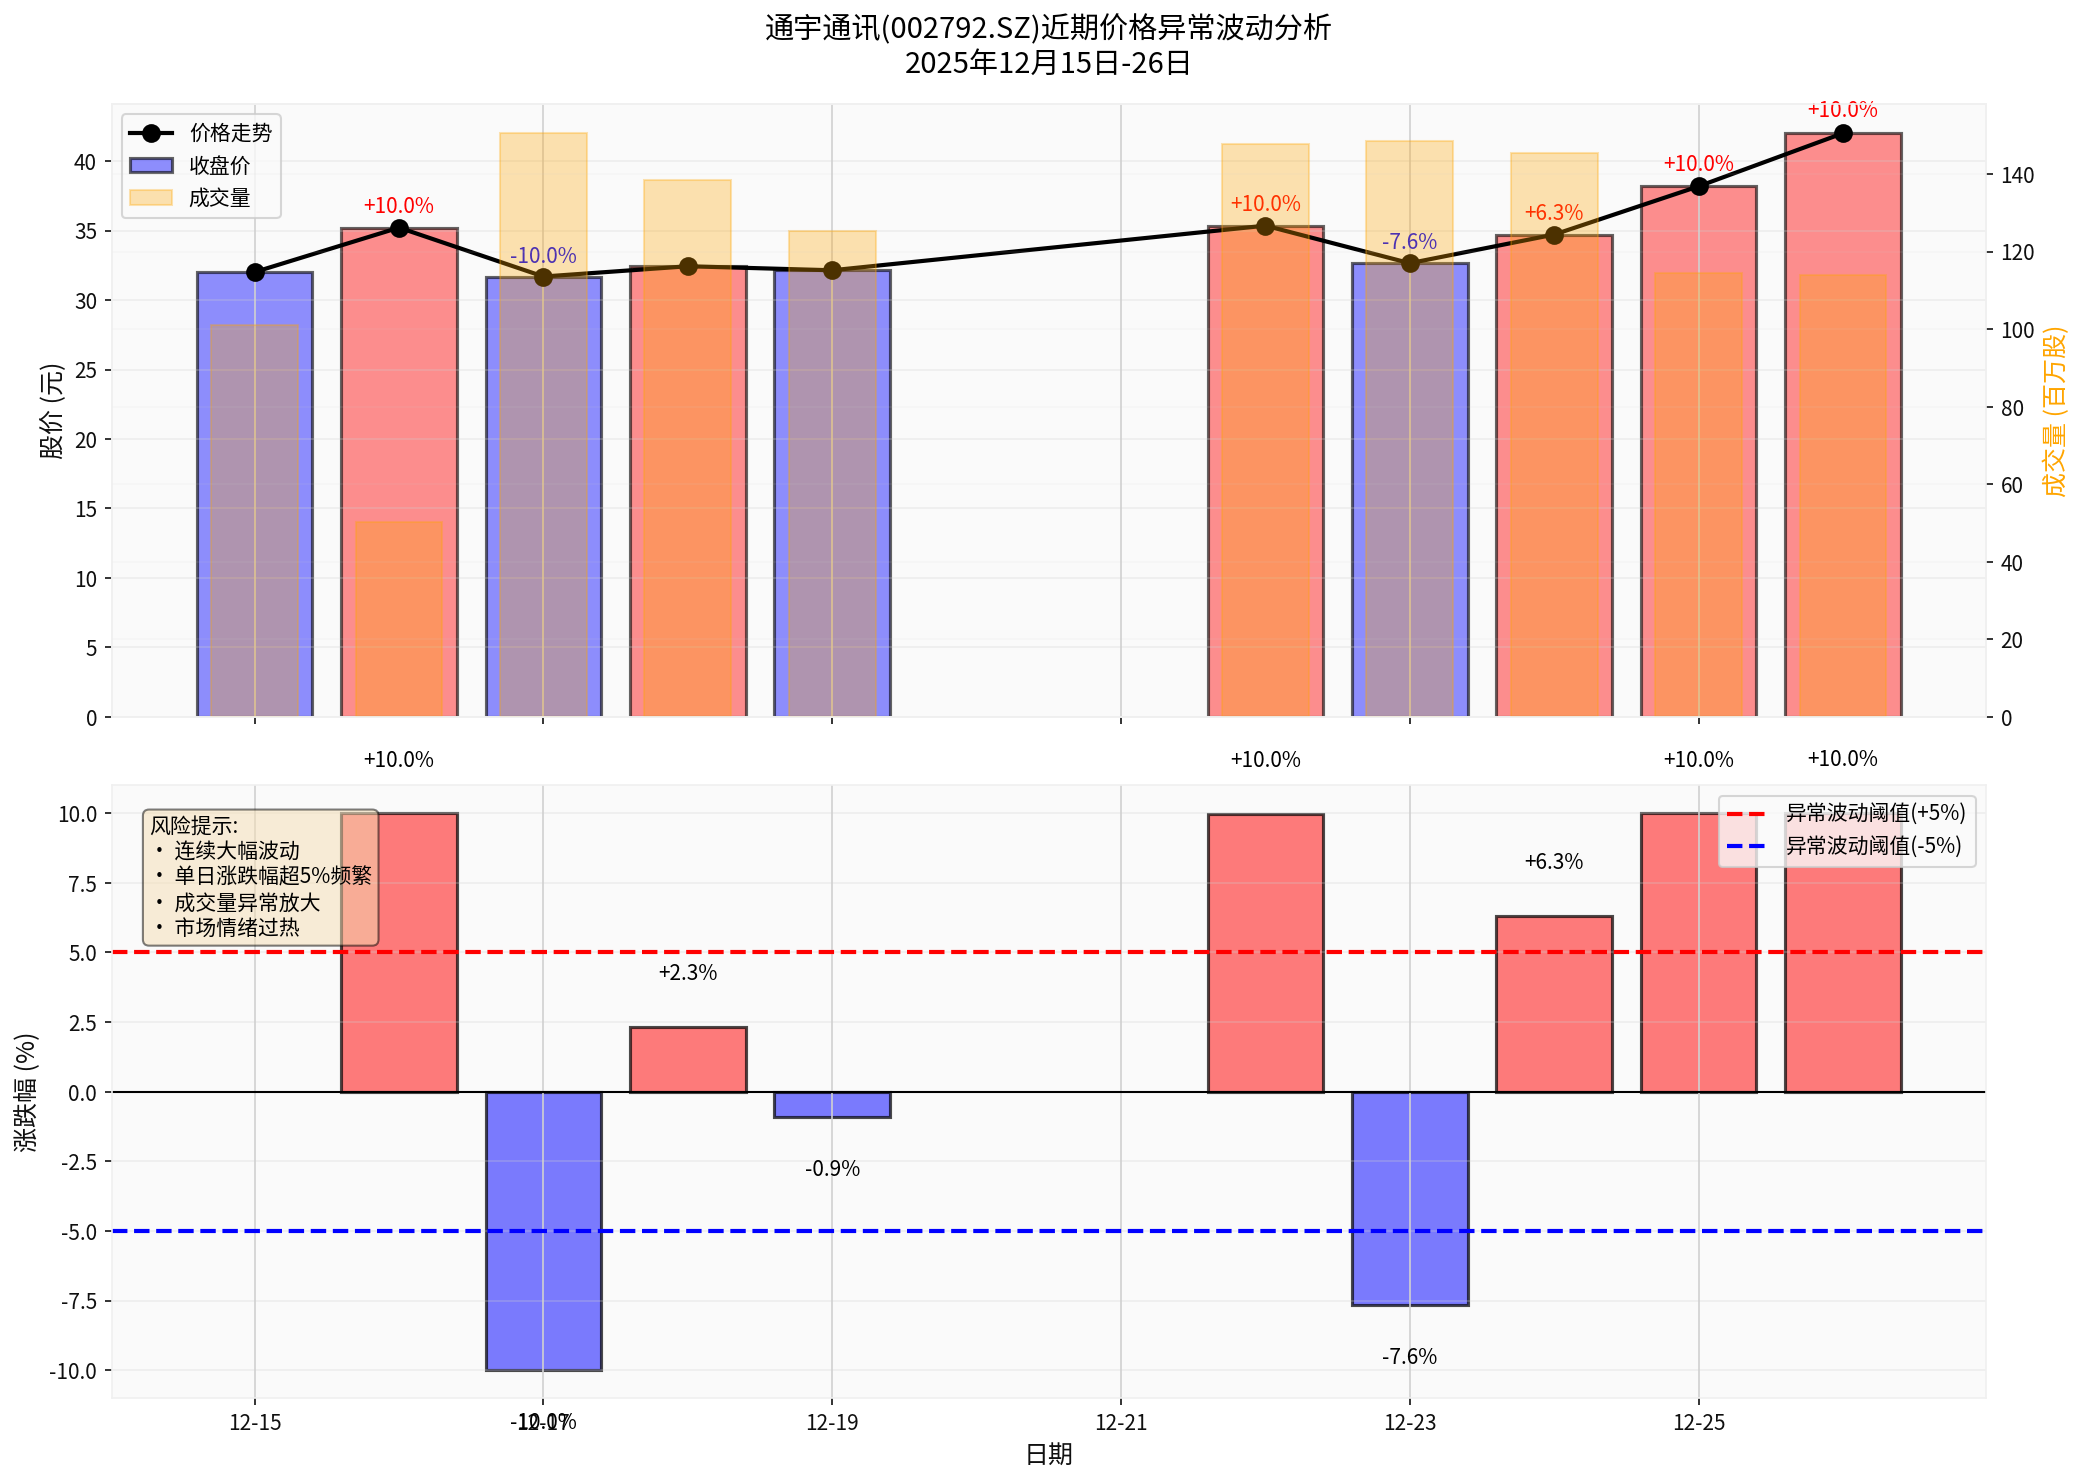
The chart above shows that between December 15 and 26, the stock’s single-day rise/fall exceeded the abnormal fluctuation threshold of 5% multiple times, showing typical speculation characteristics.
From the comparison of valuation indicators (see the right side of the chart above):
- P/E ratio is as high as 1,453.36x, far exceeding the reasonable industry level of 30x [0]
- P/B ratio is 7.91x, approximately 2.6 times the reasonable industry level [0]
- P/S ratio is 18.89x, and the price-to-sales ratio is also severely overvalued [0]
Such extreme valuation levels indicate that the stock price has completely deviated from fundamental support and is purely driven by market sentiment.
- ROE is only 0.54%, far below the reasonable industry level of 12% [0]
- Net profit margin is 1.30%, far below the reasonable industry level of 8% [0]
- Operating profit margin is 0.55%, with extremely weak profitability [0]
A company with such weak profitability yet enjoying a P/E ratio of over 1,400 is a typical signal of irrational speculation.
According to technical analysis [0]:
- KDJ indicator:K value 89.5, D value 80.3, J value 107.8, in a severely overbought zone
- Trend status:In an upward trend but in a “pending confirmation” state
- Resistance level:The current price of 42.00 yuan has reached the key resistance level
- Beta coefficient 0.11:Relatively low volatility, but recent fluctuations have increased abnormally
Technical indicators clearly show that the stock price is in an extremely overbought state, with significant correction risks.
Financial analysis [0] shows:
- Accounting policy classification:Aggressive
- Interpretation:The company uses aggressive accounting treatments with low depreciation/capital expenditure ratios, and reported earnings may be inflated
Aggressive accounting policies may be one of the supporting factors maintaining the superficial appearance of the stock price.
The communication services sector has performed relatively well recently (up 0.70%) [0], but Tongyu Communication’s growth far exceeds the sector average, indicating that its rise is mainly due to individual stock speculation rather than sector-driven.
| Evaluation Dimension | Warning Signal | Tongyu Communication’s Actual Situation |
|---|---|---|
| P/E ratio | >50x requires vigilance | 1,453.36x ⚠️ Extremely dangerous |
| P/B ratio | >5x requires caution | 7.91x ⚠️ Overvalued |
| P/S ratio | >10x requires vigilance | 18.89x ⚠️ Overvalued |
| Valuation-profit matching degree | High ROE to support high valuation | ROE 0.54%, serious mismatch |
- High valuation requires high profit support:Only enterprises with ROE continuously exceeding 20% can withstand a P/E ratio of over 50x
- Peer comparison:Compare with the valuation levels of industry leaders to avoid isolated analysis
- Historical quantile:Be highly vigilant when the valuation is above the 90% quantile of its own history
- ROE vs ROIC:ROE significantly higher than ROIC may indicate inflated financial leverage
- Non-recurring profit and loss excluded net profit:Focus on real profits after excluding non-recurring gains and losses
- Cash flow matching degree:The ratio of operating cash flow to net profit should be >1
- Revenue growth rate:Should maintain positive growth for consecutive quarters
- Net profit growth rate:Should be synchronized with or faster than revenue growth
- Market share:Whether the industry position is stable
- Debt-to-asset ratio:Generally should be <70%
- Current ratio:Should be >1.5 (Tongyu Communication is 3.91, which is good) [0]
- Goodwill ratio:Goodwill/net assets should be <30%
Based on Tongyu Communication’s technical analysis [0], the following are key technical warning signals:
| Technical Indicator | Risk Threshold | Tongyu Communication’s Status | Risk Level |
|---|---|---|---|
| KDJ indicator | K>80 is overbought | K=89.5, D=80.3 | 🔴 Severely overbought |
| RSI(14) | >70 is overbought | Shows overbought risk | 🔴 High risk |
| MACD | Death cross is a sell signal | Bullish but pending confirmation | 🟡 Neutral |
| Trading volume | Abnormal increase | Double the average | 🔴 Vigilance |
| Trend confirmation | Pending state | Pending | 🟡 Uncertain |
Speculation Heat Index = (Single-day turnover rate × Absolute value of daily average rise/fall) / Benchmark value
- Abnormal trading volume:Trading volume on December 26 was 114 million shares, far exceeding the daily average of 56.49 million shares [0]
- Price volatility:Frequent single-day fluctuations exceeding ±5% [0]
- Continuous limit up/down:Multiple single-day rises/falls exceeding 10% have occurred
I recommend using the following scoring system (0-10 points per item, higher score means higher risk):
| Evaluation Dimension | Weight | Tongyu Communication’s Score | Weighted Score |
|---|---|---|---|
| Valuation bubble degree | 30% | 10/10 | 3.0 |
| Profitability | 25% | 8/10 | 2.0 |
| Technical overbought degree | 20% | 9/10 | 1.8 |
| Volatility | 15% | 9/10 | 1.35 |
| Financial quality | 10% | 6/10 | 0.6 |
Comprehensive risk score |
100% |
- | 8.75/10 |
- 0-3 points: Low risk
- 3-6 points: Medium risk
- 6-8 points: High risk
- 8-10 points: Extremely high risk 🔴(Tongyu Communication belongs to this level)
- Partial profit-taking:It is recommended to reduce holdings by at least 50% to lock in profits
- Set stop-loss:Set a stop-loss below the key support level of 34.64 yuan [0]
- Avoid adding positions:Strictly prohibit chasing highs to add positions at the current level
- The current stock price of 42.00 yuan has reached the resistance level, and technical analysis shows downside risks [0]
- KDJ is severely overbought, and the short-term correction may exceed 20%
- When the valuation returns to rationality, the stock price may be halved or more
- Valuation return:P/E ratio falls below 100x (still high but relatively safer)
- Technical repair:KDJ falls below 50, RSI below 50
- Fundamental improvement:ROE increases to above 5%, net profit growth exceeds 30%
- Trading volume returns to normal:Daily average trading volume falls back to normal levels
| Feature | Identification Standard | Does Tongyu Communication Meet It? |
|---|---|---|
| 1. P/E >100x | ✅ | Yes (1,453x) |
| 2. Frequent single-day rise/fall >5% | ✅ | Yes |
| 3. Abnormal increase in trading volume | ✅ | Yes (over 2x) |
| 4. ROE <5% but high valuation | ✅ | Yes (0.54%) |
| 5. Severe overbought technical indicators | ✅ | Yes (KDJ>89) |
| 6. Company issues risk reminder | ✅ | Yes |
| 7. Short-term growth >50% | ✅ | Yes (1 month +76%) |
| 8. Excessive media attention | - | Data does not support confirmation |
| 9. Concept speculation greater than substance | ⚠️ | Needs further verification |
| 10. Large influx of retail investors | ⚠️ | Needs further verification |
The fundamental driving factor behind Tongyu Communication’s abnormal stock price fluctuations is
- Valuation bubble:P/E ratio as high as 1,453x, completely deviating from the company’s real value
- Weak profitability:ROE only 0.54%, unable to support high valuation
- Severely overbought technical indicators:KDJ indicators show extremely overbought status
- Aggressive financial policies:Accounting treatment tends to be aggressive, need to be vigilant about financial risks
- Abnormal volatility:Frequent single-day rise/fall exceeding 5%, abnormal increase in trading volume
- Do not chase highs:Resolutely do not chase stocks with short-term growth exceeding 50%
- Do not overweight:Single speculative stock position should not exceed 5%
- Do not borrow money:Strictly prohibit using leverage to invest in such stocks
- Prefer high-quality enterprises with ROE>15%, P/E<30, and healthy cash flow
- Use dollar-cost averaging strategy to smooth costs
- Establish a diversified investment portfolio to分散 risks
[0] Gilin API Data - Company Overview, Real-Time Quotes, Financial Analysis, Technical Analysis, Price Data
Insights are generated using AI models and historical data for informational purposes only. They do not constitute investment advice or recommendations. Past performance is not indicative of future results.
About us: Ginlix AI is the AI Investment Copilot powered by real data, bridging advanced AI with professional financial databases to provide verifiable, truth-based answers. Please use the chat box below to ask any financial question.