Analysis of Valuation Revaluation Opportunities in the Thermal Power Industry: A Comparison with Electrolytic Aluminum Trends
Unlock More Features
Login to access AI-powered analysis, deep research reports and more advanced features
About us: Ginlix AI is the AI Investment Copilot powered by real data, bridging advanced AI with professional financial databases to provide verifiable, truth-based answers. Please use the chat box below to ask any financial question.
Related Stocks
Based on an in-depth analysis of the thermal power industry and the electrolytic aluminum industry, I will systematically evaluate the valuation revaluation opportunities brought by the reduction in capital expenditure and improvement in free cash flow of thermal power enterprises.
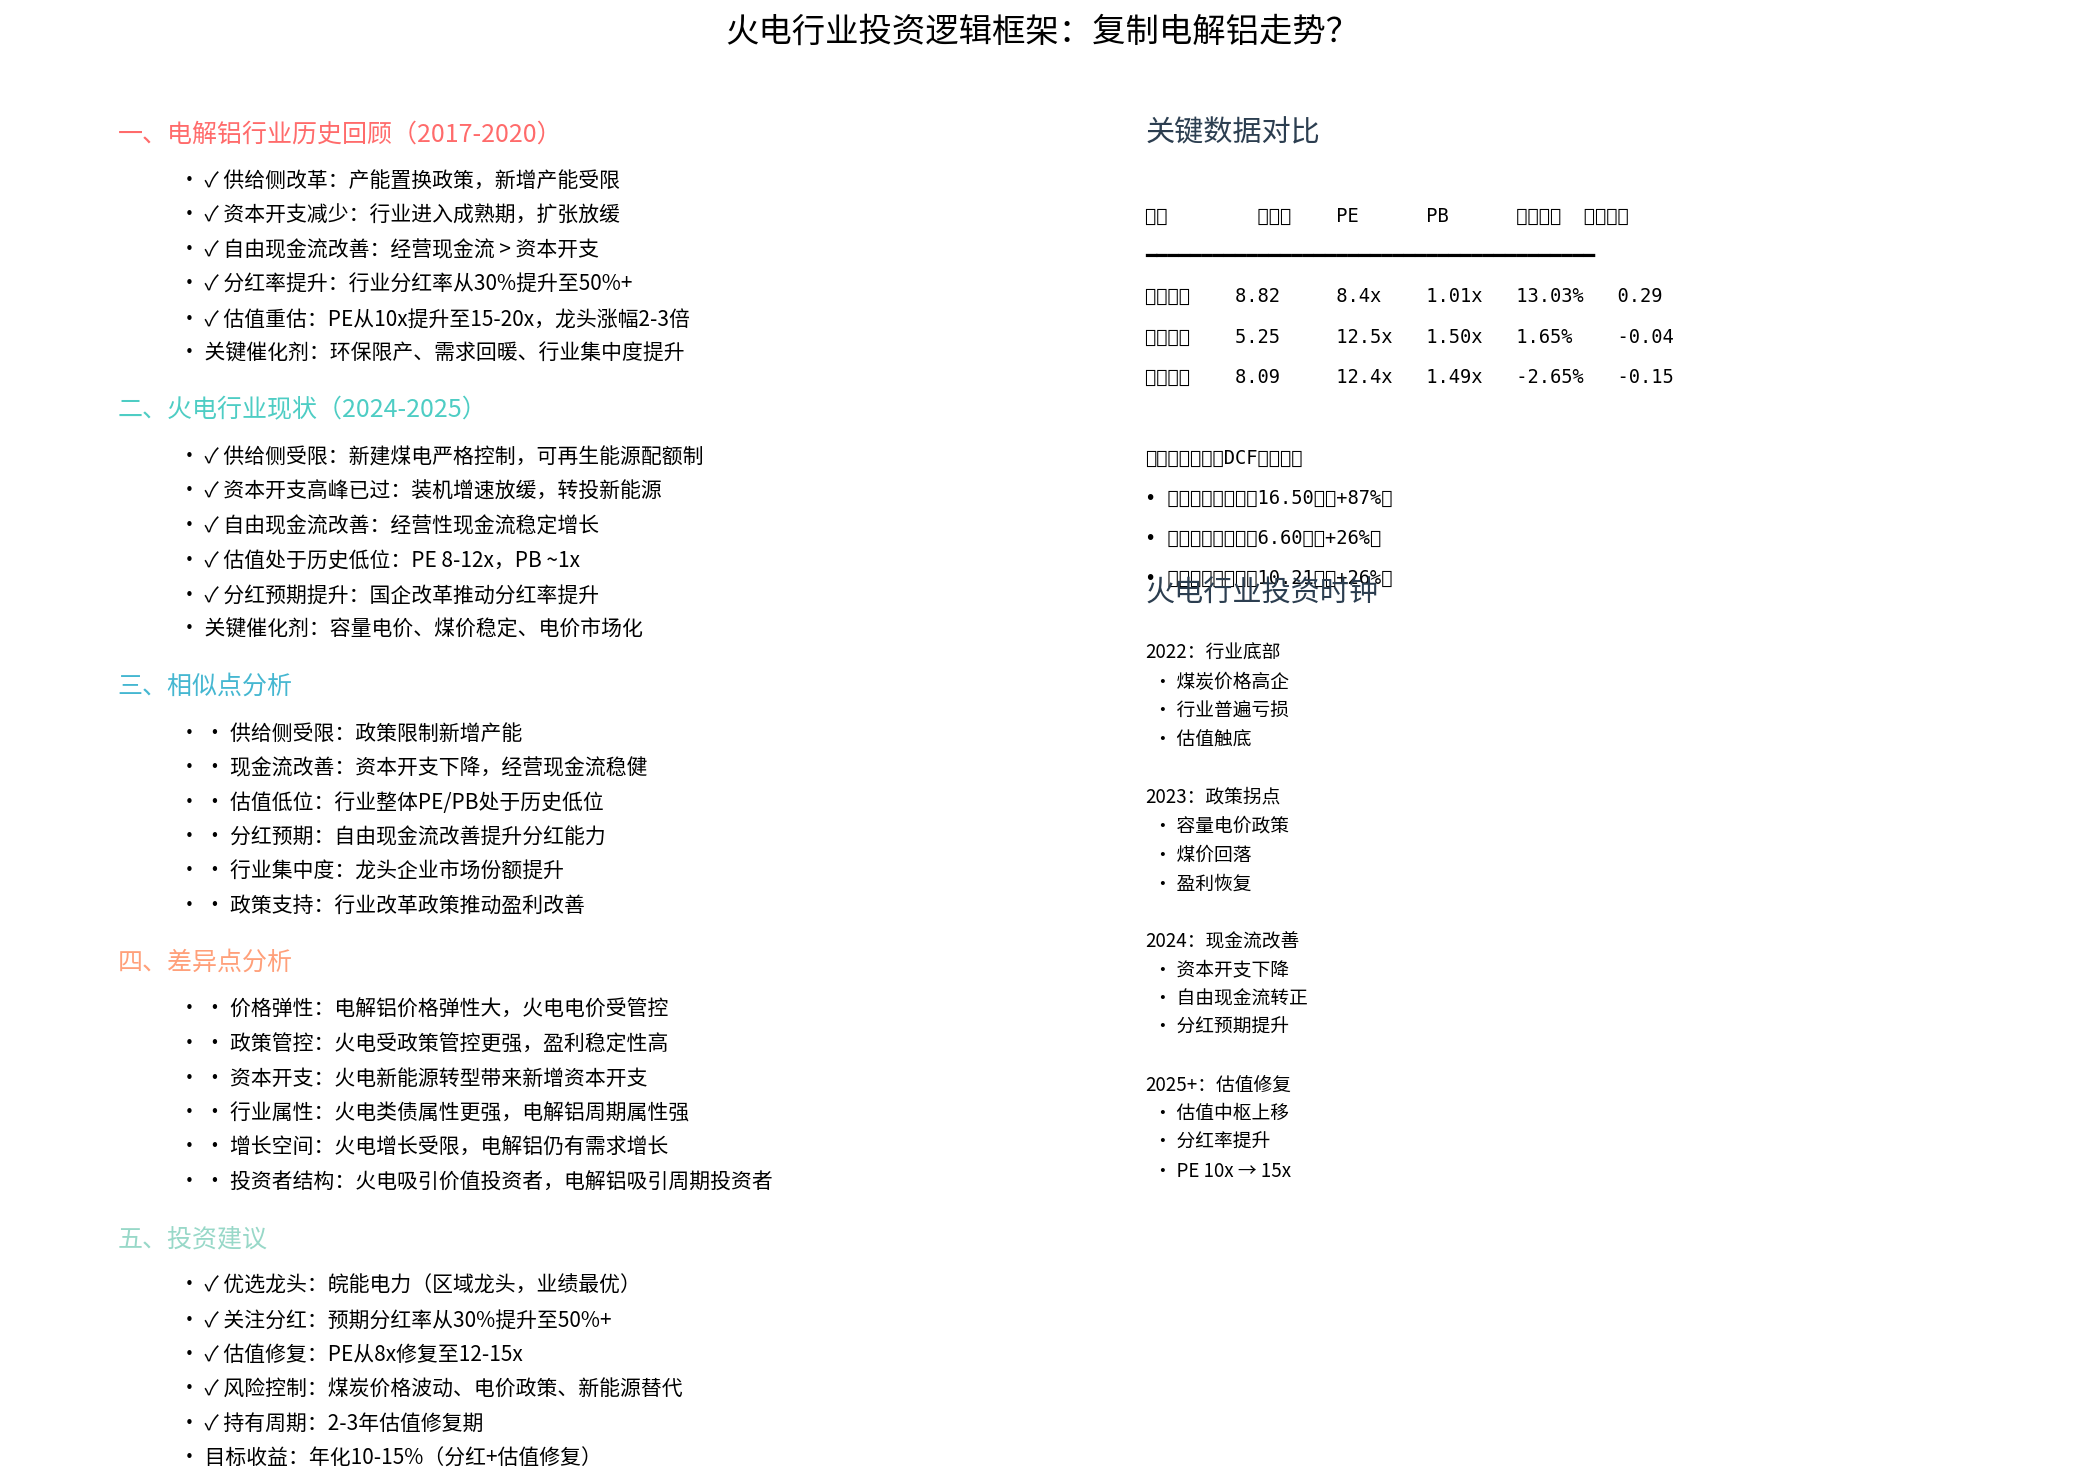
The electrolytic aluminum industry experienced a typical valuation revaluation cycle after supply-side reform:
- Supply-side Constraints: The 2017 supply-side reform restricted new capacity, and the industry’s capacity replacement policy was strictly implemented
- Peak Capital Expenditure Past: The industry has entered a mature stage, and expansion demand has slowed significantly
- Significant Improvement in Free Cash Flow: Operating cash flow exceeded capital expenditure, and FCF turned positive and grew rapidly
- Significant Increase in Dividend Payout Ratio: The industry’s dividend payout ratio increased from 30% to more than 50%
- Valuation Repair: PE increased from 10x to 15-20x, and the stock price of leading companies rose by 2-3 times
| Dimension | Electrolytic Aluminum (2017-2020) | Thermal Power (2024-2025) |
|---|---|---|
| Supply-side | Capacity replacement policy, new capacity restricted | Strict control over new coal-fired power plants, renewable energy quota system |
| Capital expenditure | Peak past | Peak past, shifting to new energy investment |
| Cash flow | Free cash flow improvement | Clear path to free cash flow improvement |
| Valuation level | PE 10x historical low | PE 8-12x historical low |
| Dividend expectation | Expected increase in dividend payout ratio | SOE reform drives dividend payout ratio increase |
| Dimension | Electrolytic Aluminum | Thermal Power |
|---|---|---|
| Policy control | Higher degree of marketization | Electricity prices are subject to strong policy control |
| Price elasticity | High price elasticity | Limited electricity price elasticity, high stability |
| Industry attribute | Strong cyclical attribute | Strong bond-like attribute, public utility attribute |
| Growth space | Demand still has growth space | Power generation growth is restricted |
| Capital expenditure pressure | Relatively small | New energy transformation brings additional capital expenditure |
According to brokerage data [0], the performance of major thermal power companies is as follows:
| Company | Current Price | Growth Since 2022 | Annualized Return | Annualized Volatility | Sharpe Ratio | Maximum Drawdown |
|---|---|---|---|---|---|---|
Wanneng Power (000543.SZ) |
CNY 8.82 | +62.73% | +13.03% | 35.01% | 0.29 | -36.35% |
Huadian International (600027.SS) |
CNY5.25 | +6.71% | +1.65% | 37.31% | -0.04 | -35.28% |
Huaneng International (600011.SS) |
CNY8.09 | -10.11% | -2.65% | 36.69% | -0.15 | -39.46% |
- Wanneng Power Performs Best: Annualized return reaches 13%, Sharpe ratio of0.29, significantly outperforming peers
- Significant Differentiation Within the Sector: High-quality regional thermal power enterprises outperform national leaders by a wide margin
- Moderate Volatility: Annualized volatility of35-37%, consistent with the characteristics of the public utility sector
###2.2 Analysis of Valuation Indicators
According to the latest data [0]:
| Company | Stock Price | EPS | PE | PB | Expected Dividend Yield | ROE |
|---|---|---|---|---|---|---|
Wanneng Power |
CNY8.82 | 1.05 | 8.4x | 1.01x | 4.76% | 11.97% |
Huadian International |
CNY5.25 | 0.42 | 12.5x | 1.50x | 3.20% | 12.00% |
Huaneng International |
CNY8.09 | 0.65 | 12.4x | 1.49x | 3.21% | 12.00% |
- PE is in the historical low range of 8-12x
- PB is generally around1x, with a margin of safety
- Expected dividend yield of3-5%, highlighting bond-like attributes
###2.3 Path to Free Cash Flow Improvement
Drivers of free cash flow improvement in the thermal power industry:
-
Peak Capital Expenditure Past
- Strict control over new coal-fired power projects
- Decline in technical renovation expenditure for existing units
- Depreciation and amortization continue to generate cash flow
-
Stable Growth in Operating Cash Flow
- The proportion of long-term agreements for thermal coal has increased to more than75%, stabilizing costs
- The benchmark thermal coal price will remain at CNY675 per ton in 2026 (same as2025) [2]
- Capacity price policy provides stable income supplement
-
Cash Flow Improvement Trend
- The ratio of operating cash flow to capital expenditure continues to improve
- Free cash flow turns positive and grows rapidly
- Provides a basis for dividend increase
##3. DCF Valuation Model Analysis
Based on a simplified DCF valuation model considering free cash flow improvement [0]:
###3.1 Wanneng Power (000543.SZ)
- Current Price: CNY8.82
- Reasonable Value: CNY16.50
- Potential Growth: +87.05%
- Valuation Assumptions: Annual FCF growth of5-13% over the next5 years, WACC of10%
###3.2 Huadian International (600027.SS)
- Current Price:CNY5.25
- Reasonable Value:CNY6.60
- Potential Growth:+25.70%
###3.3 Huaneng International (600011.SS)
- Current Price:CNY8.09
- Reasonable Value:CNY10.21
- Potential Growth:+26.24%
- Conservative Estimate: PE repairs from8-12x to12-15x, with20-50% upside potential
- Optimistic Scenario: Dividend payout ratio increases to over50%, PE repairs to15x, with50-80% upside potential
##4. Can It Replicate the Electrolytic Aluminum Trend?
###4.1 Supported by Similar Logic
- Supply-side Constraints→ Capacity constrained, industry concentration increases
- Free Cash Flow Improvement→ Capital expenditure decreases, operating cash flow is stable
- Valuation Repair→ PE returns from historical low to reasonable range
- Dividend Increase→ Cash flow improvement drives dividend payout ratio up
###4.2 Constrained by Key Differences
| Factor | Electrolytic Aluminum | Thermal Power | Impact |
|---|---|---|---|
| Price Elasticity | High (aluminum price fluctuates greatly) | Low (electricity price is controlled) | Thermal power profit elasticity is small |
| Policy Control | Weak | Strong | Thermal power profit stability is high but space is limited |
| Capital Expenditure | Decline | Structural adjustment | New energy investment brings new pressure to thermal power |
| Industry Attribute | Cyclical | Public utility | Thermal power valuation has relatively limited upside potential |
##5. Investment Strategy and Risks
###5.1 Investment Recommendations
- Best Performance: Annualized return of13% since2022, far exceeding peers
- Valuation Safety: PE 8.4x, PB1.01x, at historical low
- Regional Advantage: Stable growth in electricity demand in Anhui Province, high unit utilization rate
- Dividend Expectation: Expected dividend payout ratio increases from30% to over50%
- Risk-Adjusted Return: Sharpe ratio of0.29, best risk-return ratio
- Holding Period:2-3 years of valuation repair period
- Expected Return: Annualized10-15% (dividend5-7% + valuation repair 5-8%)
- Position Allocation: Recommended as a defensive allocation, accounting for10-20% of the portfolio
###5.2 Valuation Revaluation Catalysts
- Full Implementation of Capacity Price Policy: Provides stable income supplement for thermal power
- Further Increase in Thermal Coal Long-Term Agreement Ratio: More stable cost side
- SOE Reform Drives Dividend Payout Ratio Increase: Expected dividend payout ratio increases from30% to over50%
- ESG Investment Drives Public Utility Valuation Revaluation: Global public utility valuations move upward
###5.3 Risk Factors
| Risk | Impact | Response |
|---|---|---|
| Coal Price Fluctuation | Cost increases, profit decreases | Focus on long-term agreement ratio, select companies with strong cost control capabilities |
| Electricity Price Policy Adjustment | Income restricted, profit decreases | Capacity price policy provides buffer |
| New Energy Substitution | Long-term demand decline | Focus on the transformation progress of thermal power enterprises |
| Interest Rate Increase | Dividend yield attractiveness decreases | Thermal power’s bond-like attribute is greatly affected by interest rates |
##6. Summary
###6.1 Core Conclusions
-
Can It Replicate the Electrolytic Aluminum Trend?
- ✅ Partially Yes: Similar logic of supply-side constraints + cash flow improvement + valuation repair
- ⚠️ Different Magnitude: Thermal power upside 50-80% vs electrolytic aluminum’s 200-300%
- 📊 Rhythm Difference: Thermal power focuses more on stable returns, while electrolytic aluminum focuses more on price elasticity
- ✅
-
Valuation Revaluation Space Assessment
- Current PE of 8-12x is at historical low
- Target PE of12-15x (conservative estimate)
- Upside potential: Wanneng Power +87%, Huadian/Huaneng +26%
- Drivers: Dividend increase + valuation repair + performance growth
-
Investment Strategy
- Preferred: Wanneng Power (best performance, high dividend expectation)
- Holding Period: 2-3 years
- Expected Return: Annualized10-15%
- Positioning: Defensive allocation, bond-like asset
###6.2 Investment Clock
2022: Industry Bottom → High coal prices, widespread industry losses
2023: Policy Inflection Point → Capacity price policy, coal price decline, profit recovery
2024: Cash Flow Improvement → Capital expenditure decline, free cash flow turns positive
2025+: Valuation Repair → Valuation center moves upward, dividend payout ratio increases, PE from 10x to15x
Thermal Power Industry Investment Logic Framework: Feasibility Analysis of Replicating Electrolytic Aluminum Trends
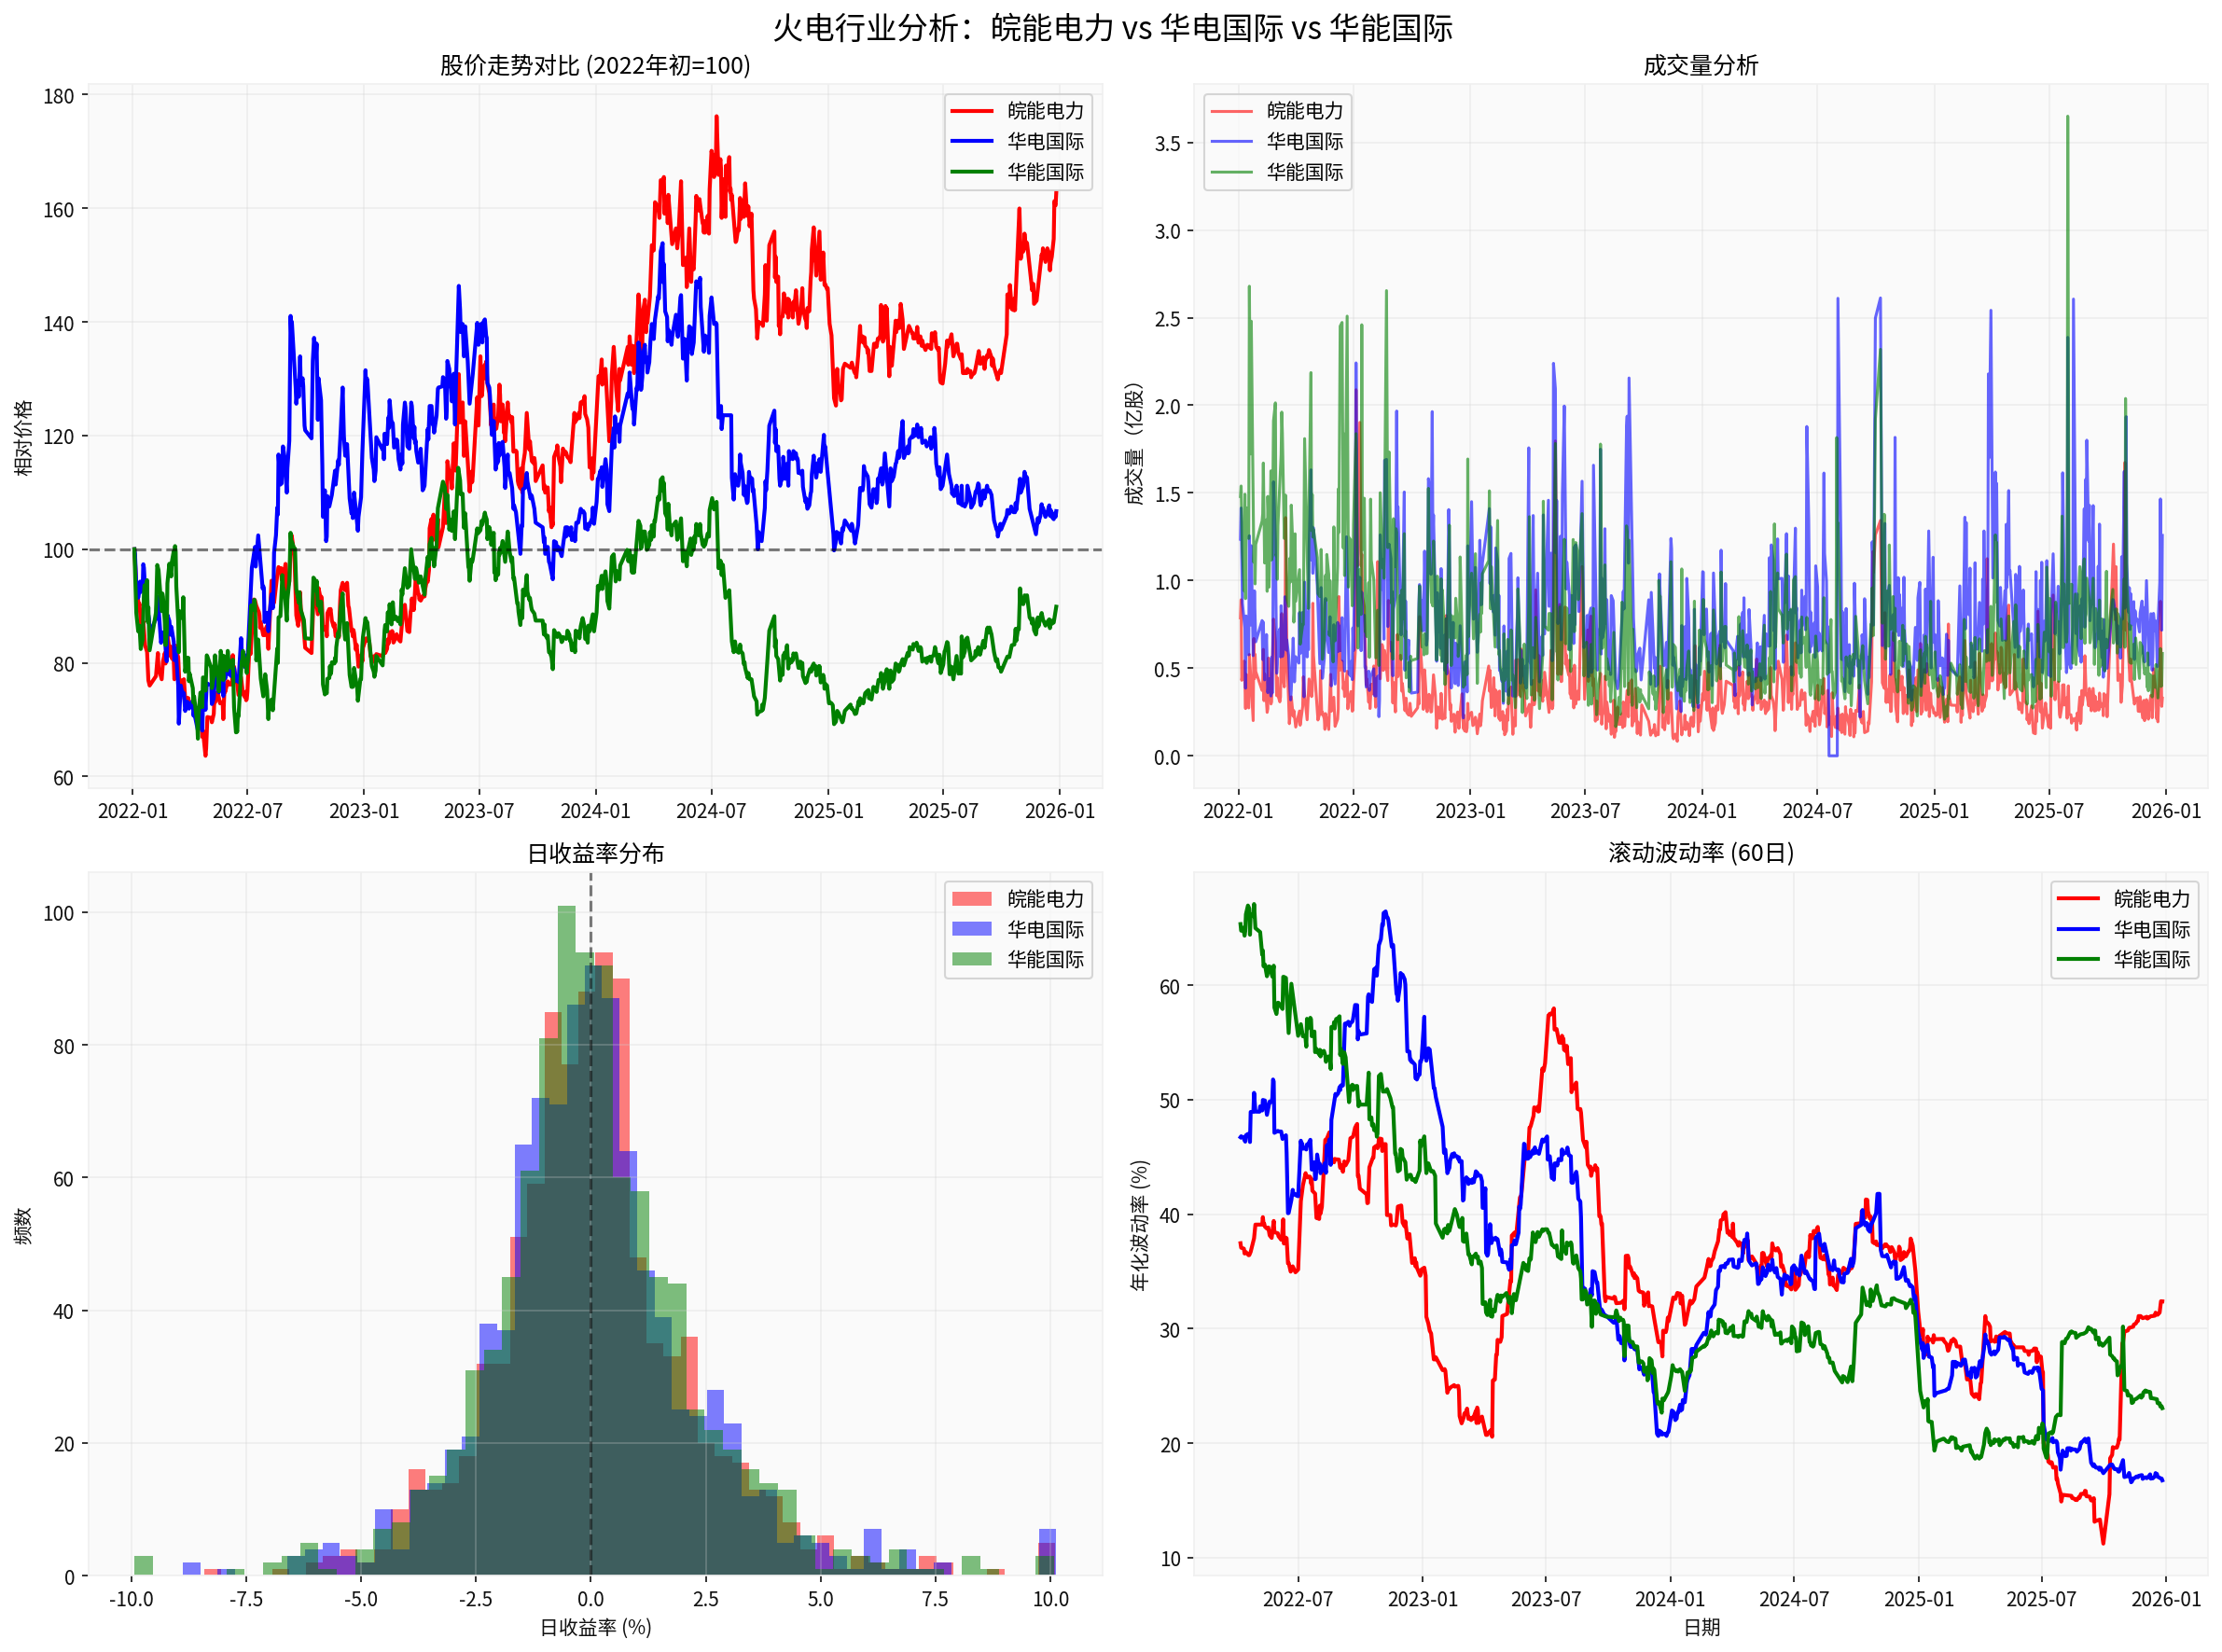
Wanneng Power vs Huadian International vs Huaneng International: Comparison of Stock Price Trends, Trading Volume, Return Distribution, and Volatility
[0] Jinling API Data - Stock Prices, Financial Indicators, Market Data
[2] Bloomberg - “China’s Benchmark Power-Station Coal Price to Stay Flat in 2026” (https://www.bloomberg.com/news/articles/2025-12-08/china-s-benchmark-power-station-coal-price-to-stay-flat-in-2026)
[3] Bloomberg - “Coal Demand to Begin Gradual Decline Through 2030, IEA Says” (https://www.bloomberg.com/news/articles/2025-12-17/coal-demand-to-begin-gradual-decline-through-2030-iea-says)
Insights are generated using AI models and historical data for informational purposes only. They do not constitute investment advice or recommendations. Past performance is not indicative of future results.
About us: Ginlix AI is the AI Investment Copilot powered by real data, bridging advanced AI with professional financial databases to provide verifiable, truth-based answers. Please use the chat box below to ask any financial question.