Analysis of Polysilicon Price Trends and Investment Value in the Context of Anti-Involution in the Photovoltaic Industry
Unlock More Features
Login to access AI-powered analysis, deep research reports and more advanced features
About us: Ginlix AI is the AI Investment Copilot powered by real data, bridging advanced AI with professional financial databases to provide verifiable, truth-based answers. Please use the chat box below to ask any financial question.
Related Stocks
Polysilicon prices have rebounded from a low of about 35 CNY/kg in early July 2025 to over 50 CNY/kg [1], an increase of more than 42%. This rebound is mainly due to:
- Proactive Supply-Side Contraction: Polysilicon production from January to October 2025 was approximately 1.113 million tons, a year-on-year decrease of 29.6% [1], with significant effects from industry self-discipline and production cuts.
- Accelerated Inventory De-Stocking: The pace of new capacity deployment has slowed, and inventory digestion has accelerated.
- Strong Policy Guidance: After the implementation of the new energy consumption quota standards, it is expected that about 15.1% of existing capacity (about 517,300 tons/year) will face exit or integration due to failure to meet the new standards [2].
Since the listing of polysilicon futures in December 2024, the price discovery function has become increasingly prominent:
- The correlation between futures and spot prices reaches 0.94, which is highly consistent with authoritative industry quotations [2].
- Futures prices provide transparent pricing references for the industrial chain and stabilize market sentiment.
- Accelerated Capacity Clearance: 17 leading enterprises have signed agreements to establish a “Polysilicon Capacity Integration and Acquisition Platform” [6], driven by dual wheels of industry self-discipline and policy intervention.
- Cost Rigidity Support: Currently, the cash profit margin of the polysilicon segment is about 27.21%, achieving profits above the full cost line [3].
- The industry lost 31.039 billion CNY in the first three quarters of 2025, with a loss of 6.422 billion CNY in Q3, narrowing by 46.7% compared to Q2 [6], showing a clear trend of profit recovery.
- Inventory Remains High: Polysilicon factory inventory remains at 293,000 tons [2], and short-term de-stocking pressure still exists.
- Downstream Transmission Blocked: The silicon wafer, cell, and module segments suffered losses of -11.67%, -19.81%, and 1.34% respectively [3], making it difficult for downstream to accept higher silicon material prices.
- Demand Uncertainty: Silicon wafer production scheduling is expected to decrease by 21.67% month-on-month in December 2025 [3], and the downstream production cut trend is obvious.
- Overseas Trade Barriers: The U.S. Section 301 tariff on polysilicon has been raised from 0% to 50% [4], increasing export pressure.
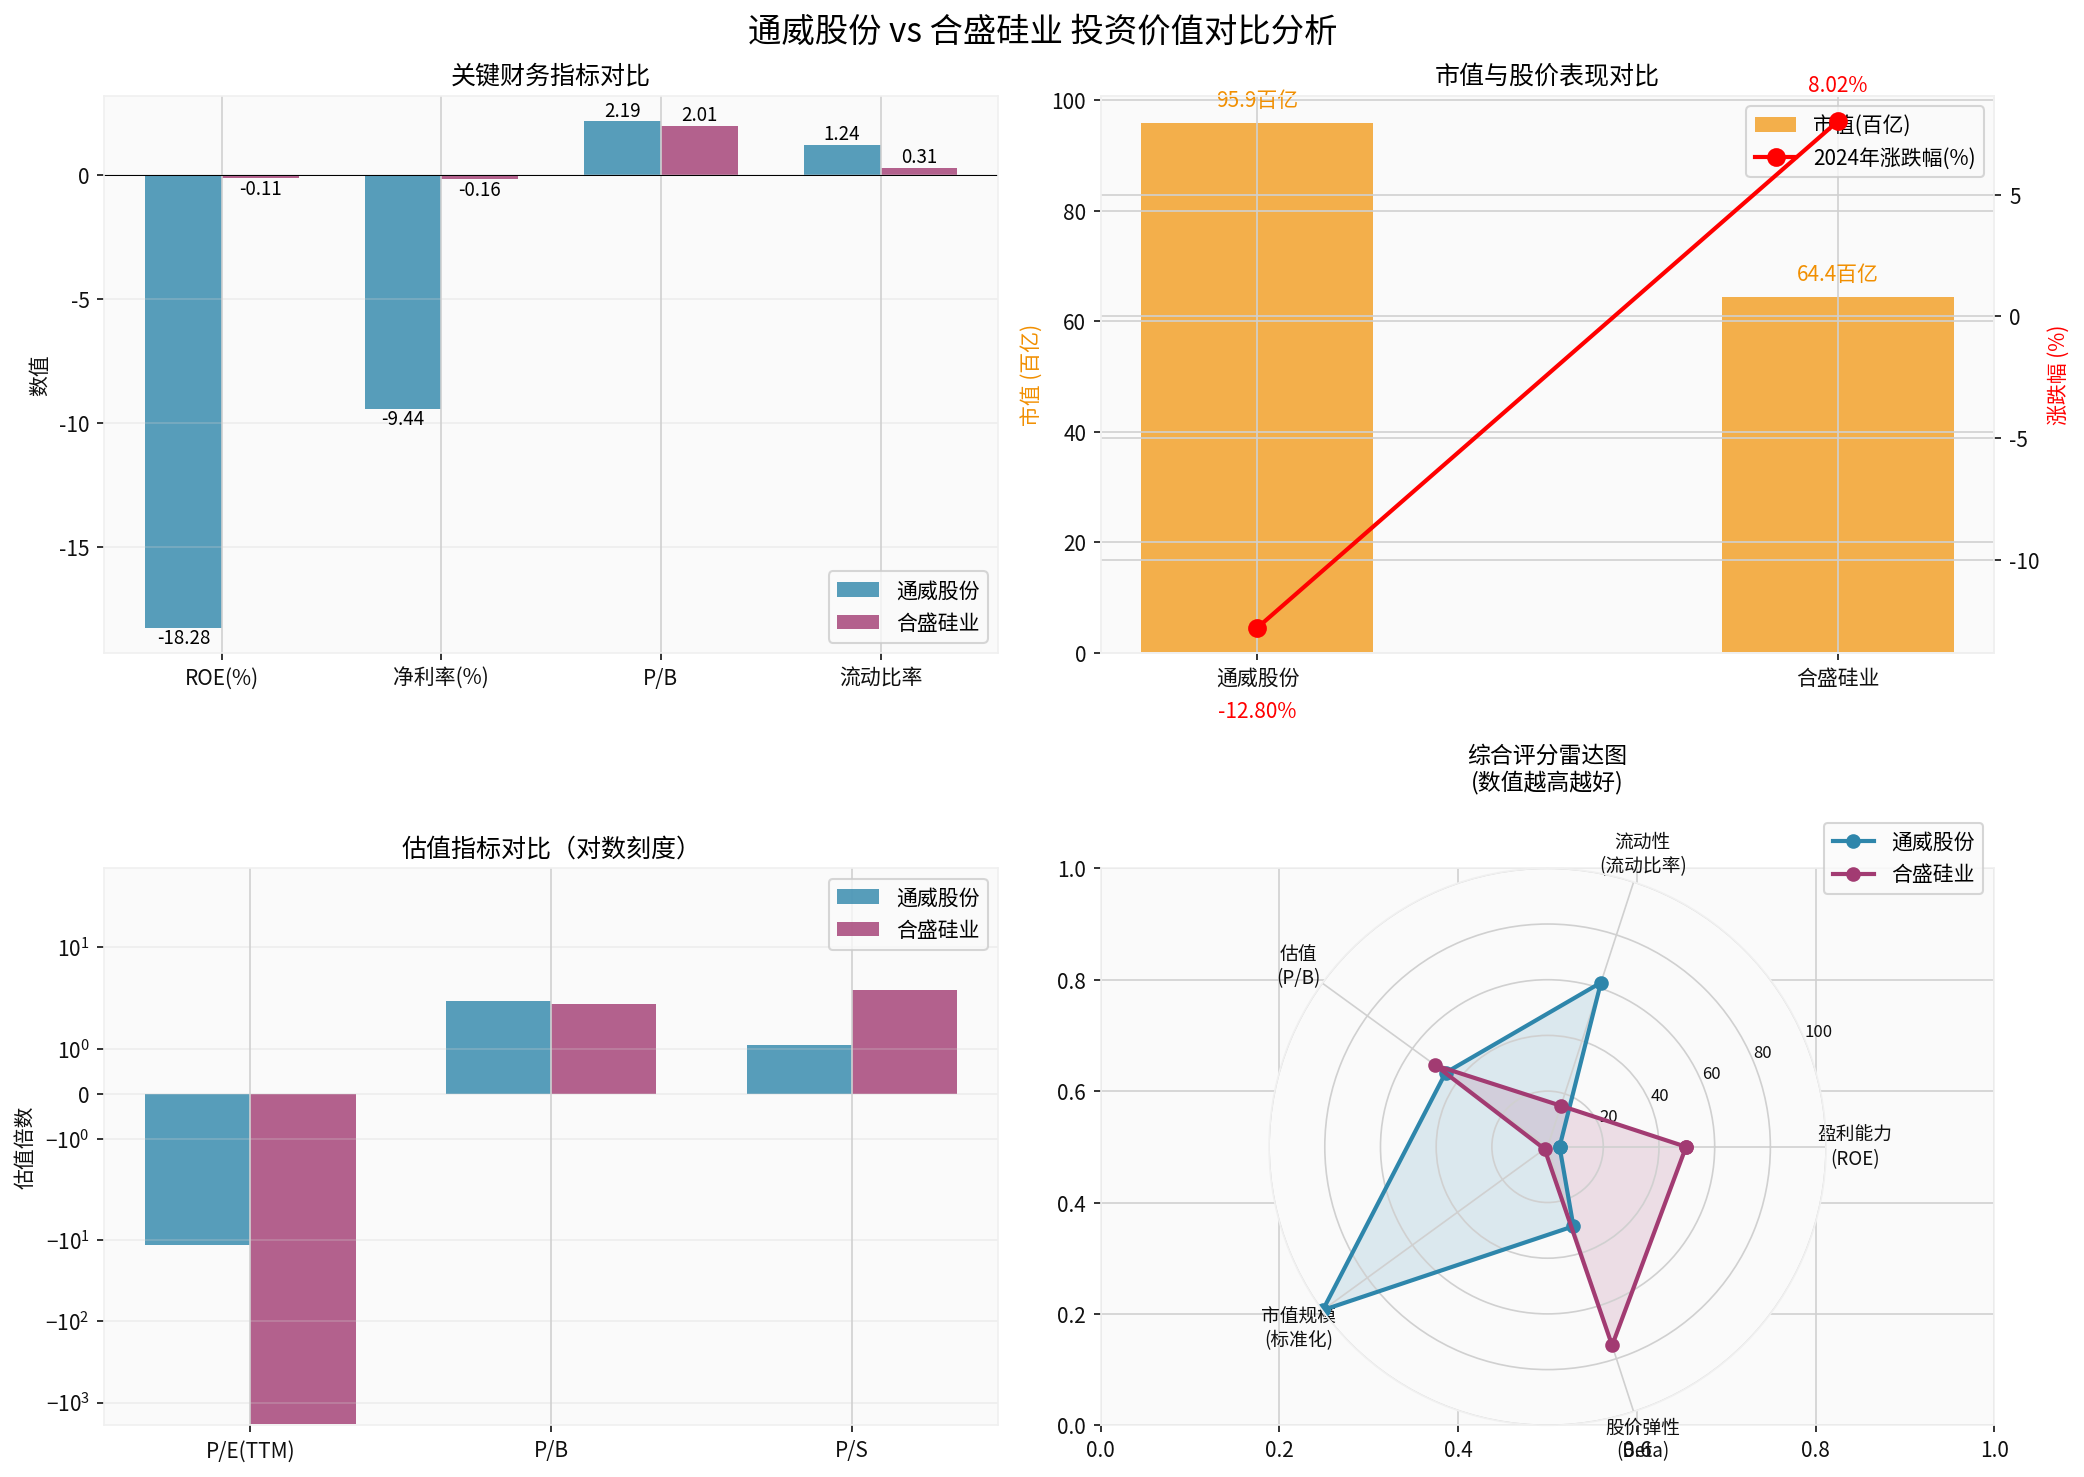
| Indicator | Tongwei Co., Ltd. | Hesheng Silicon Industry | Advantage |
|---|---|---|---|
ROE |
-18.28% | -0.11% | Hesheng Silicon Industry |
Net Profit Margin |
-9.44% | -0.16% | Hesheng Silicon Industry |
2024 Price Change |
-12.80% | +8.02% | Hesheng Silicon Industry |
Market Value |
95.93 billion CNY | 64.43 billion CNY | Tongwei Co., Ltd. |
-
Tongwei Co., Ltd.suffered serious losses, mainly due to:
- Business layout covers polysilicon + solar cells + photovoltaic modules, and the full industrial chain layout leads to “double blow”.
- The cell segment lost -19.81% [3], dragging down overall profits.
-
Hesheng Silicon Industryis near break-even:
- Mainly focuses on industrial silicon + organic silicon, and is relatively less affected by the downstream transmission of photovoltaics.
- Diversified business, organic silicon field provides a certain profit buffer.
| Indicator | Tongwei Co., Ltd. | Hesheng Silicon Industry | Evaluation |
|---|---|---|---|
Current Ratio |
1.24 | 0.31 | Tongwei is safer |
Quick Ratio |
0.99 | 0.11 | Tongwei is safer |
Debt Risk |
Medium Risk | High Risk [0] | Tongwei is better |
Free Cash Flow |
-27.24 billion CNY | -1.09 billion CNY | Hesheng has less pressure |
- Tongwei Co., Ltd. has ample liquidity and can better withstand the industry winter.
- Hesheng Silicon Industry has tight liquidity (current ratio 0.31), short-term debt repayment pressure is large, and financial risks need to be alert.
| Valuation Indicator | Tongwei Co., Ltd. | Hesheng Silicon Industry | Analysis |
|---|---|---|---|
P/B |
2.19x | 2.01x | Hesheng is slightly cheaper |
P/E |
-11.51x (negative) | -1820x (negative) | Both are distorted and have limited reference value |
P/S |
1.09x | 2.99x | Tongwei is cheaper |
Since the ROE of both companies is negative, traditional PE valuation is invalid. It is recommended to use the
- Tongwei Co., Ltd.: PB=2.19x, at the bottom of the industry cycle, but ROE is seriously negative, need to wait for ROE to turn positive signal.
- Hesheng Silicon Industry: PB=2.01x, ROE is near break-even, and will benefit first if the industry recovers.
- Trend: Sideways consolidation, support level at 21.39 CNY, resistance level at 22.21 CNY [0].
- Beta: 0.7 (strong defensive nature).
- KDJ: Golden Cross, short-term rebound momentum exists.
- Trend: Sideways consolidation, support level at 53.00 CNY, resistance level at 55.93 CNY [0].
- Beta: 0.25 (low volatility, strong defensive attribute).
- MACD: Golden Cross, RSI overbought risk, need to be alert to short-term correction.
- Stable Leading Position: The world’s largest polysilicon + cell supplier, the biggest beneficiary of capacity clearance.
- Ample Liquidity: Current ratio 1.24, can survive the industry winter.
- Maximum Elasticity: If polysilicon prices continue to rise, Tongwei has the largest profit elasticity.
- ROE is seriously negative (-18.28%), need to wait for Q4 or 2026 performance verification.
- Full industrial chain layout becomes a burden, downstream drags upstream profit release.
- 2024 decline of -12.80% reflects market concerns about its profitability.
- Conservative Type: Wait for ROE to turn positive signal or Q4 performance improvement confirmation.
- Aggressive Type: Build positions in batches at current prices, betting on 2026 industry reversal.
- Strong Profit Resilience: ROE is near break-even, and will benefit first if the industry recovers.
- Diversified Business: Industrial silicon + organic silicon + polysilicon, less dependent on photovoltaic cycle.
- Relatively Strong Performance in 2024: +8.02% increase reflects market recognition.
- Outstanding Liquidity Risk: Current ratio 0.31, quick ratio 0.11, large short-term debt repayment pressure.
- High debt risk rating [0], need to pay close attention to debt structure.
- RSI overbought, short-term technical correction risk.
- Suggest Waiting: Wait for liquidity improvement or debt risk mitigation signals.
- If Optimistic About Industry Recovery: Can allocate small positions, but need to control positions.
According to web search and brokerage API data [0][6]:
- Q4 2025: Industrial chain prices stabilize and rebound阶段性, upstream silicon material production cuts take effect.
- 2026: Enter continuous capacity clearance cycle, industry governance enters critical period.
- Q2-Q3 2026: It is expected that supply and demand will be dynamically balanced, and profit recovery will be fully显现.
- First Choice: Tongwei Co., Ltd.(60% position)
- Allocation Logic: Left-side layout, betting on 2026 industry reversal
- Risk Control: Control positions before ROE turns positive
- First Choice: Hesheng Silicon Industry(40% position) + Cash (60%)
- Allocation Logic: Wait for right-side signal, build positions in batches
- Risk Control: Pay attention to liquidity indicators, avoid financial risks
- Can polysilicon futures prices stand above 60,000 CNY/ton?
- Q4 2025 performance preview (focus on ROE recovery)
- Industrial chain production scheduling data (verify downstream demand recovery)
- Actual implementation progress of the capacity integration platform
- Overseas demand (especially the impact of U.S. Section 301 tariff)
- New capacity deployment pace
[0] Gilin API Data - Financial data, technical analysis, stock price data of Tongwei Co., Ltd. and Hesheng Silicon Industry
[1] China.com - “Anti-Involution War: How the Photovoltaic Industry Gets Out of the Low-Price Dilemma Through Technology and Integration” (https://hea.china.com/articles/20251224/202512241786632.html)
[2] Sina Finance - “Late Night! Exchange, Heavy Action! What Signal?” (https://finance.sina.com.cn/stock/zqgd/2025-12-24/doc-inhcwafv4707679.shtml)
[3] Sina Finance - “Polysilicon Futures Prices Fall, What’s the Trading Logic Behind It?” (https://www.xincai.com/article/nhcymnr3574945)
[4] S&P Global Ratings - “Deep Adjustment Under Photovoltaic ‘Anti-Involution’, Who Can Survive the Winter?” (https://www.spgchinaratings.cn/upload/20251209_Commentary_PV Industry_R.pdf)
[5] Sina Finance - “The Photovoltaic Industry Moves from ‘Involution’ to ‘Breaking Involution’, but Next Year is the Critical Period for Industry Governance” (https://finance.sina.com.cn/roll/2025-12-20/doc-inhcnchx5972380.shtml)
[6] Zhongtai Securities Research Report - “Anti-Involution Advances Steadily, Optimistic About New Technologies and Optical Storage Synergy” (https://pic-test-gjmetal-1324067834.cos.ap-shanghai.myqcloud.com/newsv2/6831690ff7d142e19e871e6ce0a5ef3a20251223164319.pdf)
Insights are generated using AI models and historical data for informational purposes only. They do not constitute investment advice or recommendations. Past performance is not indicative of future results.
About us: Ginlix AI is the AI Investment Copilot powered by real data, bridging advanced AI with professional financial databases to provide verifiable, truth-based answers. Please use the chat box below to ask any financial question.