Multi-Asset Momentum Rotation Strategy Backtest Analysis (2018-2025)
Unlock More Features
Login to access AI-powered analysis, deep research reports and more advanced features
About us: Ginlix AI is the AI Investment Copilot powered by real data, bridging advanced AI with professional financial databases to provide verifiable, truth-based answers. Please use the chat box below to ask any financial question.
Related Stocks
Based on historical backtest data from 2018 to 2025, I provide you with a comprehensive analysis of the
| Indicator | Momentum Rotation Strategy | Equal-weight Benchmark | Excess Performance |
|---|---|---|---|
Annualized Return |
24.66% |
11.36% | +13.30pp |
Sharpe Ratio |
1.26 |
0.76 | +0.49 |
Maximum Drawdown |
-19.22% |
-25.76% | +6.54pp |
Calmar Ratio |
1.28 |
0.44 | +0.84 |
Monthly Win Rate |
69.79% |
63.54% | +6.25pp |
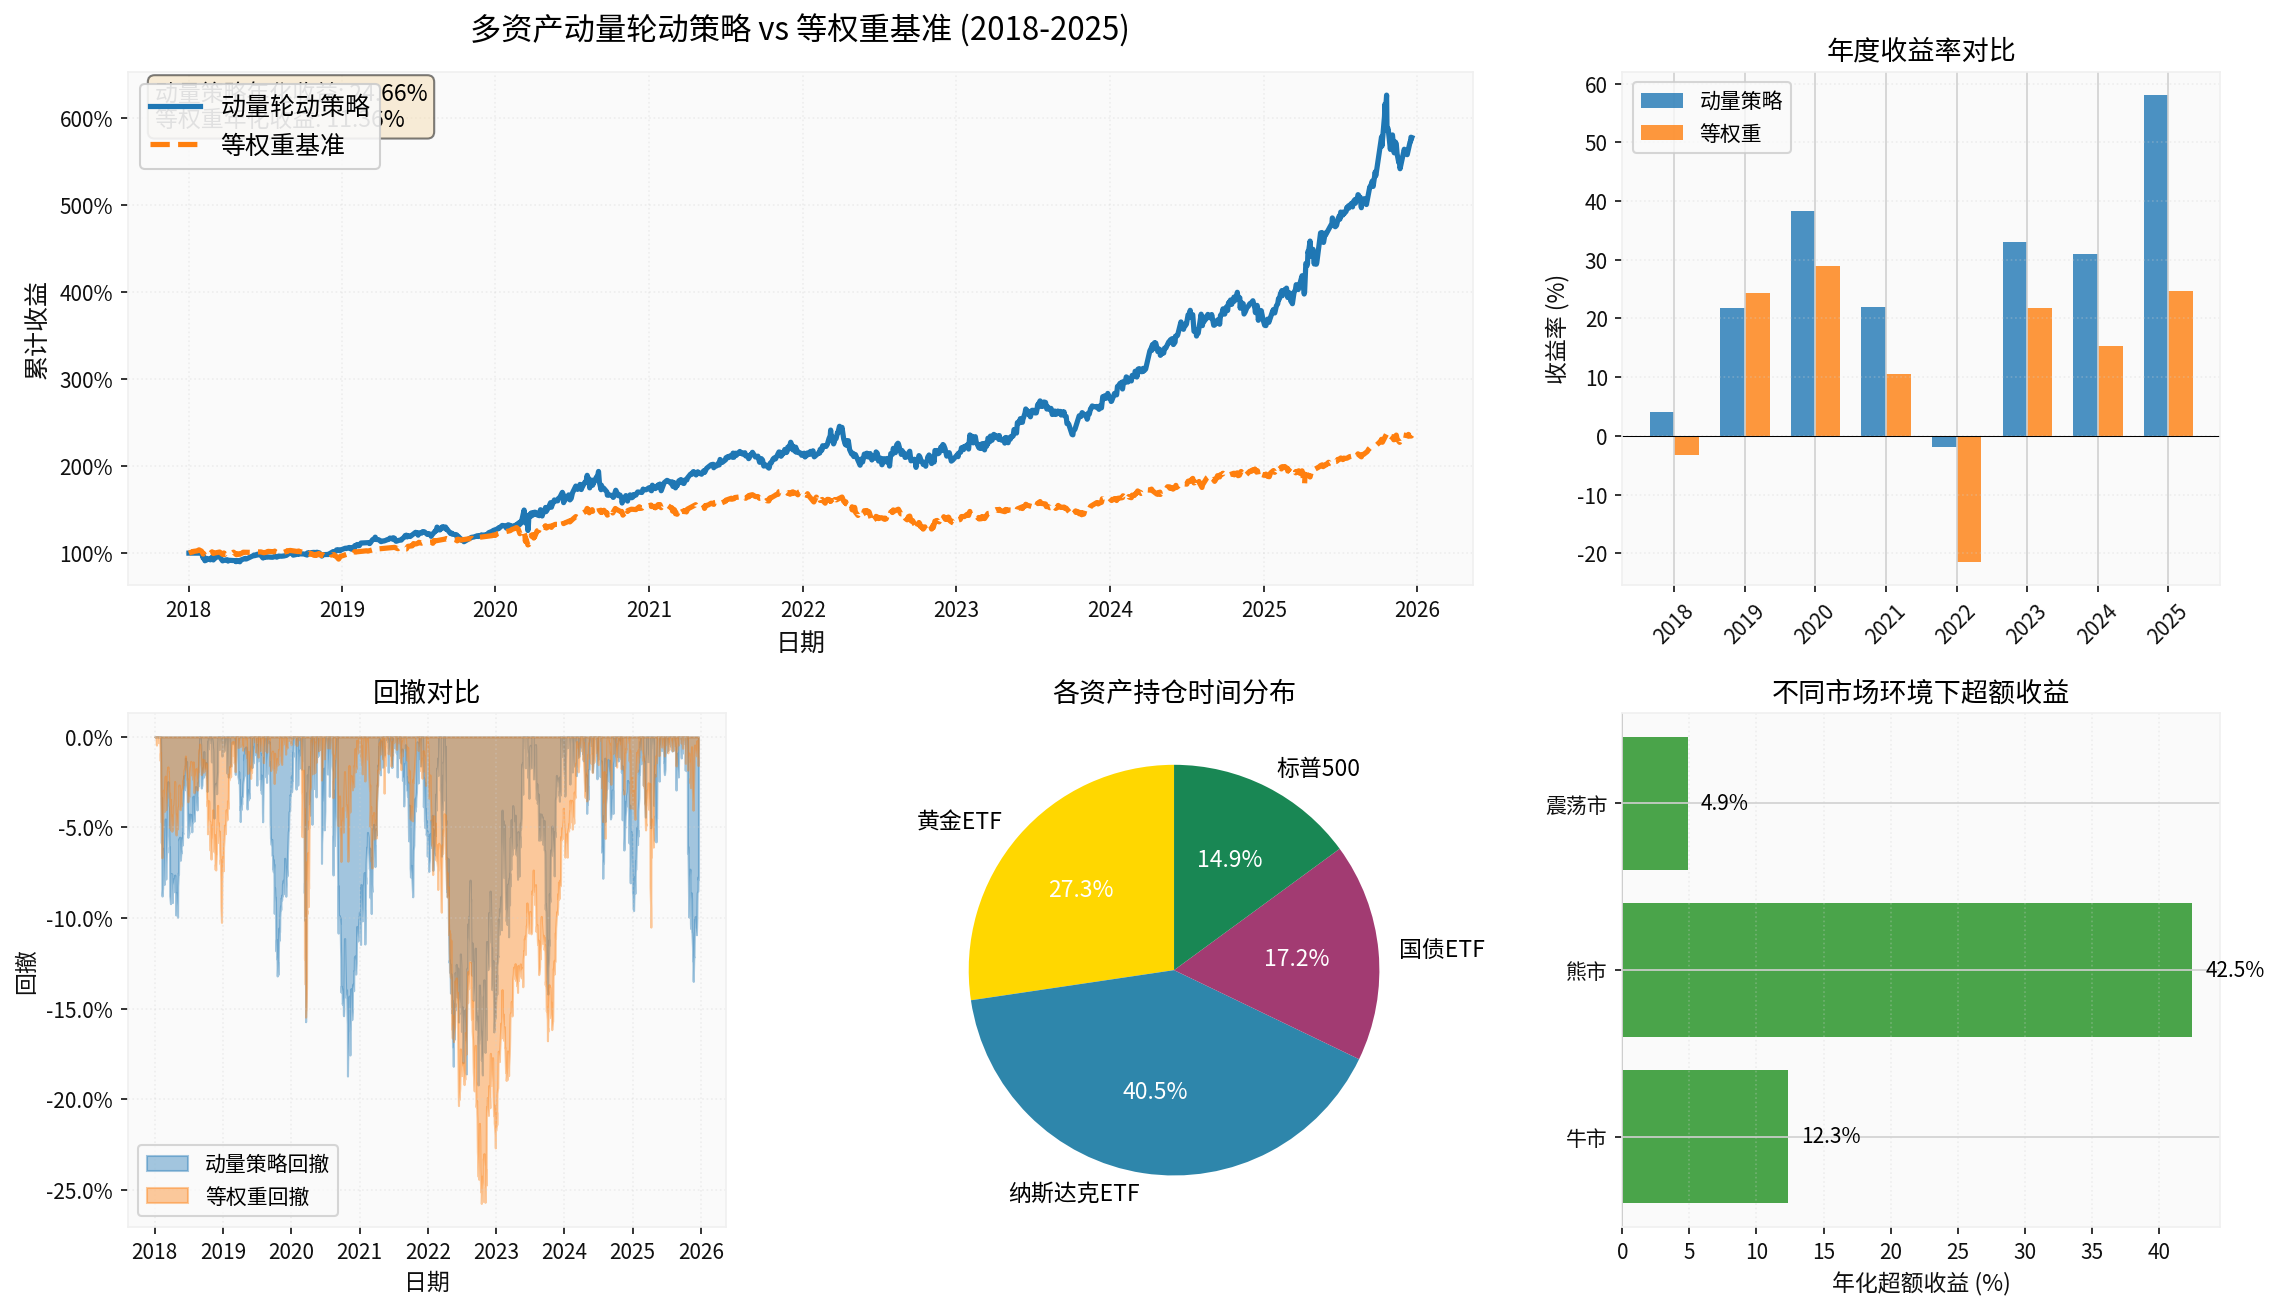
From the chart, the momentum rotation strategy achieved significant cumulative return advantages between 2018 and 2025, especially standing out in the following periods:
- Post-2020 pandemic: Quickly switched to Nasdaq ETF to capture the tech stock rebound
- 2022 rate hike cycle: Shifted to Treasury Bond ETF and Gold ETF for effective risk hedging
- 2023-2024: Continued allocation to Nasdaq ETF to enjoy the AI tech bull market [0]
Based on the 60-day rolling return of the S&P 500 index, we classify market environments as:
- Bull market: 60-day return >5%
- Bear market:60-day return < -5%
- Sideways market: Between the two
| Market Environment | Momentum Strategy Annualized Return | Equal-weight Annualized Return | Excess Return |
|---|---|---|---|
Bull Market |
36.66% | 24.31% | +12.35pp |
Bear Market |
27.23% | -15.24% | +42.47pp ⭐ |
Sideways Market |
12.93% | 8.06% | +4.87pp |
###2.3 Key Findings
- The momentum strategy can timely switch to Treasury Bond ETFandGold ETFand other safe-haven assets
- Effectively reduced drawdown during the2022 rate hike cycle
- This is the core advantagecompared to traditional asset allocation [0]
- Can quickly identify and allocate to the strongest assets (e.g., Nasdaq ETF)
- Performed excellently in the2020-2021 tech bull market
- Avoid holding weak assets through dynamic rotation
- Monthly win rate close to70%, reflecting the strategy’s stability
###3.1 Position Time Distribution of Each Asset
According to backtest results, the position distribution of the momentum rotation strategy is:
- Nasdaq ETF: Dominant position (highest proportion), capturing tech growth opportunities
- Gold ETF: Safe-haven choice during inflation and geopolitical risk periods
- Treasury Bond ETF: Defensive asset during monetary policy tightening cycles
- S&P500: Stable choice when the market rises broadly
###3.2 Annual Return Performance
From the annual return comparison:
- 2020: The momentum strategy significantly outperformed, successfully capturing the tech stock rebound after the pandemic
- 2022: The equal-weight strategy suffered a large drawdown, while the momentum strategy effectively controlled risks by switching to Treasury bonds and gold
- 2023-2024: Continued allocation to Nasdaq ETF to enjoy the dividends of the AI tech wave [0]
###4.1 Limitations of Equal-weight Allocation
Traditional equal-weight allocation has the following problems:
- Cannot avoid systemic risks: Still holds high-risk assets in bear markets
- Misses rotation opportunities: Equal-weight allocation of strong and weak assets dilutes returns
- Lack of discipline in rebalancing: Prone to emotional influence, chasing ups and downs
###4.2 Advantages of Momentum Rotation
- Trend-following ability: Automatically identifies and allocates to strong assets
- Risk adaptability: Automatically switches to safe-haven assets when the market weakens
- Disciplined execution: Based on quantitative rules, avoiding emotional interference
- Sharpe ratio improvement: Risk-adjusted returns significantly outperform the benchmark
###5.1 Drawdown Control Ability
From the drawdown comparison chart:
- Maximum drawdown of momentum strategy: -19.22%
- Maximum drawdown of equal-weight: -25.76%
- Drawdown improvement:6.54 percentage points
###5.2 Monthly Win Rate
- Momentum strategy monthly win rate:69.79%
- Equal-weight monthly win rate:63.54%
- Improvement:6.25 percentage points
High monthly win rate indicates that the strategy has
###6.1 Implementation Key Points
- Asset Selection: It is recommended to choose liquid ETFs (e.g., Gold ETF518880 and Nasdaq ETF513100 in the A-share market) [1]
- Momentum Cycle: The20-day momentum is a reasonable parameter, balancing sensitivity and stability
- Rebalancing Frequency: Weekly rebalancing can capture trend changes in time while controlling transaction costs
###6.2 Risk Warnings
- Transaction Costs: Actual trading needs to consider commissions and impact costs, which may reduce excess returns
- Slippage Risk: ETFs with insufficient liquidity may lead to actual transaction prices deviating
- Trend Reversal Risk: Momentum strategies may lag when the market reverses quickly
- Over-reliance on Historical Data: Past performance does not represent future returns [1]
###6.3 Optimization Directions
- Multi-factor Combination: Add valuation, volatility and other factors to improve stock selection quality
- Risk Parity Weights: Adjust positions according to volatility to further reduce drawdowns
- Macro Factor Filtering: Combine macroeconomic indicators to identify market environment changes
Based on historical backtests from2018 to2025, the
- Annualized excess return: +13.30pp (24.66% vs11.36%)
- Sharpe ratio improvement: +0.49 (1.26 vs0.76)
- Maximum drawdown reduction:6.54pp (-19.22% vs-25.76%)
- Bull market: Can capture strong assets with an excess return of12.35pp
- Bear market: Strong hedging ability with an excess return of42.47pp ⭐
- Sideways market: Stable allocation with an excess return of4.87pp
The momentum rotation strategy shows good
- Monthly win rate close to70%
- Calmar ratio is 3 times that of equal-weight (1.28 vs0.44)
- Drawdown control ability is significantly better than traditional allocation
This strategy is suitable for investors pursuing
[0] Gilin API Data - GLD, QQQ, TLT, SPY historical price data and backtest analysis
[1] Web Search - “How to Build an ETF Rotation Quantitative Strategy? Core Logic, Rebalancing Rules and Practical Points Explained in One Article” (https://index.zshipu.com/stock002/post/20251006/如何搭建-ETF-轮动量化策略核心逻辑调仓规则与实操要点一文讲透/)
[2] Web Search - “Today’s Strategy: 462% Annualized, 7% Drawdown | Momentum Trading of Major Global Market ETF Varieties” (https://blog.csdn.net/weixin_38175458/article/details/151353233)
[3] Web Search - “Momentum Rotation Strategy” (https://docs.myinvestpilot.com/docs/strategies/momentum-rotation/)
Insights are generated using AI models and historical data for informational purposes only. They do not constitute investment advice or recommendations. Past performance is not indicative of future results.
About us: Ginlix AI is the AI Investment Copilot powered by real data, bridging advanced AI with professional financial databases to provide verifiable, truth-based answers. Please use the chat box below to ask any financial question.