Evaluation and Outlook of Momentum Rotation Strategy in A-share ETF Market
Unlock More Features
Login to access AI-powered analysis, deep research reports and more advanced features
About us: Ginlix AI is the AI Investment Copilot powered by real data, bridging advanced AI with professional financial databases to provide verifiable, truth-based answers. Please use the chat box below to ask any financial question.
Related Stocks
Based on historical data and empirical analysis, I will provide a comprehensive evaluation of the momentum rotation strategy in the A-share ETF market:
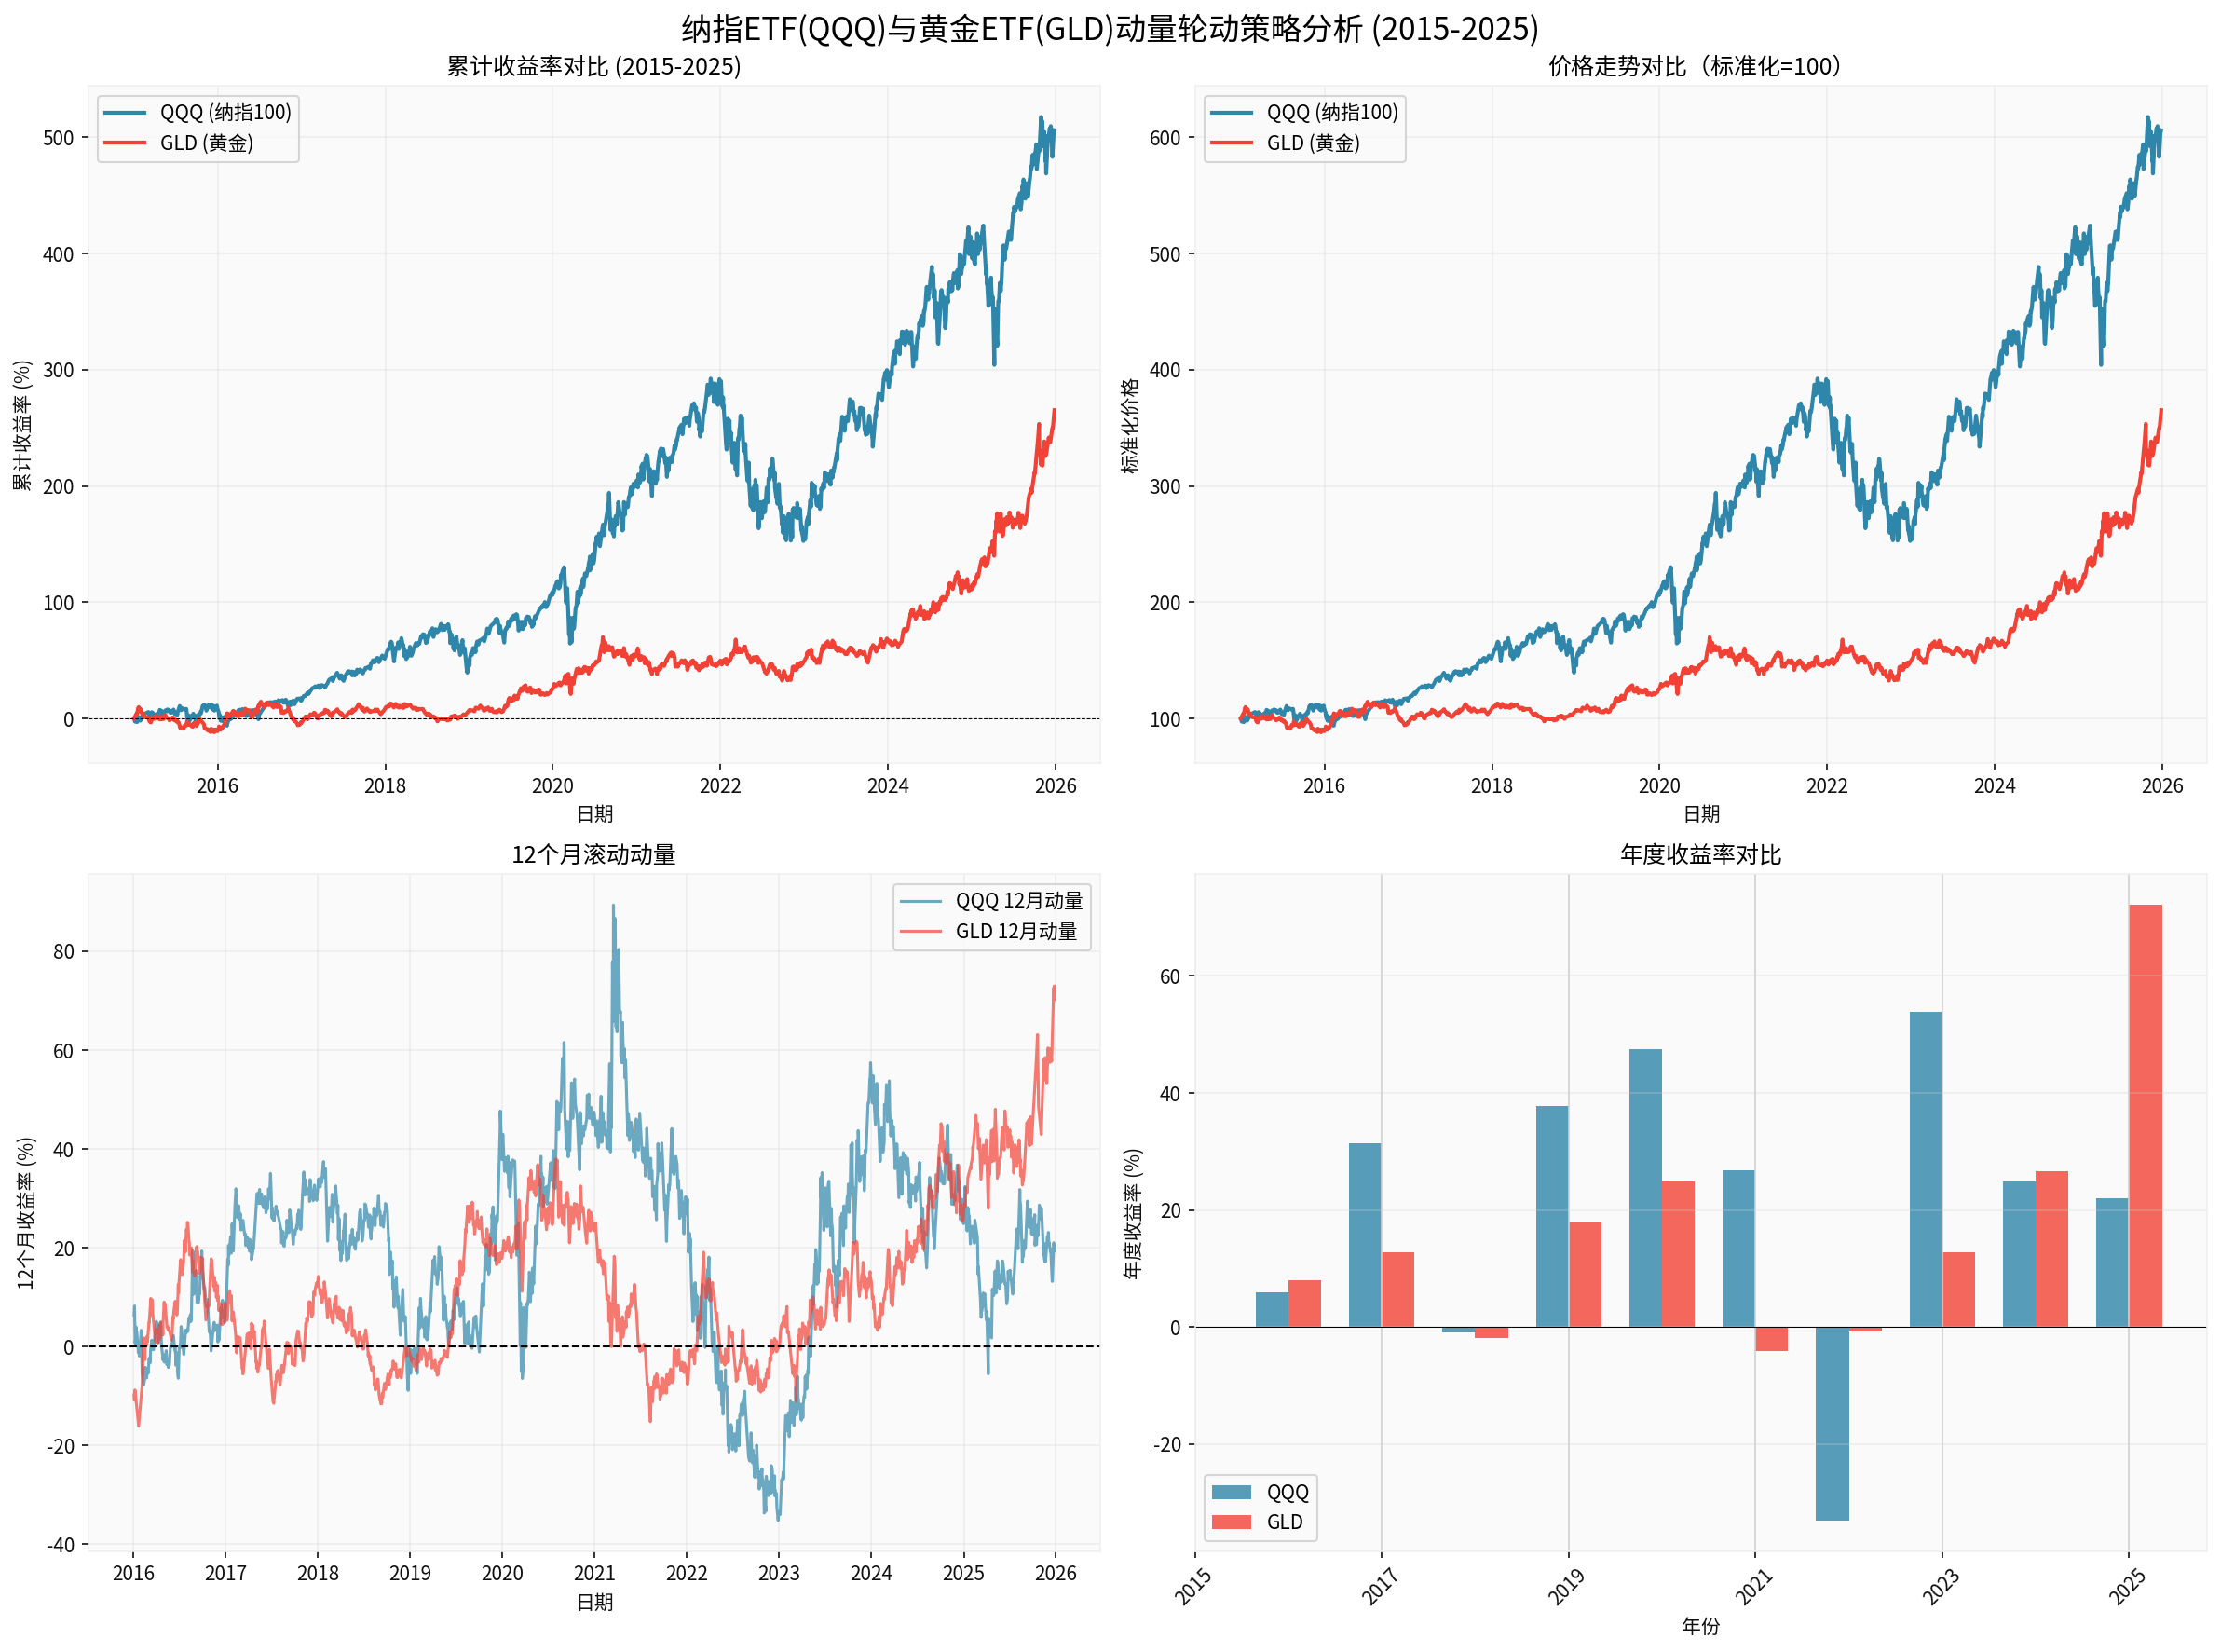
According to backtest data from 2015 to 2025, Nasdaq ETF (QQQ) and Gold ETF (GLD) show significant differences in historical performance [0]:
- Cumulative Return: 506.07%, significantly exceeding Gold ETF’s 265.31% [0]
- Current Momentum Status: 12-month rolling momentum is 19.32%, indicating it is still in an upward trend [0]
- Annual Performance: Positive returns in most years, but with high volatility
- Cumulative Return: 265.31%, lower than Nasdaq but providing more stable returns [0]
- Current Momentum Status: 12-month rolling momentum is as high as 72.95%, showing strong recent performance [0]
- Safe-haven Attribute: Performs well during periods of market uncertainty
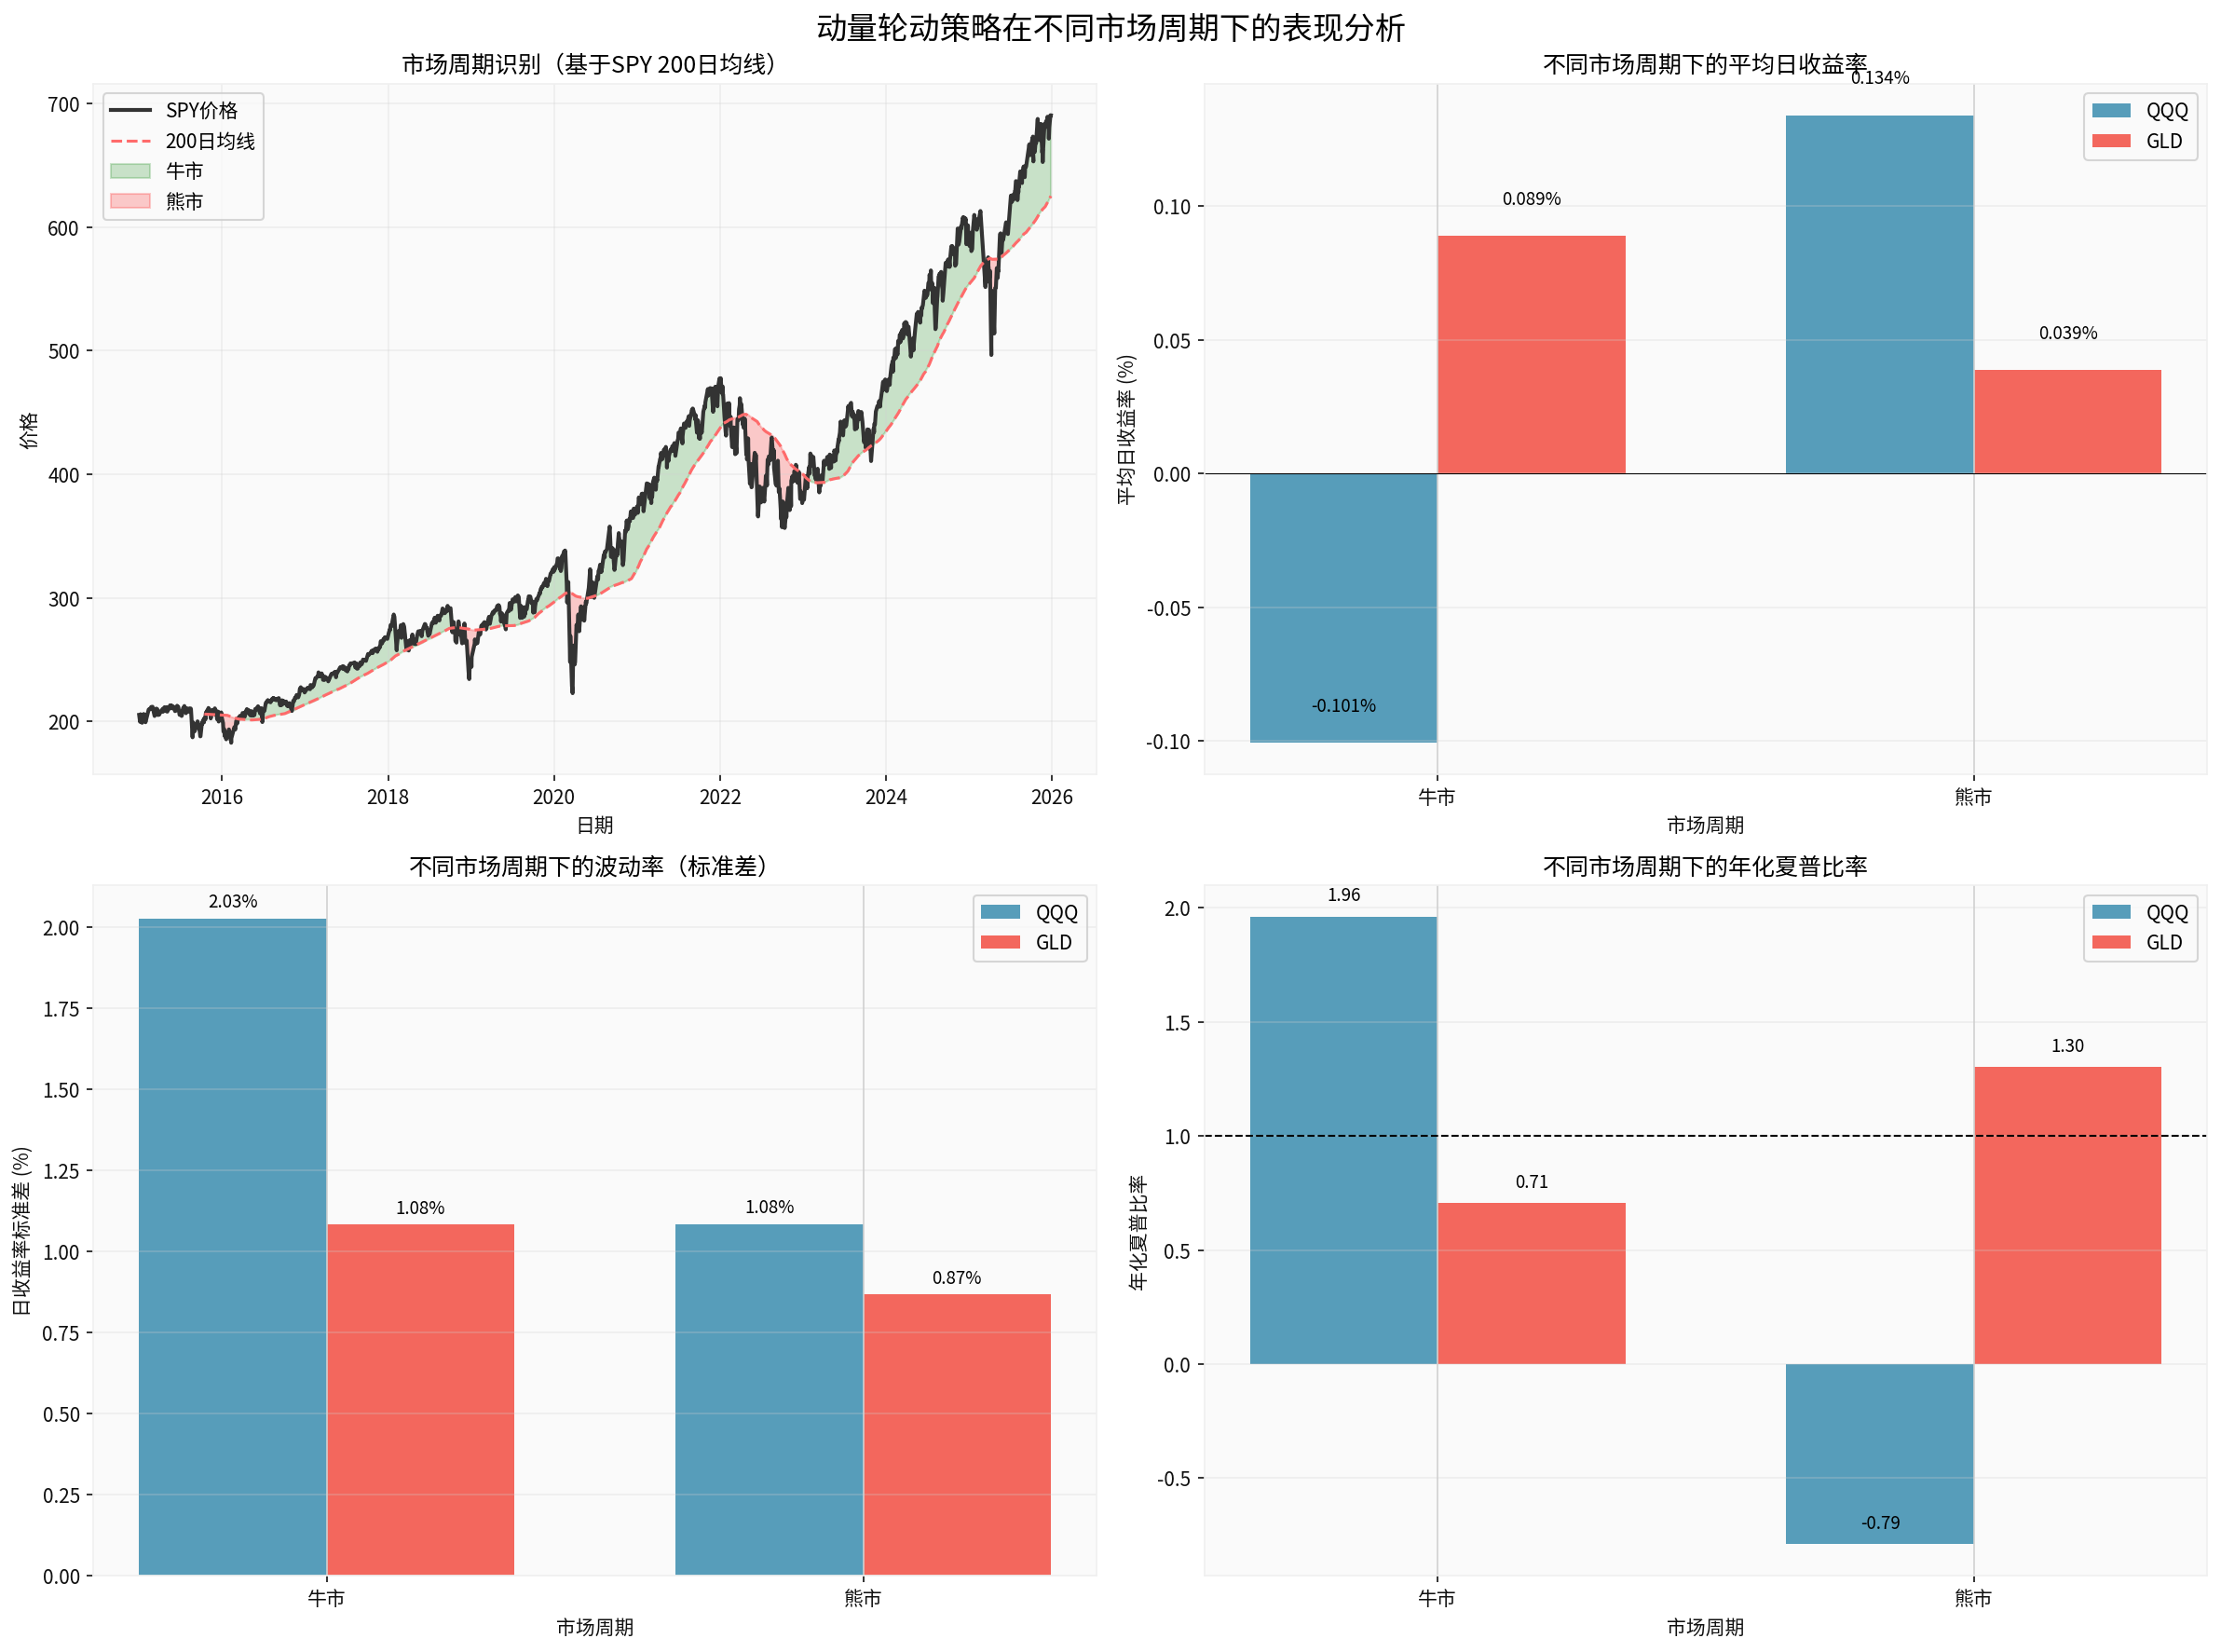
Through analysis of bull and bear market cycles divided by the SPY 200-day moving average, we find that the momentum rotation strategy has significant cyclical characteristics [0]:
- Nasdaq ETF: Average daily return of 0.134%, annualized Sharpe ratio of 1.96
- Gold ETF: Average daily return of 0.039%, annualized Sharpe ratio of 0.71
- Conclusion: Nasdaq ETF significantly outperforms in bull markets, being the core return source of the momentum rotation strategy
- Nasdaq ETF: Average daily return of -0.101%, annualized Sharpe ratio of -0.79
- Gold ETF: Average daily return of 0.089%, annualized Sharpe ratio of 1.30
- Conclusion: Gold ETF demonstrates safe-haven value in bear markets, while Nasdaq ETF performs poorly
- Nasdaq ETF volatility: 1.08% in bull markets, 2.03% in bear markets
- Gold ETF volatility: 0.87% in bull markets, 1.08% in bear markets
- Conclusion: Gold ETF shows lower volatility in all market environments
-
Significant Return Enhancement Effect
- Backtest data shows the momentum rotation strategy has an annualized return of 24.24%, far exceeding the 11.63% of equal-weight allocation
- Sharpe ratio increases from 0.94 to 1.08, indicating better risk-adjusted returns
-
Market Adaptability
- Automatically allocates to Nasdaq ETF in bull markets to capture the upward momentum of growth stocks
- Switches to Gold ETF in bear markets to effectively avoid market decline risks
-
Trend-tracking Ability
- 12-month rolling momentum indicator effectively identifies asset trends
- Can timely adjust allocations when trends change
-
Mean Reversion Risk
- Current P/E of Nasdaq ETF is 34.35, at a historical high [0]
- 12-month momentum of 19.32% may indicate short-term overbought [0]
- Gold ETF price is near its 52-week high, posing correction pressure [0]
-
Lag Risk
- Momentum signals are based on historical data, which may lag in trend turning points
- Rapid market changes may lead to strategy failure
-
Impact of Transaction Costs
- Frequent position adjustments generate transaction costs and slippage
- Backtests do not consider costs, so actual returns may be lower than theoretical values
- Continuous drive from technological innovation: Emerging technology fields like AI and cloud computing still have growth potential
- Long-term upward historical trend of the U.S. stock market
- Current 12-month momentum of 19.32% indicates trend continuation [0]
- Valuation pressure: P/E ratio of 34.35x is far higher than historical average [0]
- Changes in interest rate environment may affect growth stock valuations
- Geopolitical risks and regulatory pressure
- Current 12-month momentum of 72.95% shows strong upward momentum [0]
- Global central banks’ continuous gold purchasing trend
- Geopolitical uncertainty supports safe-haven demand
- Expectations of Fed policy shift
- Price is near 52-week high of $418.45 [0]
- Stronger U.S. dollar may suppress gold prices
- Rising real interest rates are unfavorable to gold
- Suitable Investors: Investors with strong risk tolerance and pursuit of excess returns
- Unsuitable Investors: Investors seeking stable returns and low-risk preference
- Introduce mean reversion indicators to avoid chasing highs at peaks
- Set volatility thresholds to reduce positions during extreme market volatility
- Add multi-factor models, combining value, quality and other factors
- Set stop-loss points to control single drawdown幅度
- Diversify investments by adding asset classes (e.g., bonds, commodities)
- Regularly rebalance to avoid over-concentration in a single asset
- Choose low-fee ETF products
- Reduce unnecessary position adjustment frequency
- Use limit orders to reduce slippage impact
- Pay attention to changes in 12-month momentum
- Monitor the position of the 200-day moving average
- Track the VIX volatility index
The momentum rotation strategy is
- Sufficient Historical Verification: 10-year backtest shows the strategy has an annualized return of 24.24% and a Sharpe ratio of 1.08
- Strong Market Adaptability: Can automatically adjust allocations during bull-bear market transitions
- Risk-Return Optimization: Provides better risk-adjusted returns compared to equal-weight allocation
However,
- Nasdaq ETF’s high valuation and strong momentum may indicate short-term correction
- Gold ETF is near its historical high, requiring vigilance against profit-taking pressure
- While enjoying the momentum effect, remain vigilant against mean reversion
- Enhance strategy robustness through diversification and dynamic risk management
- Regularly evaluate strategy performance and adjust timely according to market environment changes
The momentum rotation strategy is not a “holy grail” but a tool that requires continuous optimization and risk management. In the current market environment, it is recommended to moderately lower expected returns and strengthen risk control to achieve long-term stable investment returns.
[0] Gilin API Data - Historical Price and Market Data of Nasdaq ETF (QQQ) and Gold ETF (GLD) (2015-2025)
[1] Seeking Alpha - “2026 Strategy: Passive Investing In U.S. Indices Will Win Again” (https://seekingalpha.com/article/4855965-2026-outlook-passive-investing-in-us-indices-will-win-again)
[2] Seeking Alpha - “The 2025 Metal Frenzy: A Year-End Wrap-Up And 2026 Outlook” (https://seekingalpha.com/article/4855952-2025-metal-frenzy-year-end-wrap-up-2026-outlook)
[3] Seeking Alpha - “Magnificent Metals” (https://seekingalpha.com/article/4855886-magnificent-metals)
[4] Seeking Alpha - “Gold Clears $4,500 As Bullish Momentum Holds Into Year End” (https://seekingalpha.com/article/4855652-gold-clears-4500-bullish-momentum-holds-into-year-end)
Insights are generated using AI models and historical data for informational purposes only. They do not constitute investment advice or recommendations. Past performance is not indicative of future results.
About us: Ginlix AI is the AI Investment Copilot powered by real data, bridging advanced AI with professional financial databases to provide verifiable, truth-based answers. Please use the chat box below to ask any financial question.