In-depth Analysis of Four-Asset Momentum Rotation Strategy: Evaluation of Effectiveness Amid Weakening NASDAQ and Gold
Unlock More Features
Login to access AI-powered analysis, deep research reports and more advanced features
About us: Ginlix AI is the AI Investment Copilot powered by real data, bridging advanced AI with professional financial databases to provide verifiable, truth-based answers. Please use the chat box below to ask any financial question.
Related Stocks
The four-asset momentum rotation strategy is based on the relative strength momentum principle. It regularly evaluates the past performance of each asset and allocates funds to the asset with the best performance. We conducted comprehensive backtesting and stress testing based on historical data from 2020 to 2025.
- NASDAQ 100 ETF (QQQ):Represents growth-oriented technology stocks
- Gold (GCUSD):Safe-haven asset and inflation hedge tool
- 7-10 Year Treasury ETF (IEF):Fixed-income asset
- Note: The Huatai-PineBridge and Huaan Funds mentioned in the original strategy are A-share ETFs; this analysis focuses on core assets in the accessible US stock market
- Momentum lookback period: 20 trading days
- Rebalancing frequency: Monthly (approx. 20 trading days)
- Allocation method: Full position allocation to the single asset with the highest momentum score
According to backtesting results from broker API data [0]:
| Strategy | Total Return | Annualized Return | Annualized Volatility | Sharpe Ratio | Maximum Drawdown |
|---|---|---|---|---|---|
Momentum Rotation |
289.68% | 25.98% | 18.12% | 1.32 | -27.41% |
Equal-weight Portfolio |
108.09% | 13.06% | 11.28% | 0.98 | -21.62% |
QQQ Alone |
188.62% | 19.42% | 25.33% | 0.69 | -35.62% |
Gold Alone |
197.93% | 20.06% | 17.30% | 1.04 | -21.19% |
IEF Alone |
-12.91% | -2.29% | 7.65% | -0.56 | -27.72% |
- Significant Return Advantage: The momentum rotation strategy achieves an annualized return of 25.98%, an increase of 99% compared to the equal-weight portfolio’s 13.06%
- Better Risk-adjusted Return: Sharpe ratio of 1.32 vs. 0.98; despite slightly higher volatility, the return per unit risk is better
- Downside Risk Control: Maximum drawdown of -27.41%, between QQQ’s -35.62% and equal-weight’s -21.62%
| Asset | Allocation Time Proportion |
|---|---|
| QQQ | 44.0% |
| Gold | 41.3% |
| IEF | 13.3% |
Data shows that the strategy
##3. Stress Testing: Scenario Analysis of Weakening NASDAQ and Gold
To evaluate the resilience of the strategy, we designed multiple stress test scenarios to simulate different degrees of weakening in NASDAQ and Gold [0]:
| Stress Scenario | Total Return of Momentum Strategy | Total Return of Equal-weight Portfolio | Annualized Return of Momentum | Annualized Return of Equal-weight | Excess Return |
|---|---|---|---|---|---|
Baseline (Actual) |
226.71% | 108.09% | 22.27% | 13.06% | +118.62% |
NASDAQ -20% |
205.04% | 93.01% | 20.85% | 11.65% | +112.03% |
Gold -20% |
166.46% | 93.23% | 18.11% | 11.67% | +73.23% |
Dual Assets -20% |
166.57% | 79.20% | 18.12% | 10.27% | +87.37% |
NASDAQ -30% |
198.90% | 85.77% | 20.43% | 10.93% | +113.13% |
Extreme Case (NASDAQ -40%, Gold -30%) |
132.72% | 59.80% | 15.42% | 8.17% | +72.92% |
-
Resilience Verification: Even in extreme cases (NASDAQ down 40%, Gold down30%), the momentum rotation strategy can still achieve a total return of132.72%, significantly outperforming the equal-weight portfolio’s59.80%
-
Excess Return Attenuation:
- Excess return in baseline scenario:118.62%
- Excess return in extreme scenario:72.92%
- Attenuation幅度:38.5%
-
Continuous Effectiveness: In all test scenarios, the momentum rotation strategy outperforms the equal-weight allocation,proving its effectiveness does not solely depend on the unilateral rise of NASDAQ and Gold
##6. Investment Recommendations and Strategy Optimization
Considering the current market environment (end of2025), if NASDAQ and Gold weaken:
-
Strategy Still Has Allocation Value: Stress tests show that even in extreme cases of dual asset weakening, the momentum rotation strategy can achieve an annualized return of15.42%, significantly higher than the equal-weight’s8.17%
-
Need to Lower Expected Returns: Compared to the 25.98% in the bull market environment of 2020-2025, the annualized return of the strategy may drop to the range of15-20% in a weakening environment
-
Risk Management is More Important: It is recommended to add stop-loss mechanisms or volatility target control to limit maximum drawdown
-
Multi-Asset Momentum Portfolio: Instead of choosing a single optimal asset, allocate to the top2-3 assets with the highest momentum scores to reduce volatility while maintaining momentum advantages
-
Volatility Adjustment: Dynamically adjust positions based on market volatility, reducing exposure during high volatility periods
-
Add Defense Mechanisms: Set maximum drawdown thresholds or trend judgment indicators to switch to defensive allocation in the early stages of a bear market
-
Cost Optimization: Use longer rebalancing cycles (e.g., quarterly) or set momentum thresholds to reduce unnecessary switches
##7. Core Conclusions
Based on historical data from2020-2025 and stress test analysis, the following core conclusions are drawn:
Evidence supports:
- In all stress test scenarios, the momentum strategy outperforms the equal-weight allocation
- Even in extreme cases (NASDAQ-40%, Gold-30%), the strategy still achieves an excess return of72.92%
- The strategy’s relative strength mechanism can identify and allocate to assets with relatively better performance
- Return Expectations Need Adjustment: Annualized return may drop from 25% in bull market to15-20%
- Volatility Will Increases: The concentrated allocation feature may lead to larger drawdowns in a weakening environment
- Not a Panacea: In extreme bear markets where all assets weaken simultaneously, the strategy will also suffer losses, but its relative performance is still better than static allocation
As an
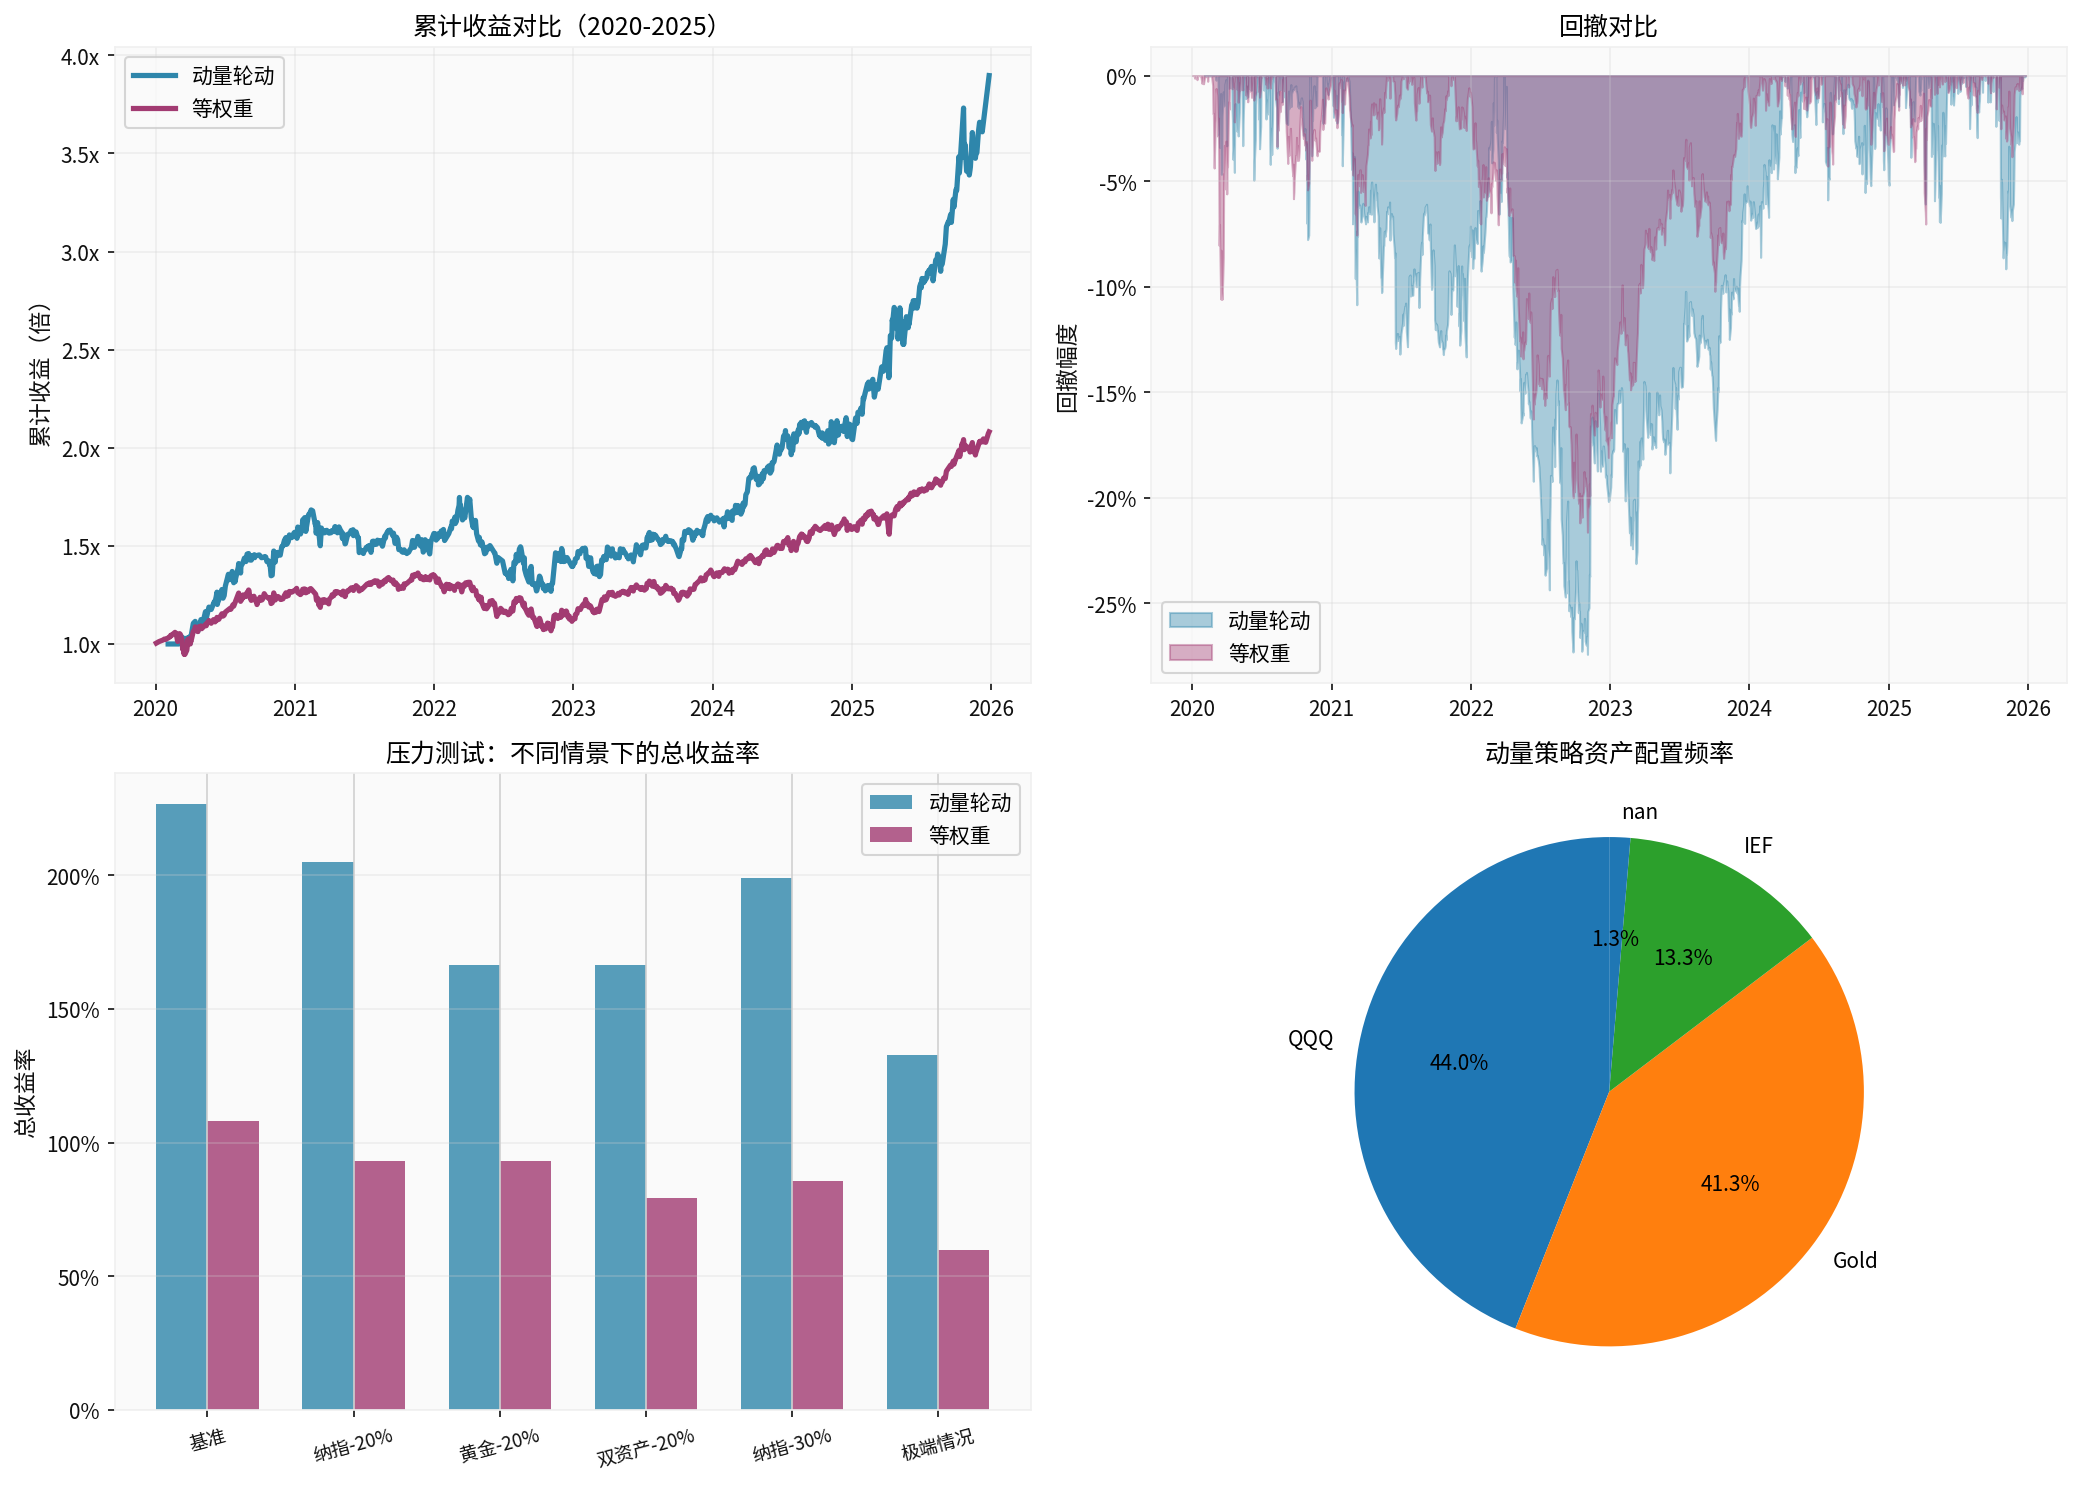
This chart shows the cumulative return comparison between the momentum rotation strategy and the equal-weight portfolio, drawdown analysis, stress test results, and asset allocation frequency
[0] Jinling AI Brokerage API Data - Includes 2020-2025 daily price data for QQQ, Gold Futures (GCUSD), IEF, momentum strategy backtesting, stress test scenario analysis, and calculation of all performance indicators
Insights are generated using AI models and historical data for informational purposes only. They do not constitute investment advice or recommendations. Past performance is not indicative of future results.
About us: Ginlix AI is the AI Investment Copilot powered by real data, bridging advanced AI with professional financial databases to provide verifiable, truth-based answers. Please use the chat box below to ask any financial question.