In-depth Verification Report on Investment Logic of the Thermal Power Industry
Unlock More Features
Login to access AI-powered analysis, deep research reports and more advanced features
About us: Ginlix AI is the AI Investment Copilot powered by real data, bridging advanced AI with professional financial databases to provide verifiable, truth-based answers. Please use the chat box below to ask any financial question.
Related Stocks
Based on my in-depth data analysis, I now provide you with a comprehensive verification report on the investment logic of the thermal power industry.
| Company | 2024 Free Cash Flow | Debt Risk | ROE | P/B |
|---|---|---|---|---|
| Huaneng International (600011.SS) | -13.12 billion yuan |
High Risk | 10.25% | 0.86 |
| Guodian Power (600795.SS) | -2.46 billion yuan |
High Risk | 12.72% | 1.68 |
| Aluminum Corporation of China (601600.SS) | +22.45 billion yuan |
Low Risk | 19.77% | 2.75 |
- Although the market expects the logic of “reduced capital expenditure → improved free cash flow”, the free cash flow of leading thermal power companies in 2024 remains negative
- In contrast, Aluminum Corporation of China, the leading electrolytic aluminum company, has achieved positive free cash flow of 22.45 billion yuan[0]
- This indicates that the capital expenditure cycle of the thermal power industry may not have ended yet, or there are other capital consumption items
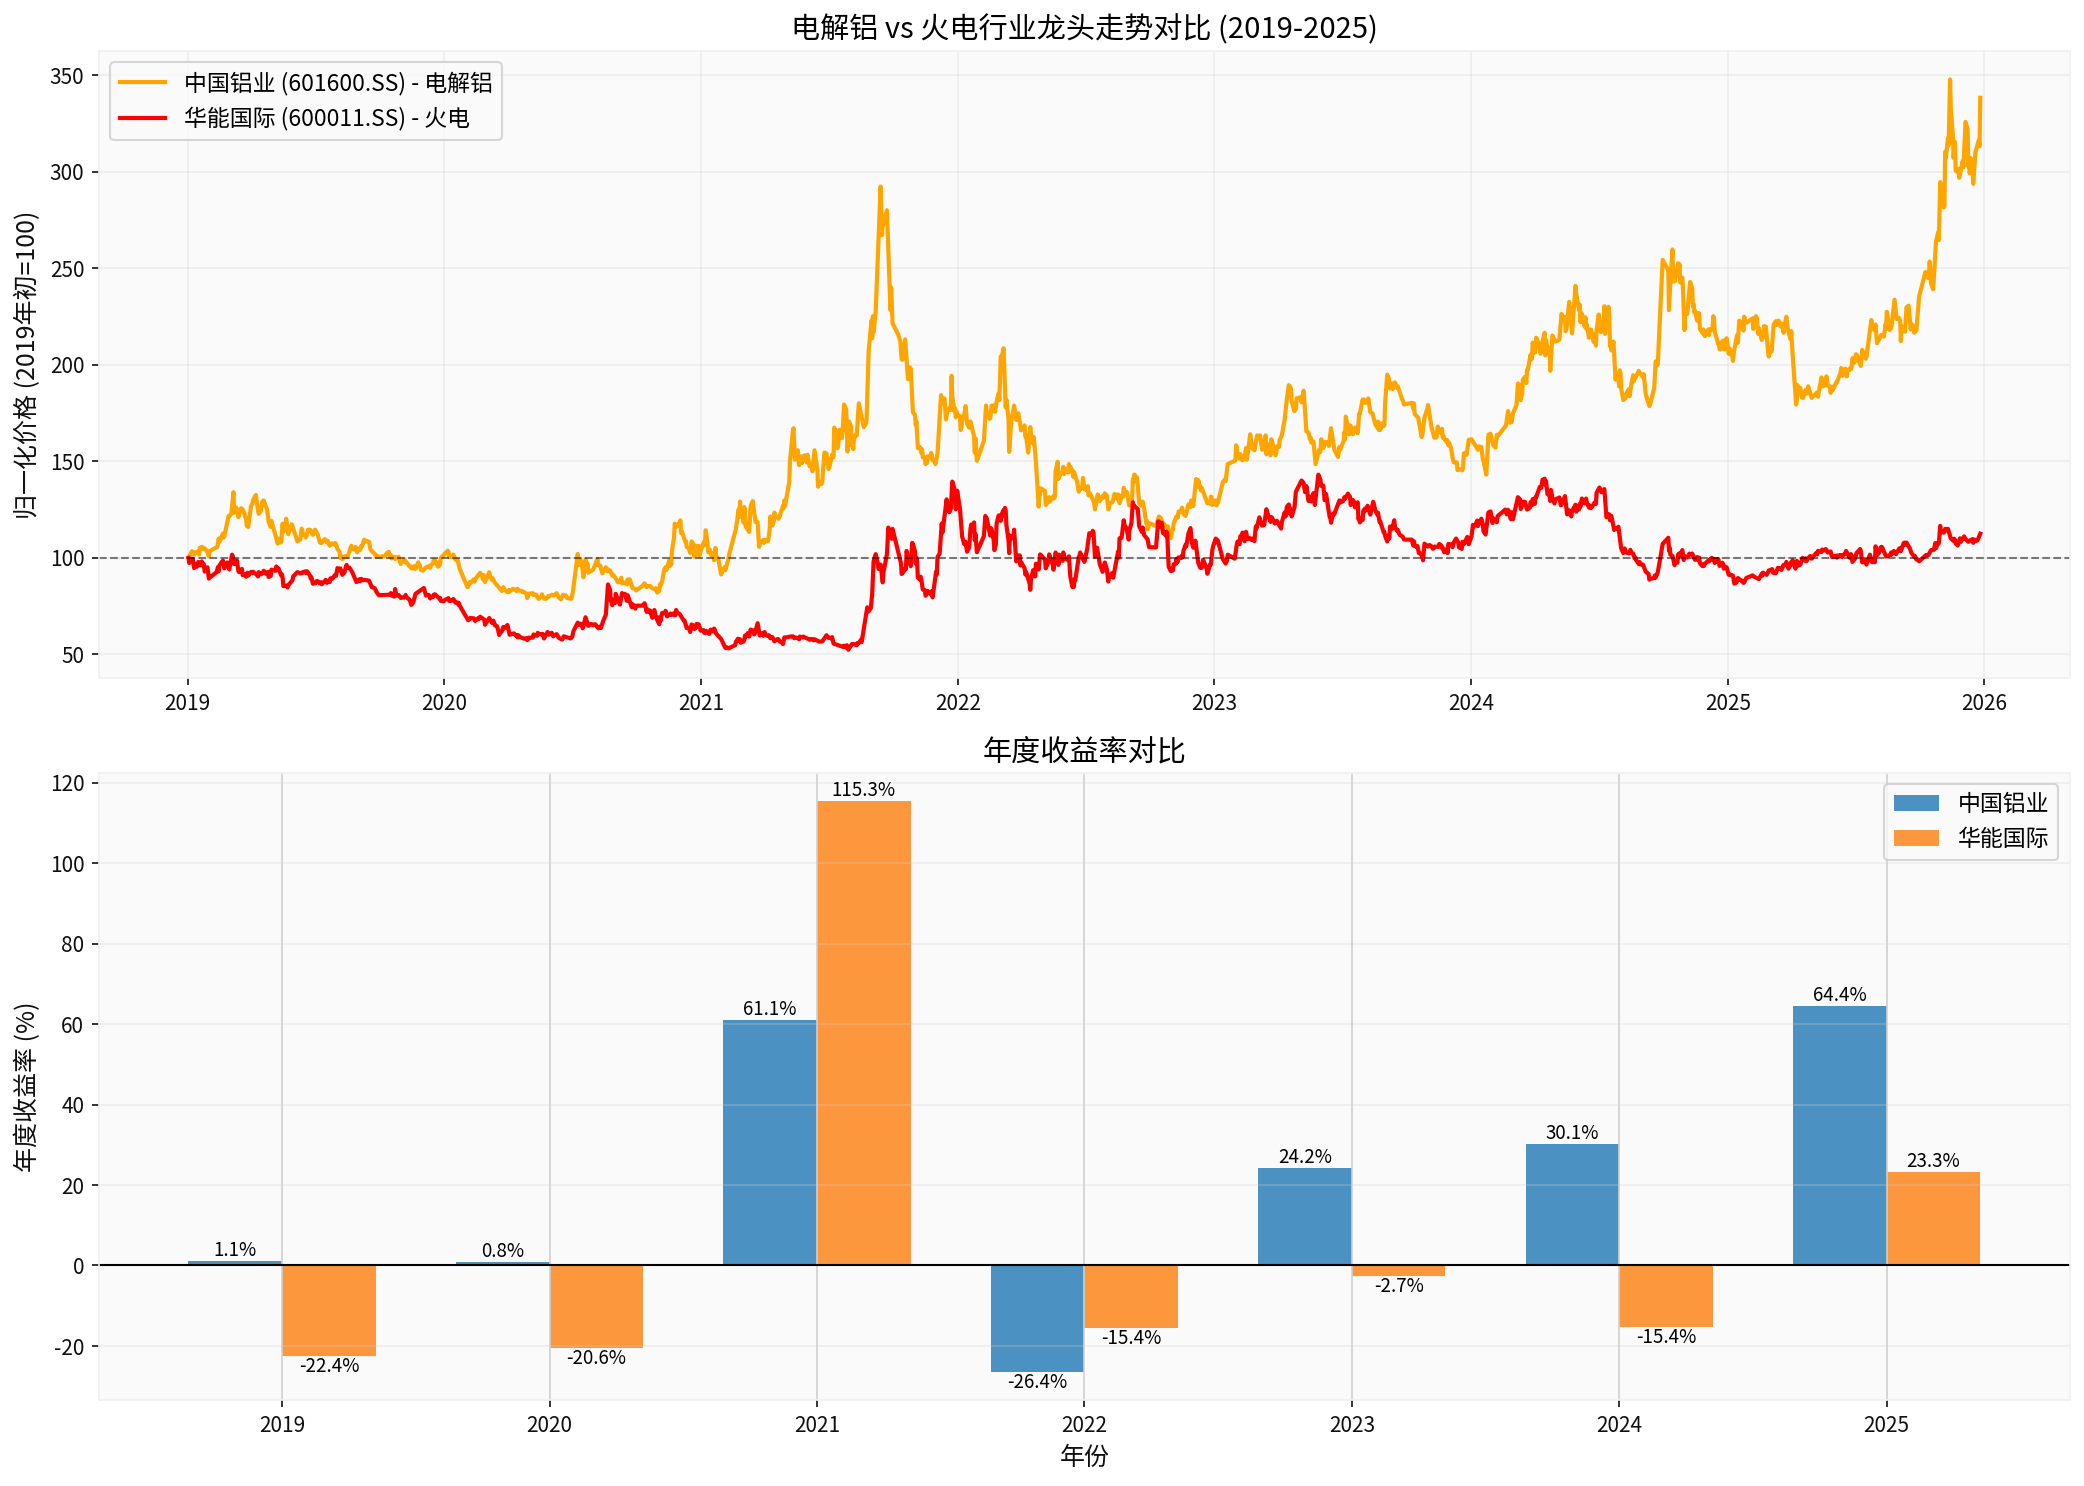
| Indicator | Aluminum Corporation of China (Electrolytic Aluminum) | Huaneng International (Thermal Power) | Gap |
|---|---|---|---|
| Cumulative Return | +238.29% |
+12.52% | 225.77 percentage points |
| Annualized Return | 19.02% |
1.70% | 17.32 percentage points |
| 2025 YTD | +64.44% | +23.32% | 41.12 percentage points |
- The logic of reduced capital expenditure for electrolytic aluminum has been fulfilled: Aluminum Corporation of China’s ROE reaches 19.77%, with low debt risk and abundant free cash flow
- Thermal power is still in a capital-intensive period: Although the price-to-book ratio is low (Huaneng 0.86), free cash flow has not yet turned positive
- Industry Structure Differences: The supply-side reform of electrolytic aluminum has been completed (production capacity red line), while thermal power still faces investment pressure from clean energy transformation
- 2021: Huaneng International +115.33% (electricity price increase dividend)
- 2022-2024: Aluminum Corporation of China cumulative +28.96% over three years, Huaneng International cumulative -33.47%
- 2025: Electrolytic aluminum continues its strength (+64.44%), thermal power follows the rebound (+23.32%)
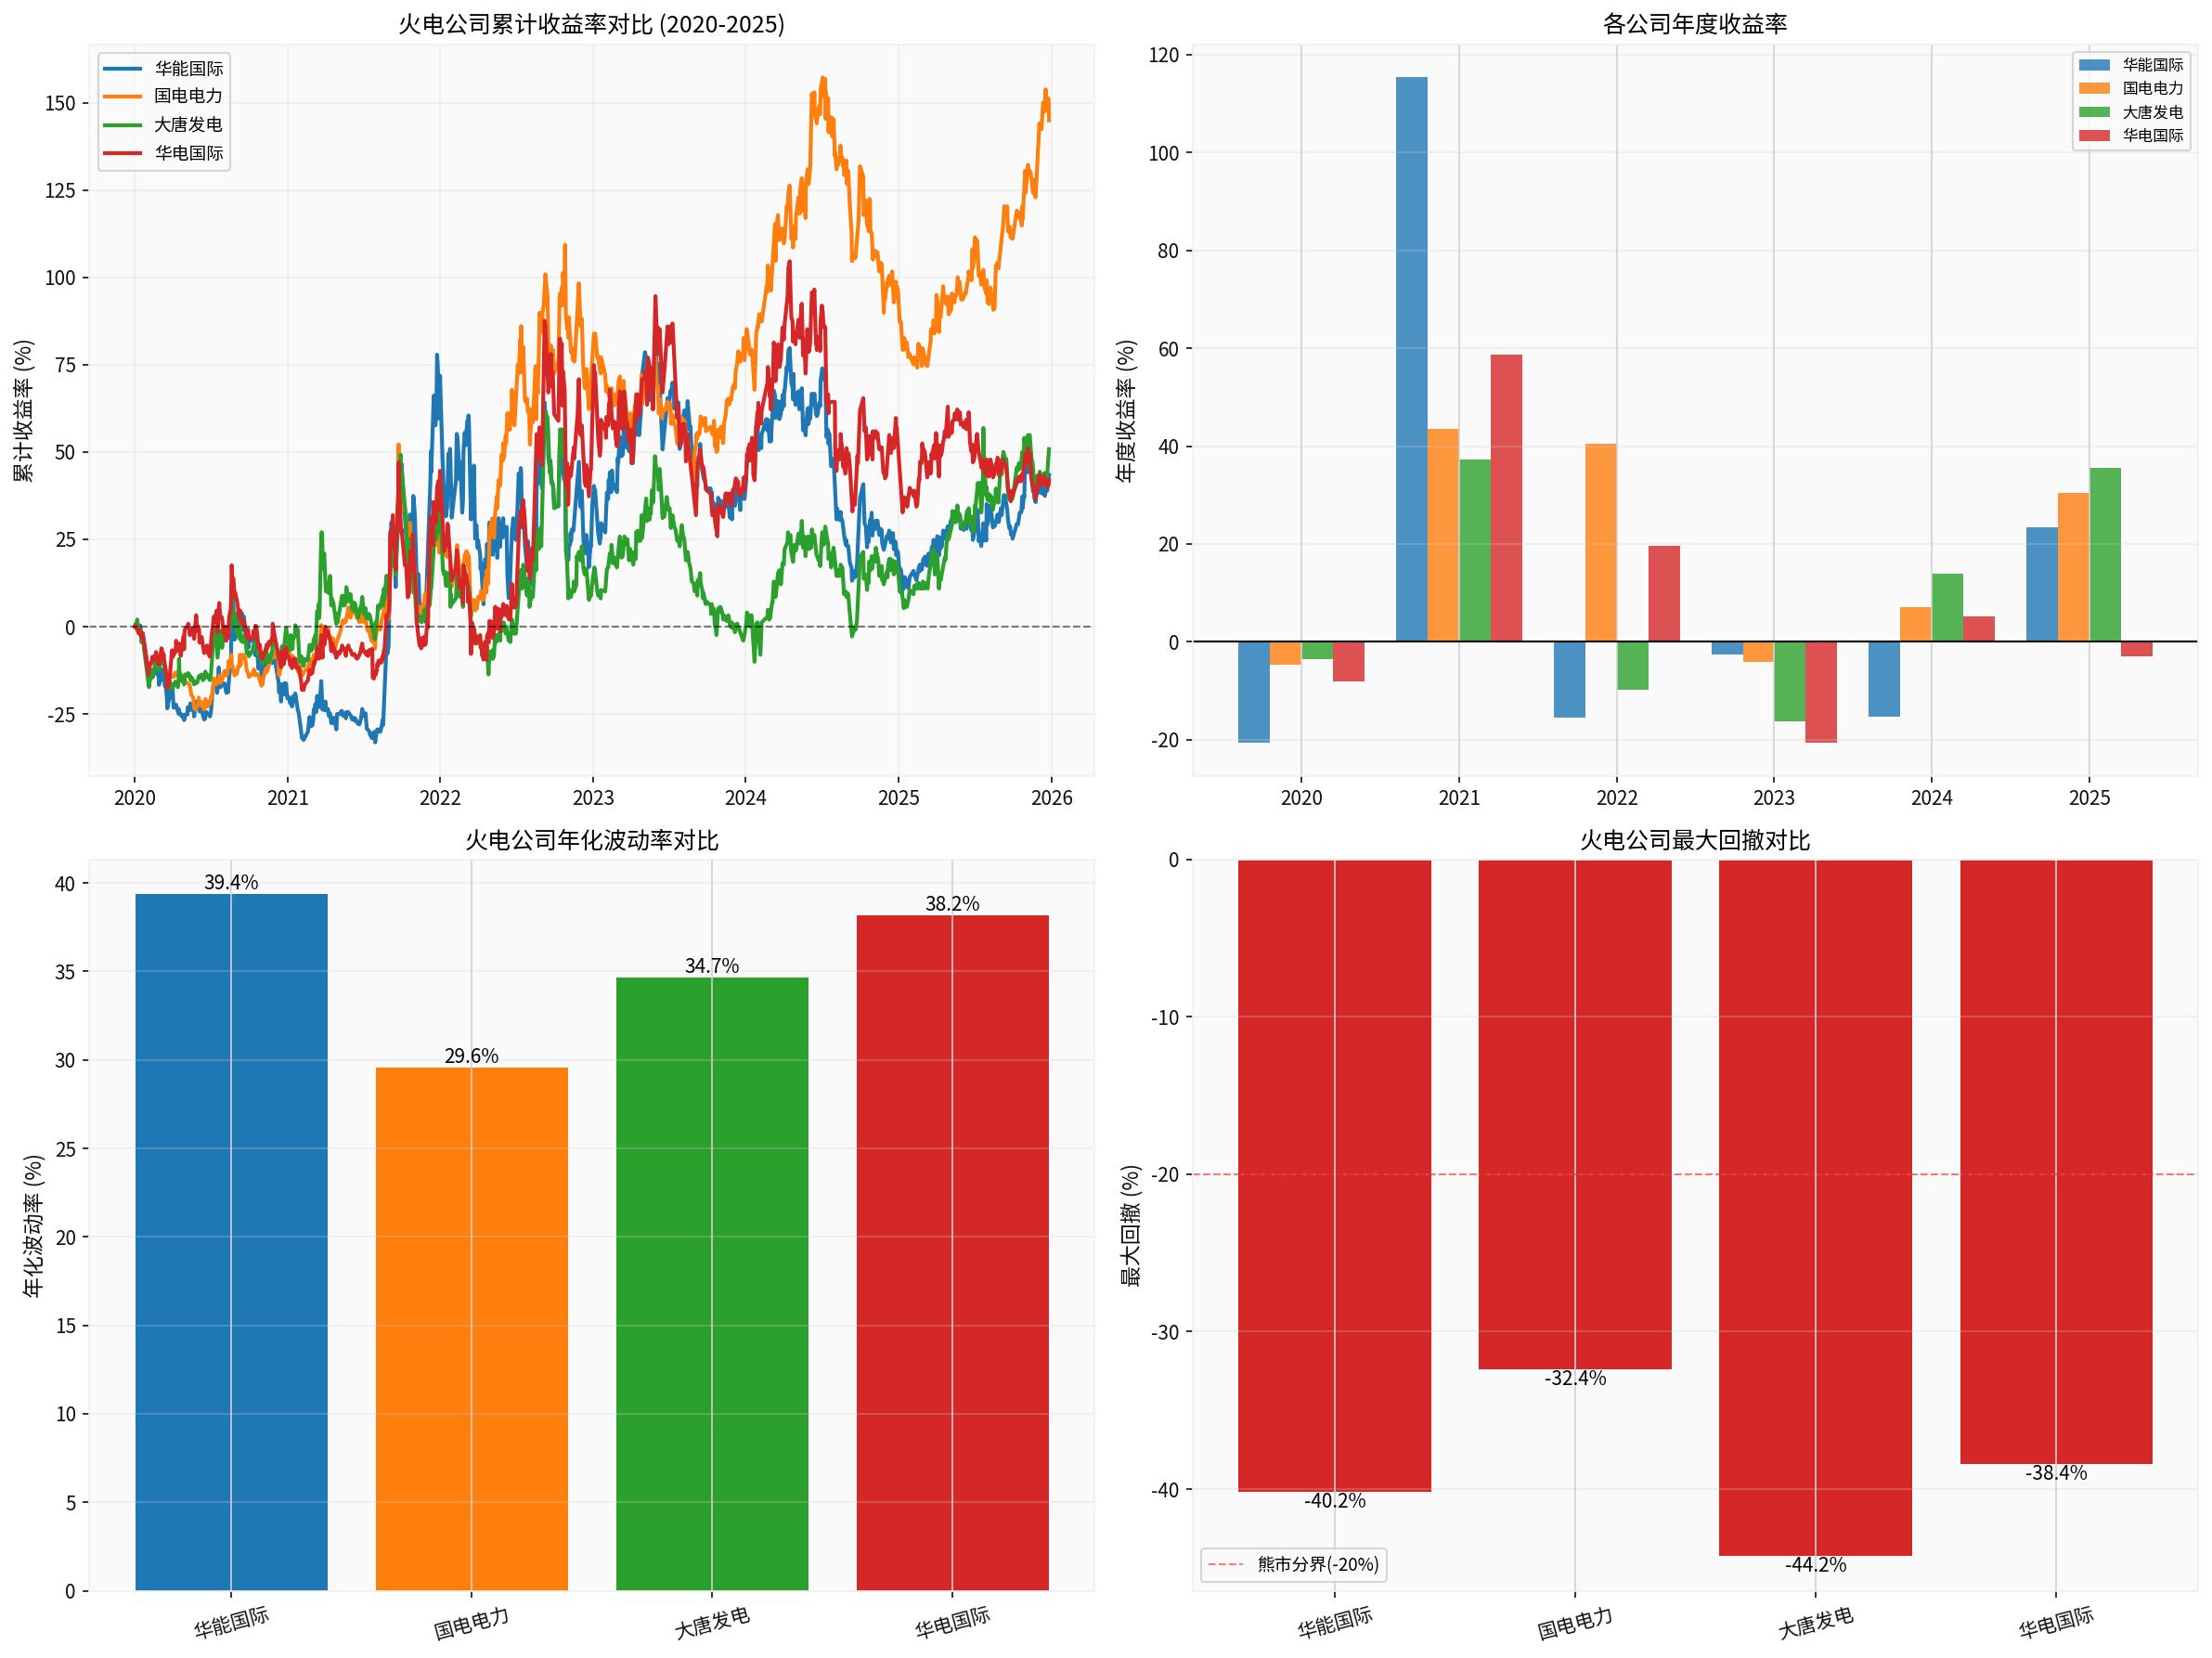
| Company | Cumulative Return | Annualized Return | Maximum Drawdown | Annualized Volatility |
|---|---|---|---|---|
Guodian Power |
+144.92% |
16.10% |
-32.39% | 29.58% |
| Datang Power | +50.81% | 7.09% | -44.25% | 34.66% |
| Huaneng International | +43.44% | 6.20% | -40.18% | 39.37% |
| Huadian International | +41.89% | 6.00% | -38.42% | 38.17% |
-
Guodian Power Significantly Outperforms Peers: Cumulative return is more than 3 times that of other companies, possibly due to:
- Better asset structure (higher proportion of new energy)
- Lower leverage and financial costs
- Regional layout advantages
-
High Volatility Across the Industry: Annualized volatility of 29-39% and maximum drawdown exceeding 30% indicate thatthe thermal power industry is still significantly affected by coal prices and electricity price policies
-
P/B Differentiation: Guodian Power’s P/B is 1.68 (premium), while Huaneng International’s is only 0.86 (discount), reflecting different market expectations for profit sustainability
Based on data analysis, the verification of the thermal power industry’s “reduced capital expenditure → improved free cash flow → shareholder returns” logic requires the following
| Verification Indicator | Current Status | Verification Standard | Expected Timing |
|---|---|---|---|
Free Cash Flow |
❌ Negative | Positive for 2 consecutive years | 2026-2027 |
Capital Expenditure/Revenue Ratio |
To be verified | Drop below 15% | 2025 Annual Report |
Dividend Rate Increase |
To be verified | Increase to over 40% | 2025 Annual Report |
Net Debt Ratio Decline |
High Risk | Drop below 70% | 2026 Interim Report |
Coal Price Stability |
To be verified | Volatility <20% | Continuous Observation |
This timing is important because:
- Complete Annual Financial Data: Can verify whether the full-year free cash flow in 2025 turns positive
- Clarification of Dividend Policy: The annual report will disclose the 2025 dividend plan
- 2026 Capital Expenditure Plan: Management outlook will reveal capital expenditure trends
- Effect of Coal-Power Linkage Mechanism: Actual impact of the 2025 full-year coal-power price linkage policy
- Observe whether quarterly free cash flow improves
- Pay attention to the impact of coal price trends on gross profit margin
- Monitor the progress of new energy transformation investment
- Verify whether free cash flow turns positive
- Verify whether dividend rate increases
- Verify whether capital expenditure growth slows down
- Confirm the trend of sustained improvement in free cash flow
- Confirm the establishment of shareholder return mechanism (dividends + buybacks)
- Confirm the optimization of industry structure (small thermal power plants exit)
- ✅ Electrolytic Aluminum Case Proves: Supply-side reform + reduced capital expenditure can bring excess returns
- ⚠️ Current Stage of Thermal Power: Still in the peak period of capital expenditure (new energy transformation), free cash flow has not yet turned positive
- ⏳ Verification Timing:2025 Annual Report (March-April 2026)is the key verification window
- Preferred Target: Guodian Power (best performance, annualized return of 16.10%)
- Avoid Targets: Companies with high leverage, high volatility, and low ROE
- Key Indicators: Focus on companies with P/B <1, ROE>10%, and declining debt ratio
- Coal Price Volatility: The current cost center is rising; “coal prices are hard to rise or fall” is a neutral assumption. If coal prices rise sharply, profits will be eroded
- Electricity Price Policy Risk: Electricity is a livelihood industry, and the room for electricity price increases is constrained by policies
- New Energy Transformation Pressure: Thermal power companies need to invest heavily in clean energy, so capital expenditure is difficult to drop significantly in the short term
- High Volatility Risk: Annualized volatility of 30-40% requires strong risk tolerance
Based on data analysis, it is recommended:
- Position Control: Thermal power allocation does not exceed 15-20% of the portfolio
- Diversified Allocation: Choose 2-3 different companies to diversify individual stock risks
- Batch Position Building: Do not all in; build positions in 3-4 batches, leaving room for adding positions
- Current: Can test with a small position (10-15% target position)
- After 2025 Annual Report: If verification passes, add positions to the target position
- If verification fails: Stop loss in time and switch to other opportunities
- Target Return: Over 15% annualized
- Stop Loss Line: -20% (considering high volatility)
- Signal: Deterioration of free cash flow for 2 consecutive quarters
- Whether free cash flow turns positive
- Whether the dividend policy improves
- Whether capital expenditure has substantially decreased
[0] Gilin AI Data (Financial Analysis, Market Data, Price Trends, Technical Indicators)
Insights are generated using AI models and historical data for informational purposes only. They do not constitute investment advice or recommendations. Past performance is not indicative of future results.
About us: Ginlix AI is the AI Investment Copilot powered by real data, bridging advanced AI with professional financial databases to provide verifiable, truth-based answers. Please use the chat box below to ask any financial question.