In-depth Analysis of Industry Allocation Logic of CSI A500 Index and Impact of ETF Option Launch
Unlock More Features
Login to access AI-powered analysis, deep research reports and more advanced features
About us: Ginlix AI is the AI Investment Copilot powered by real data, bridging advanced AI with professional financial databases to provide verifiable, truth-based answers. Please use the chat box below to ask any financial question.
Related Stocks
Now let me provide you with a systematic and comprehensive analysis report:
The CSI A500 Index represents the
- CSI 300: Mainly relies on market capitalization and liquidity for sampling, leading to excessive proportions of traditional large-cap sectors (finance, real estate, cyclicals)
- CSI A500: Starts from 93 CSILevel 3 Industries, selecting securities with larger market capitalization and better liquidity from each industry as samples to ensure appropriate weights for each representative industry [1]
According to the latest data analysis [1][2]:
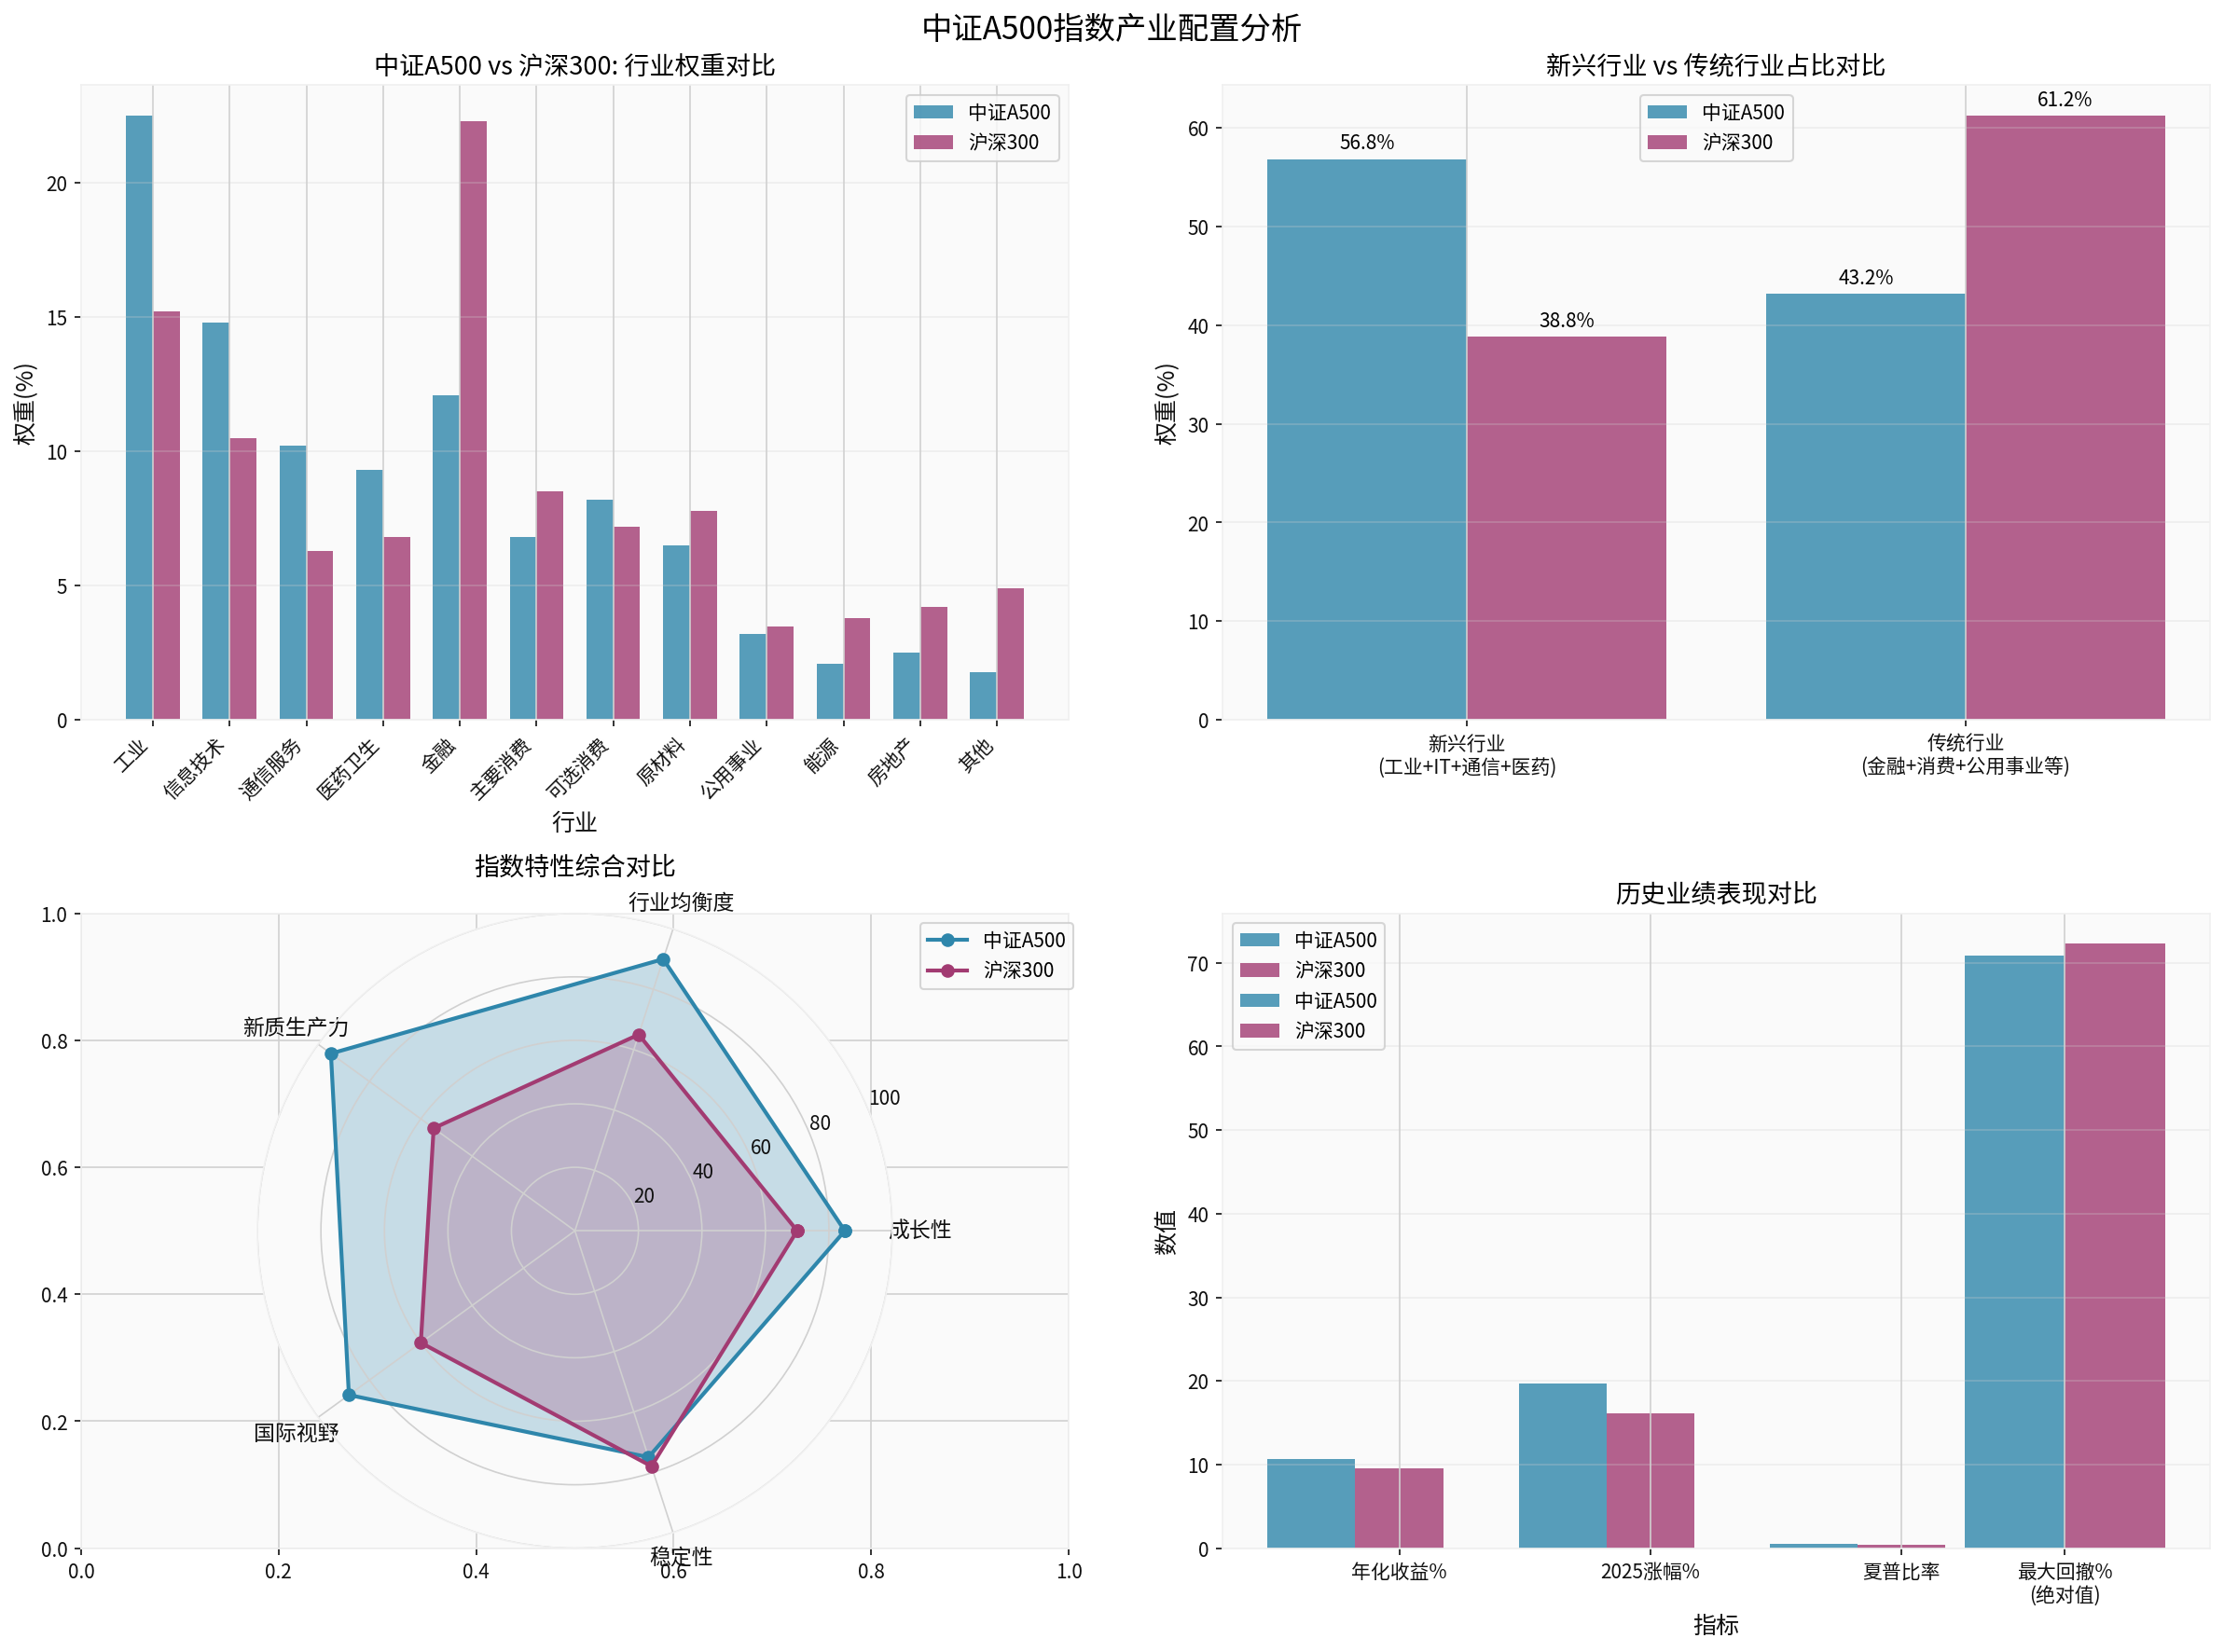
- Industry: 22.5% (CSI 300 only 15.2%)
- Information Technology: 14.8% (CSI 300 only 10.5%)
- Communication Services: 10.2% (CSI 300 only 6.3%)
- Healthcare: 9.3% (CSI 300 only 6.8%)
- Finance: Only 12.1% (CSI 300 up to 22.3%)
- Reflects the “de-financialization” trend, aligning with the direction of China’s economic structural transformation [2]
- ESG Screening: Exclude listed company securities with ESG ratings of C or below
- Interconnection Screening: Must be within the scope of Shanghai-Hong Kong Stock Connect or Shenzhen-Hong Kong Stock Connect securities
- Industry Balance Screening: Ensure the free float market capitalization distribution of each primary industry is as consistent as possible with the sample space [3]
This design makes the CSI A500 Index:
- Cover 89 CSI Level 3 Industries(CSI 300 only about 60)
- ESG ratings of A or above account for more than 53%
- The overseas revenue proportion of constituent stocks is significantly higher than that of CSI 300 [1][3]
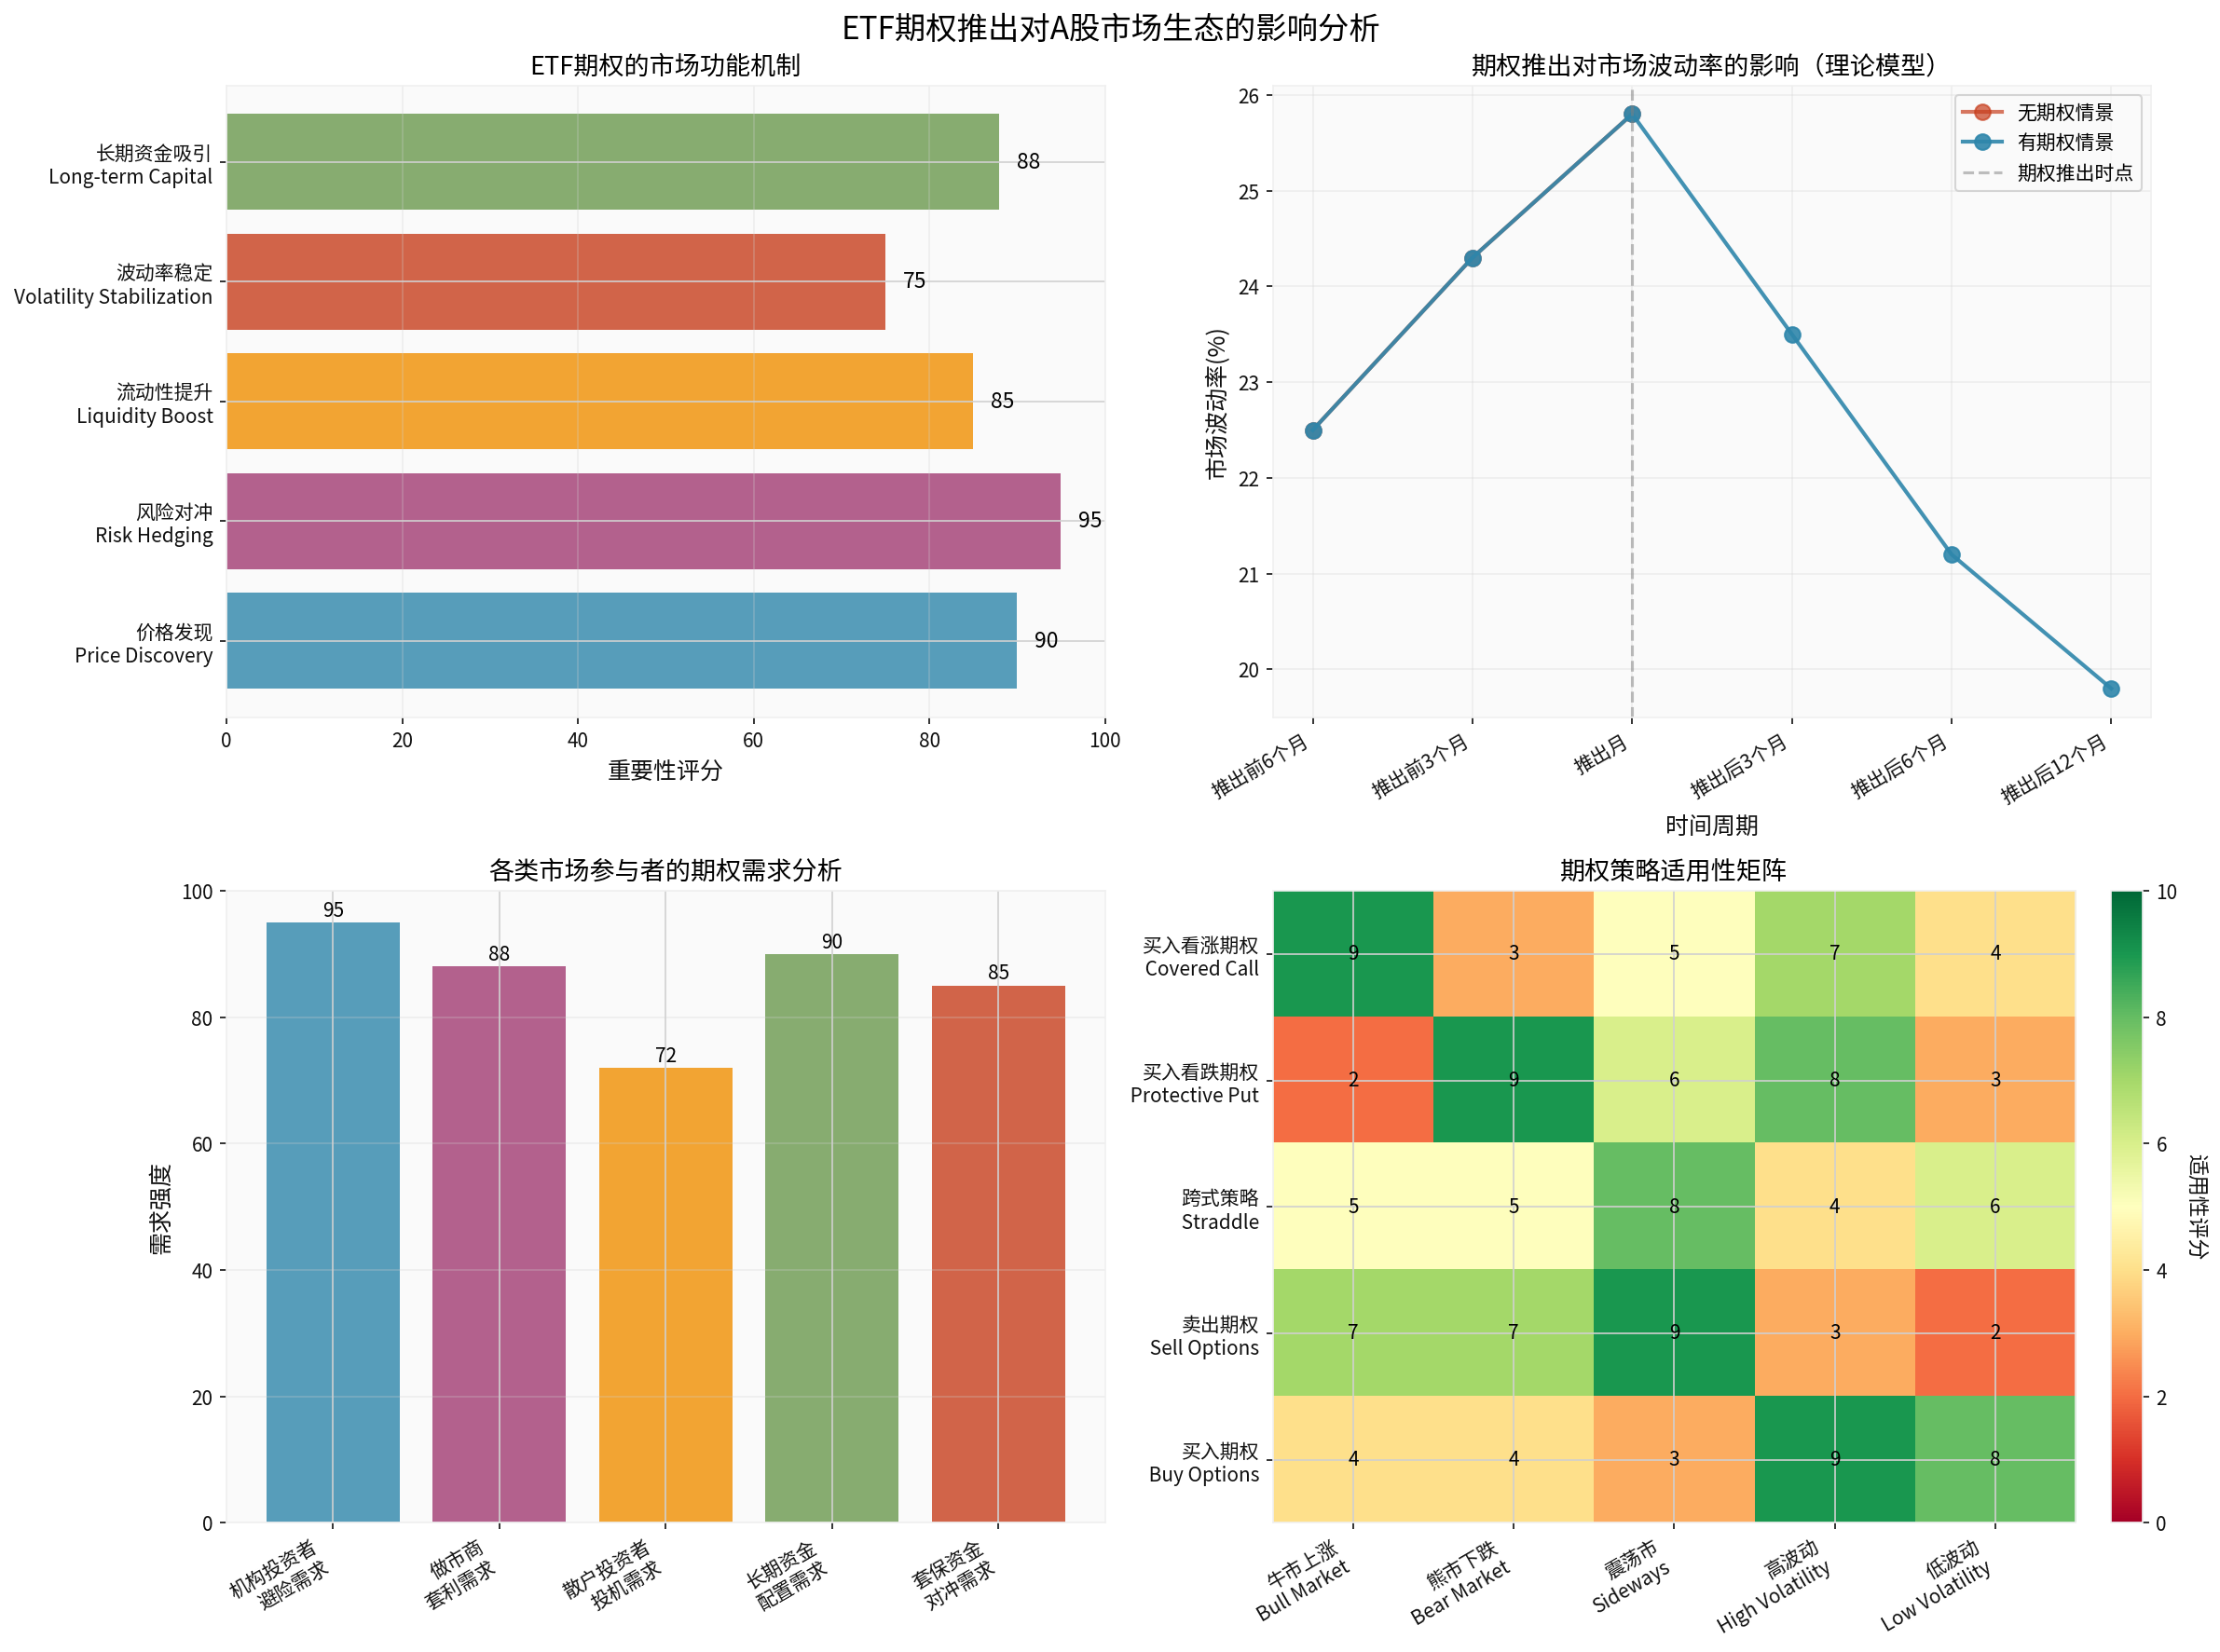
Based on international experience and historical impact of CSI 300 Index options [4][5], the launch of ETF options will play the following roles:
- The option market reflects market expectations for future volatility through implied volatility
- Provides forward-looking price signals for the spot market
- Improves market pricing efficiency
- Institutional investors can protect spot positions by buying Put Options
- Reduces market impact costs when large-scale funds enter or exit
- Provides “insurance” function during market declines to avoid panic selling
- Theoretically, market volatility will gradually decrease after option launch
- Experience from CSI 300 ETF option launch shows that long-term volatility shows a downward trend
- Provides more trading strategies to smooth one-sided market trends
- Insurance funds,pension fundsand other long-term funds have more complete risk management tools
- Enhances A-shares’ attractiveness to international capital
- Promotes the market transformation from “retail-dominated” to “institution-priced”
- Option market makers need to conduct delta hedging, increasing spot trading volume
- Reduces bid-ask spreads of index constituent stocks
- Improves overall market liquidity
- Attracts more institutional investors to participate
- Retail investors can indirectly participate in index investment through options
- Promotes the formation of a rational investment culture
- Protective Put: Hold ETF while buying put options to hedge downside risks
- Covered Call: Hold ETF while selling call options to enhance returns
- Straddle: Buy both call and put options simultaneously to profit from large fluctuations
- Collar Strategy: Range trading that limits risks and returns
In the CSI A500 Index, emerging sectors such as Industry (22.5%), Information Technology (14.8%), Communication Services (10.2%) and Healthcare (9.3%) account for a total of
-
High Beta Characteristics:
- Technology, semiconductor and other sectors are sensitive to market sentiment
- Larger gains in bull markets and deeper declines in bear markets
- Semiconductor ETF rose about 46% annually in 2025, while Daqin Railway fell nearly 20% [user-provided background information]
-
High Valuation Dependence:
- Emerging sectors generally use PEG valuation, which is sensitive to interest rate changes
- Valuation adjustment range may exceed profit change range
- Faces valuation compression risk when liquidity tightens
-
Strong Policy Sensitivity:
- Industrial policy adjustments have a greater impact on emerging sectors
- Changes in policies such as technological innovation and medical approval directly affect valuations
- Geopolitics have a significant impact on sectors such as semiconductors and communications
- High correlation between emerging sectors
- “Resonance effect” may occur when the market declines
- Diversification effect weakens in extreme market environments
- Many emerging sectors adopt high R&D investment models
- Performance fluctuations have a greater impact on stock prices
- May trigger “deleveraging” cycles during declines
- Retail investors have a high degree of participation in emerging sectors
- Prone to chasing ups and selling downs
- Social media effects amplify sentiment fluctuations
According to the historical performance of the CSI A500 Index [1][2]:
- Maximum Drawdown: -70.91% (slightly less than CSI 300’s -72.3%)
- Sharpe Ratio: 0.5 (better than CSI 300’s 0.46)
- Annualized Volatility: Although emerging sectors have high weights, the overall volatility has not significantly increased due to the industry balance mechanism
- Although emerging sectors have high weights, the industry balance mechanismeffectively controls concentration risks
- The weight of a single sample does not exceed 10%, and the total weight of the top five samples does not exceed40%[3]
- This design effectively controls tail risks while maintaining growth
- Institutional investors buy put options to hedge during market declines
- After market makers sell put options, they need to buy spot for delta hedging
- Forms a stabilizing force of “buying during declines”
- Rising implied volatility indicates increased market expectations of volatility
- Investors can adjust positions in advance to avoid panic in extreme situations
- Historical data shows that the frequency of extreme market volatility decreases after option launch [4][5]
- Strategies such as intertemporal arbitrage and volatility arbitrage increase market depth
- Differences in views among different investors form a balancing force
- Reduces extreme fluctuations in one-sided market trends
- Technology, healthcare and other sectors have high volatility
- Options provide precise risk hedging tools
- Reduces investors’ panic selling
- Long-term funds such as insurance and pensions need stable returns
- Options provide strategies like “Fixed Income + ETF Options”
- Enhances CSI A500’s attractiveness to long-term funds
- Overseas investors are accustomed to using options for risk management
- CSI A500 combines with interconnection mechanisms
- Option launch will further enhance internationalization
Based on the blogger’s analysis and current market characteristics, the 2026 A-share market may present:
- Low Growth: Economic growth slows down, and profit growth is under pressure
- High Valuation: After the rise in 2024-2025, some sectors are not undervalued
- Limited Policy Stimulus: Policy space is relatively limited
- Structural Differentiation: Industry and individual stock differentiation intensifies
- Core Position Allocation: As a core asset allocation for A-shares, it is recommended to account for30-50%
- Dollar-Cost Averaging: Use dollar-cost averaging at the current level (close to 4000 points) to smooth costs
- Band Operation: Use options to enhance returns or hedge risks
Select option strategies according to different market environments [5]:
| Market Environment | Recommended Strategy | Application Scenario |
|---|---|---|
Moderate Uptrend |
Covered Call | Hold ETF while selling call options to enhance returns |
Volatile Market |
Iron Condor | Sell out-of-the-money call and put options simultaneously to earn time value |
Downside Risk |
Protective Put | Hold ETF while buying put options to hedge downside risks |
High Volatility |
Straddle | Buy both call and put options simultaneously to profit from large fluctuations |
Low Volatility |
Sell Options | Profit from time value decay of options |
- Control Position: Do not fully allocate to a single index
- Diversify Investments: CSI A500 + Bonds + Overseas Assets
- Dynamic Adjustment: Adjust positions according to valuation and market sentiment
- Use Options: Buy put options to hedge at market highs
- Mainly allocate CSI A500 ETF
- Invest regularly and定额
- Avoid using options or only buy put options to hedge
- Core allocation of CSI A500 ETF
- Satellite allocation of industry ETFs
- Appropriately use Covered Call to enhance returns
- Flexibly allocate CSI A500 ETF
- Actively use option strategies
- Pay attention to market sentiment and valuation changes
-
Scientific and Reasonable Industry Allocation Logic
- Industry balance mechanism avoids excessive concentration
- High weights of emerging sectors align with the direction of China’s economic transformation and upgrading
- ESG and interconnection screening enhance internationalization
-
Excellent Long-term Performance
- Annualized return of 10.7%, Sharpe Ratio of 0.5
- Maximum drawdown control is better than CSI 300
- 2025 increase of 19.68%, excess return of 3.59%
- Market Stabilizer: Provides risk hedging tools to reduce extreme volatility
- Price Discovery: Improves market pricing efficiency
- Attract Long-term Funds: Improves A-share ecosystem and promotes institutional transformation
- Enrich Strategies: Provides more diversified investment tools for investors
-
High Weights of Emerging Sectors Do Bring Volatility Risks
- High Beta characteristics, high valuation dependence, strong policy sensitivity
- May amplify declines during market pullbacks
-
But Index Design Effectively Controls Risks
- Industry balance mechanism reduces concentration risks
- Strict weight limits (no more than 10% for a single stock, no more than 40% for top five)
- Historical maximum drawdown is even smaller than CSI 300
-
Options Can Further Manage Risks After Launch
- Provide precise hedging tools
- Reduce investors’ panic selling
- Promote stable market development
For the 2026 market, it is recommended:
- Strategically Optimistic: Hold CSI A500 Index for the long term to share the dividends of China’s economic transformation and upgrading
- Tactically Cautious: Control positions and use options to hedge risks
- Structurally Flexible: Adjust allocations according to market environment and actively use option strategies
[0] Gilin API Data (Stock Price Data, Market Index Data, Sector Performance Data)
[1] CSI A500 Index Compilation Plan, CSI Index Co., Ltd., August 2024 (https://oss-ch.csindex.com.cn/static/html/csindex/public/uploads/indices/detail/files/zh_CN/000510_Index_Methodology_cn.pdf)
[2] Sina Finance - “CSI A500: ‘Broad-based Representative’ of A-share New Quality Productivity” (https://finance.sina.com.cn/tech/roll/2025-12-18/doc-inhcfepp3192328.shtml)
[3] East Money - “Yongtai Energy’s Inclusion in CSI A500 Index Highlights Institutional Investors’ Recognition of Its Value and Valuation Reassessment” (https://caifuhao.eastmoney.com/news/20251225085054454536380)
[4] Securities Times - “CSI 300 Celebrates 20 Years as Core Benchmark of A-share Indices” (https://www.stcn.com/article/detail/2326041.html)
[5] Finance Channel - “How to Read Option Implied Volatility Charts?” (http://mp.cnfol.com/33950/article/1749777676-141842083.html)
[6] East Money - “Index ‘Metabolism’: How Does CSI A500 Component Adjustment Improve Industry Balance and Performance?” (https://finance.eastmoney.com/a/202512253601810293.html)
[7] National Business Daily - “CSI A500 ETF (159338) ‘Absorbs’ Over 10 Billion Yuan in 5 Days, Current Scale Exceeds 35 Billion Yuan” (https://www.nbd.com.cn/articles/2025-12-24/4192846.html)
[8] NetEase - “Find a Steady Happiness in A-shares” (https://www.163.com/dy/article/KHG2E1SC0556BWDT.html)
Insights are generated using AI models and historical data for informational purposes only. They do not constitute investment advice or recommendations. Past performance is not indicative of future results.
About us: Ginlix AI is the AI Investment Copilot powered by real data, bridging advanced AI with professional financial databases to provide verifiable, truth-based answers. Please use the chat box below to ask any financial question.